


The Apollo Lunar Surface Journal and Apollo Flight Journal
The Apollo Lunar Surface Journal and Apollo Flight Journal are impressive resources for exploring the Apollo missions. Throughout these journals, the air-to-ground transcripts for NASA’s Apollo missions are supplemented with commentaries, photos, videos, audio clips, diagrams, maps, and other documents, to delve deep into the details.
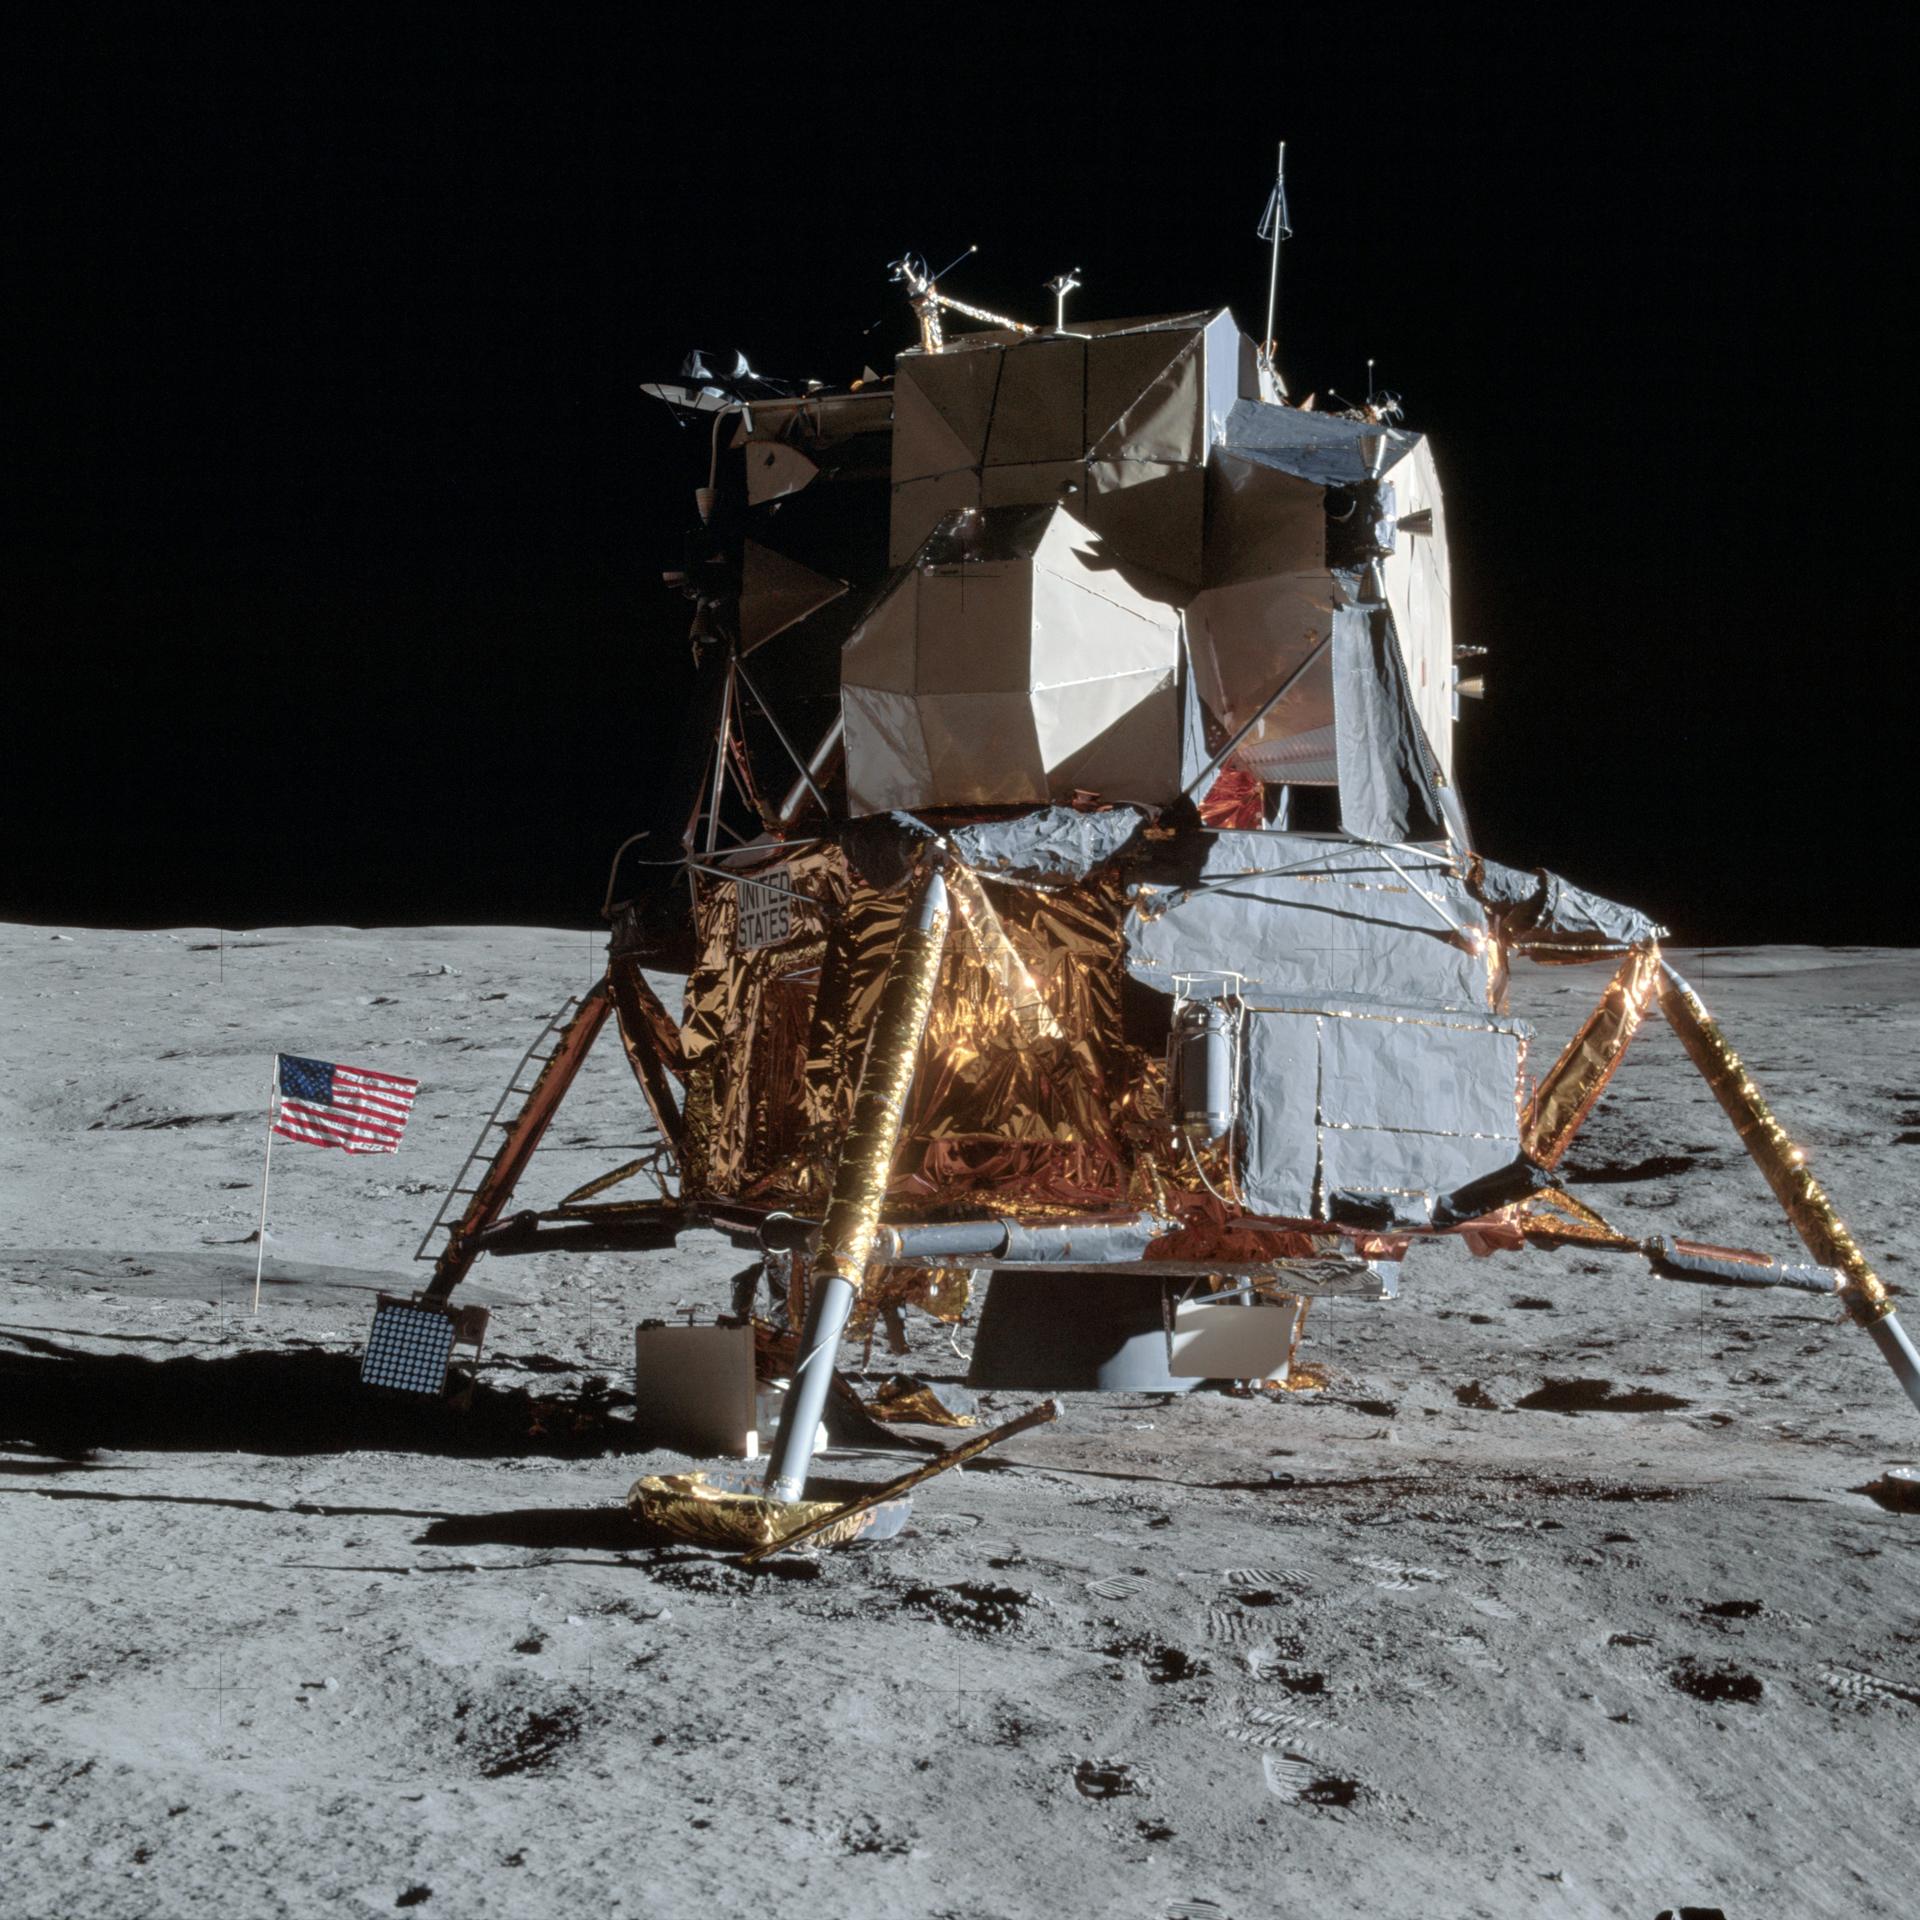
In 1988, Eric M. Jones had an epiphany while visiting Johnson Space Center. Jones, an astronomer fascinated by the history of human exploration, began studying air-to-ground transcripts produced during the Apollo missions to learn more about the experience of astronauts on the surface of the Moon. Inspired by the work of historian J.C. Beaglehole, who annotated the expedition journals of explorer Captain James Cook, Jones saw the potential to do the same with the Apollo Moon-landing transcripts. In April 1989, Jones sat down with Apollo 17 astronaut Harrison H. Schmitt, and over three days they worked together to thoroughly review a portion of the Apollo 17 activities on the Moon. Schmitt then introduced Jones to the other 11 Apollo astronauts who walked on the lunar surface, and over many, many hours the astronauts participated in recorded sessions, detailing every aspect of their missions.
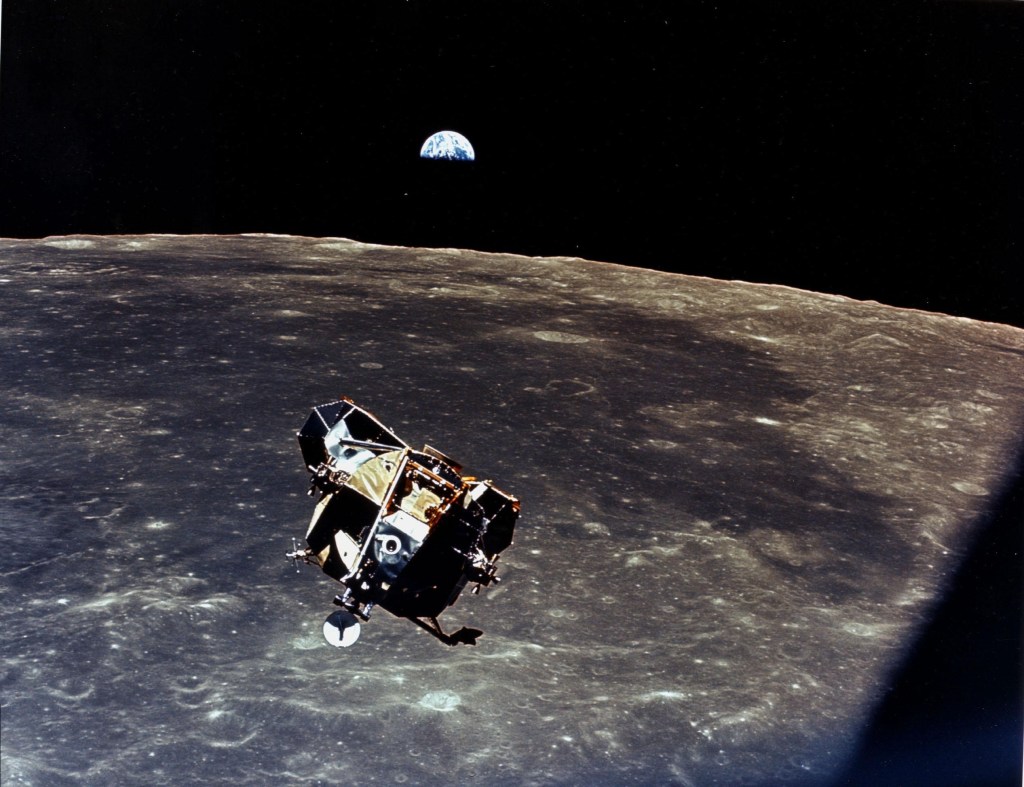
The result from this effort was the Apollo Lunar Surface Journal. First published online by Jones in mid-1995, the Apollo Lunar Surface Journal provides corrected and annotated transcripts of all the recorded conversations between the astronauts on the lunar surface and mission control in Houston. The transcripts are augmented with commentary from the editors and ten of the twelve moonwalking astronauts, as well as photos, maps, background documents, audio, and video clips. In the decades since it was first published, the detailed repository created by Jones and a host of volunteer contributors, has emerged as a space history resource of unparalleled value.
Drawing from the example of the Apollo Lunar Surface Journal, David Woods created a companion site in 1998 called the Apollo Flight Journal. While Jones’s project cataloged astronaut activities on the lunar surface, this journal, supplemented by numerous contributors from around the world, covers all portions of the crewed Apollo flights that did not take place on the Moon.
In 2023, Eric Jones was awarded a NASA Distinguished Public Service Medal in recognition of his contributions to documenting Apollo history with the Apollo Lunar Surface Journal, and in 2024, he was the recipient of the American Astronautical Society’s Ordway Award for this effort. Jones passed away in July 2025 at the age of 81, but the Apollo Journals continue today as living documents that provide insight into NASA’s Apollo missions.
The Apollo Journals
Explore the Apollo Lunar Surface Journal and Apollo Flight Journal to discover detailed historical resources on the Apollo missions.
Visit the Apollo Journals Website