


An intense August storm gave many Iowans a brief sense of what it might feel like to experience the strong winds of a hurricane.
The powerful, fast-moving, line of thunderstorms known as a derecho, blasted across Iowa Aug. 10 with extreme winds. The derecho did catastrophic damage to corn and soybean crops, caused widespread utility and property damage, and resulted in fatalities. NOAA estimates damage totals to be $7.5 billion, making it one of the most costly severe thunderstorm events in U.S. history.
To help officials in Iowa better understand the scale and scope of the disaster, a team of NASA researchers, led by Kris Bedka, a severe storm expert at NASA’s Langley Research Center in Hampton, Virginia, and colleagues at NASA’s Marshall Space Flight Center in Huntsville, Alabama and the University of Oklahoma, analyzed the storm using data and imagery from multiple Earth-observing satellites and weather radars on the ground.
“We’re trying to understand and demonstrate how state-of-the-art satellite and radar data can be used to identify the most intense areas of the storm and the damage they produced,” said Bedka.
His team’s analysis is helping to reveal a layered picture of a storm that was historically intense — even for a derecho.
“There’s evidence based on damage patterns in pockets throughout the state of Iowa that they saw winds exceeding 140 mph, which is extremely uncommon in these derecho systems,” said Bedka. “I mean, 100 mph is usually kind of your upper end. When you get to 140, that’s just a whole new level.”
These winds weren’t sustained like they’d be in a hurricane, but even just a minutes-long burst of 140 mph wind is enough to do significant and lasting damage to vegetation and structures.
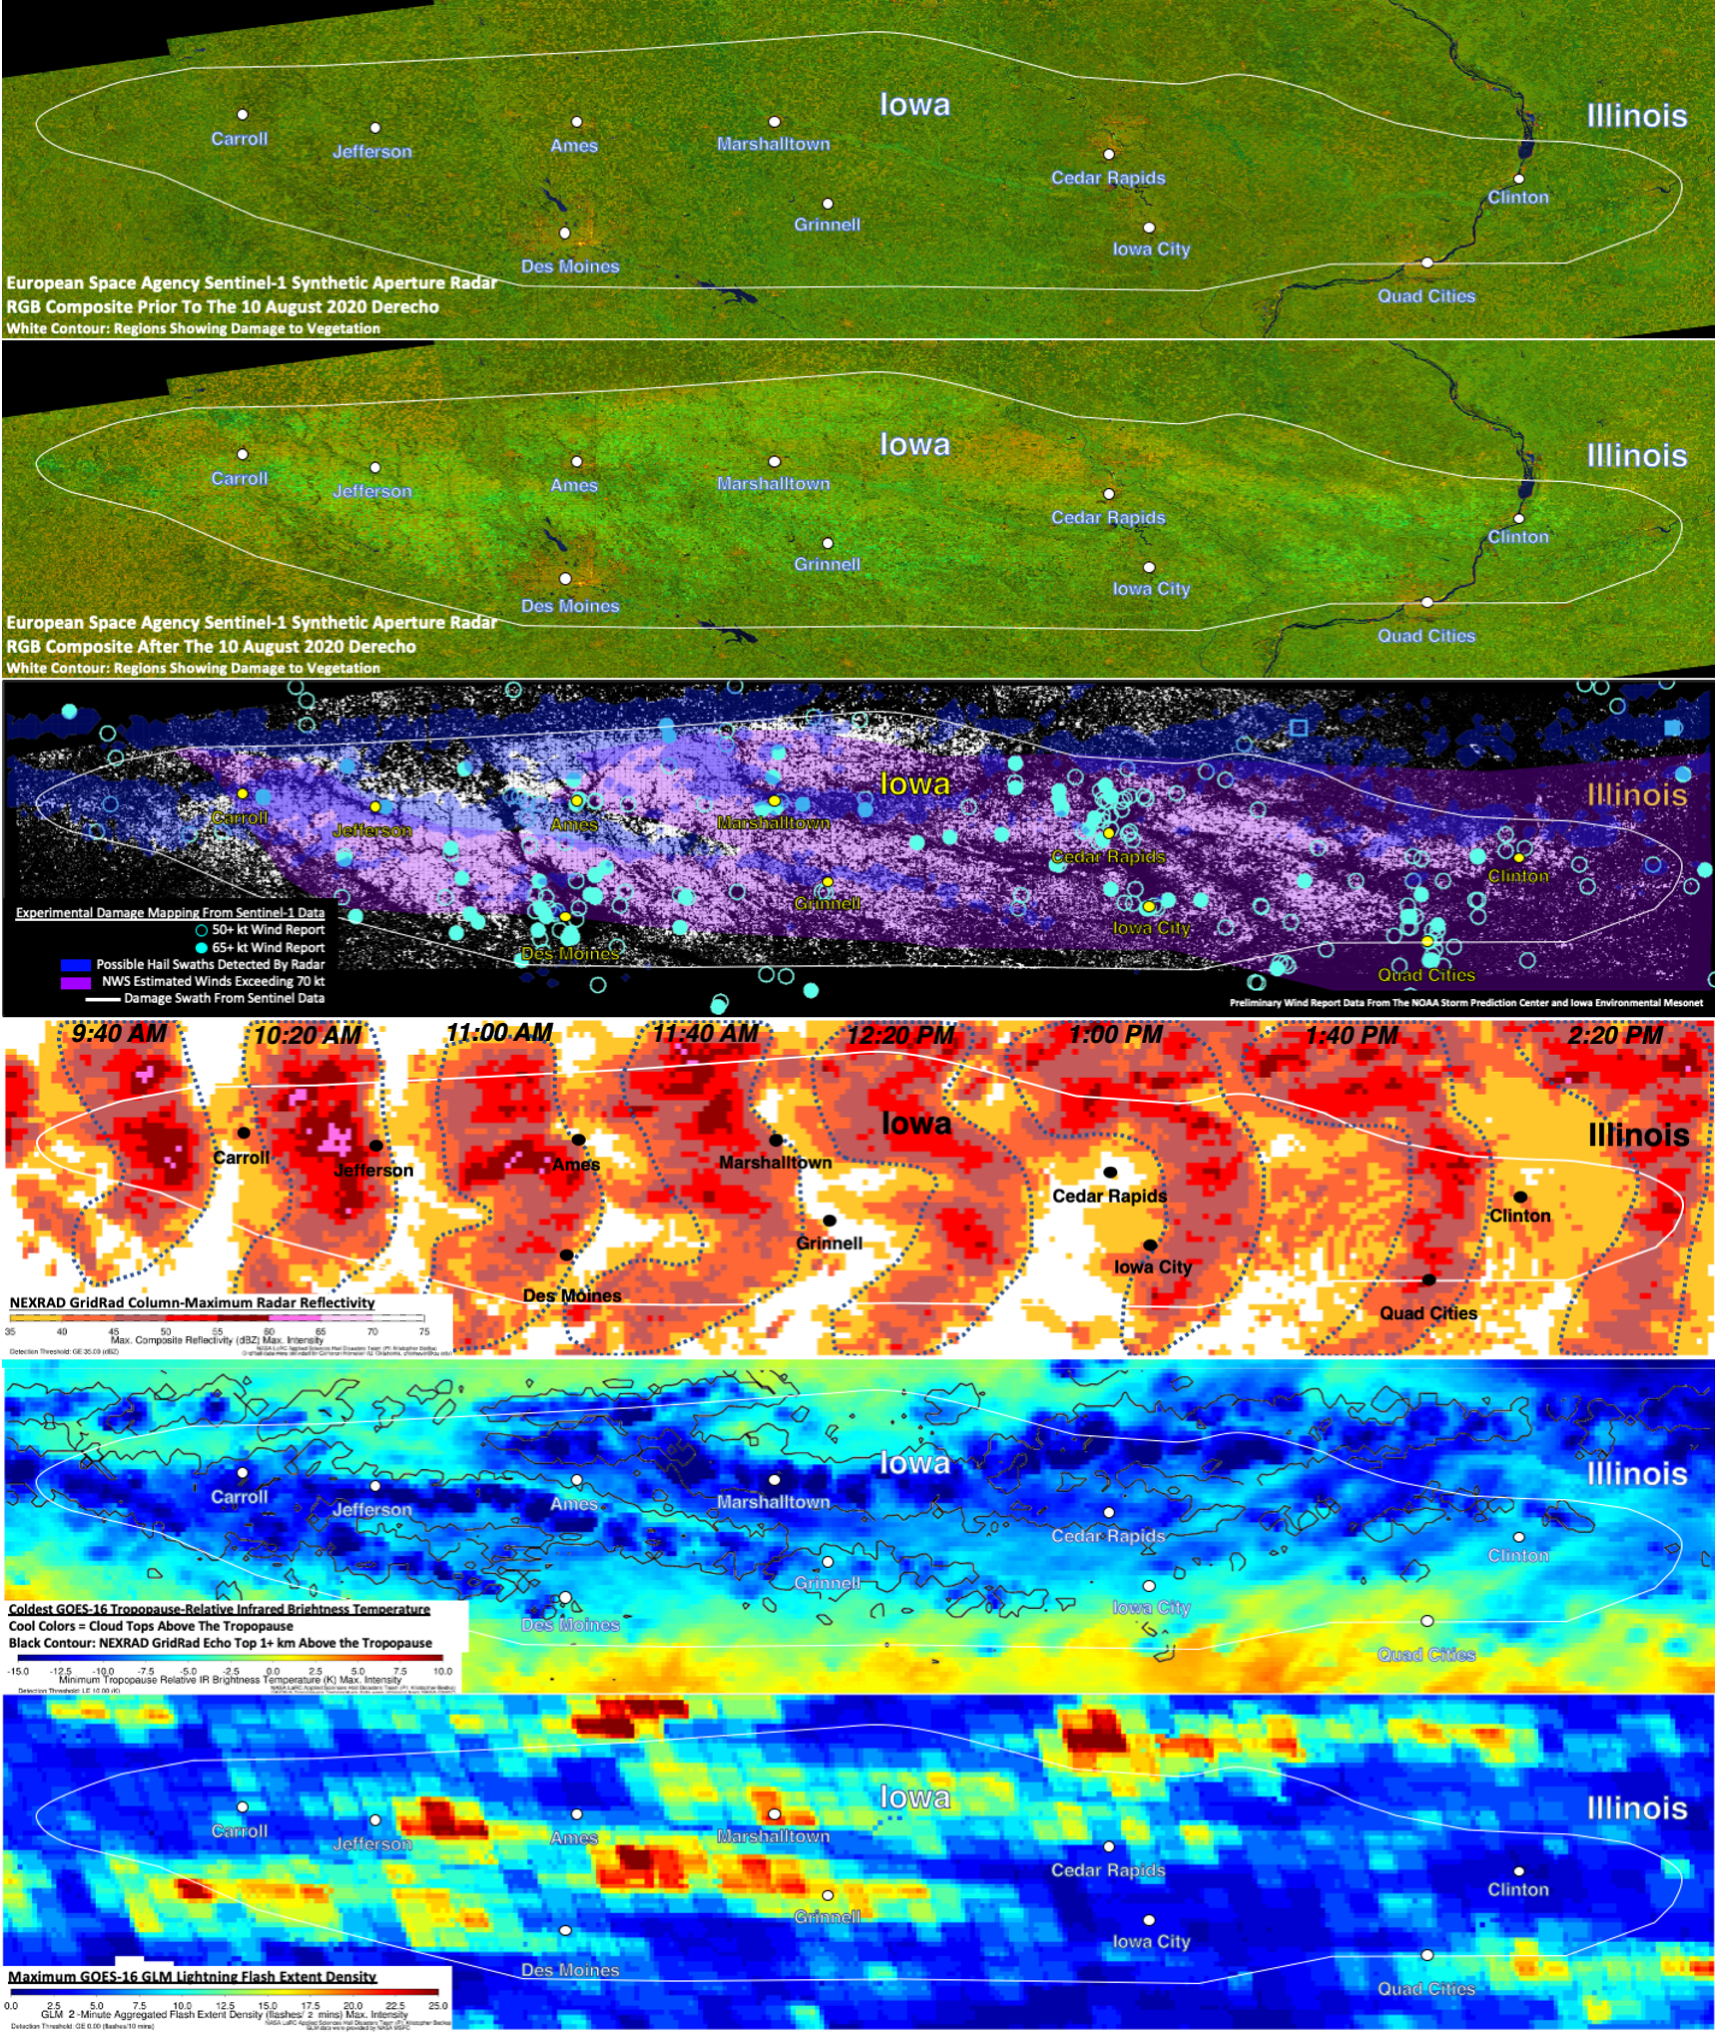
The imagery Bedka and his colleagues analyzed — visible in the compiled image series above, with the swath of the state that took the most damage outlined in white — showed remarkable agreement between what was happening in the clouds and the damage patterns the ground.
The first two images in the series are color composite synthetic aperture radar visualizations of ground vegetation taken by the European Space Agency’s Sentinel-1 satellite — the first before the storm, the second after. In the second image, the lighter green and some brown areas show large areas damaged by wind and, in some cases, hail, which can strip vegetation of its leaves.
The third image in the series superimposes ground wind reports, radar-detected swaths of possible hail and National Weather Service (NWS) wind estimates with the damage patterns visualized in the second image.
In the fourth image, which comes from several NWS NEXRAD Doppler weather radars, the maroon and pink represent areas of high reflectivity, a telltale signature of hail. Also, the pattern of the radar echoes changed as the derecho moved across Iowa, becoming more arc-shaped. The arc, often referred to by meteorologists as a “bow echo,” indicates where the strongest winds were occurring, which is aligned well with NWS estimates and damage evident in the Sentinel-1 data.
“Because of how the instrument aboard Sentinel-1 collects data, we were able to compare data acquired both pre- and post-derecho to understand how the structure of vegetation, especially mature agricultural crops, were impacted and changed,” said Jordan Bell, research scientist in the Earth Science Branch at Marshall. “Synthetic aperture radar is being used for more and more applications, so it was exciting to provide impactful analysis for this event.”
The cool blues in the next-to-last image from the National Oceanic and Atmospheric Administration’s Geostationary Operational Environmental Satellite East-16 (GOES-16) represent areas where tall, cold clouds that penetrated deep into the stratosphere were likely driving powerful wind downbursts. These are also areas where updrafts suspend water droplets long enough to form hail.
The warm yellows and reds in the final image, also from GOES-16, are areas of high lightning flash density, another indicator of storm intensity.
This layered analysis has been a valuable resource to Justin Glisan, state climatologist in the Iowa Department of Agriculture and Land Stewardship, as he continues to unravel what happened.
“The remote sensing products produced by the NASA team have given us a tremendous set of tools to study the agricultural damage produced by the Aug. 10 derecho event that impacted 57 of Iowa’s 99 counties, one of the most significant weather events Iowa agriculture has experienced,” said Glisan. “As state climatologist of Iowa, having these additional and remarkable products in the toolbox will provide excellent guidance as we continue analyzing this catastrophic event.”
The analysis has even been useful to officials in neighboring Illinois, which also experienced severe weather from the derecho as it plowed east into the northern part of the state.
“In the several days after the event I was reaching out to folks around northern Illinois to try to determine the extent and severity of damage. Unfortunately, that kind of search usually turns up photos and reports of the most severe damage, but no context as to the extent of that damage,” said Trent Ford, climatologist with the Illinois State Water Survey at the University of Illinois. “The satellite data and analysis shared with me by Kris and his team were very valuable to both better understand the extent of derecho damage and confirm reports of severe damage in both northwest and northeast Illinois.”
This project was funded by NASA’s Earth Science Disasters Program.
Joe Atkinson
NASA Langley Research Center