


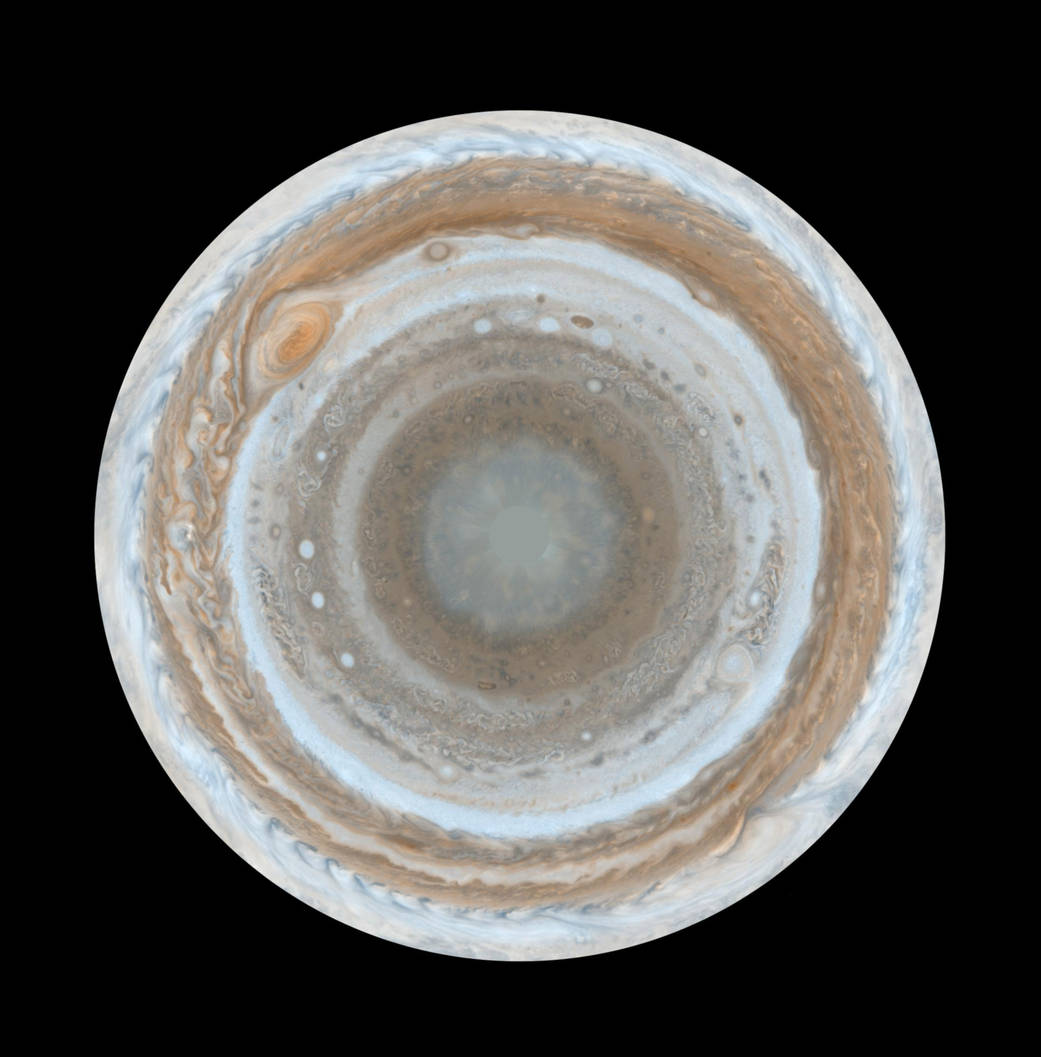
This map of Jupiter is the most detailed global color map of the planet ever produced. The round map is a polar stereographic projection that shows the south pole in the center of the map and the equator at the edge. It was constructed from images taken by Cassini on Dec. 11 and 12, 2000, as the spacecraft neared Jupiter during a flyby on its way to Saturn.
The map shows a variety of colorful cloud features, including parallel reddish-brown and white bands, the Great Red Spot, multi-lobed chaotic regions, white ovals and many small vortices. Many clouds appear in streaks and waves due to continual stretching and folding by Jupiter’s winds and turbulence. The bluish-gray features along the north edge of the central bright band are equatorial “hot spots,” meteorological systems such as the one entered by NASA’s Galileo probe. Small bright spots within the orange band north of the equator are lightning-bearing thunderstorms. The polar region shown here is less clearly visible because Cassini viewed it at an angle and through thicker atmospheric haze.Image Credit: NASA/JPL/Space Science Institute