


NASA Adds Up Deadly Hurricane Matthew’s Total Rainfall
A NASA rainfall analysis estimated the amount of rainfall generated by Hurricane Matthew when it moved over the Carolinas.
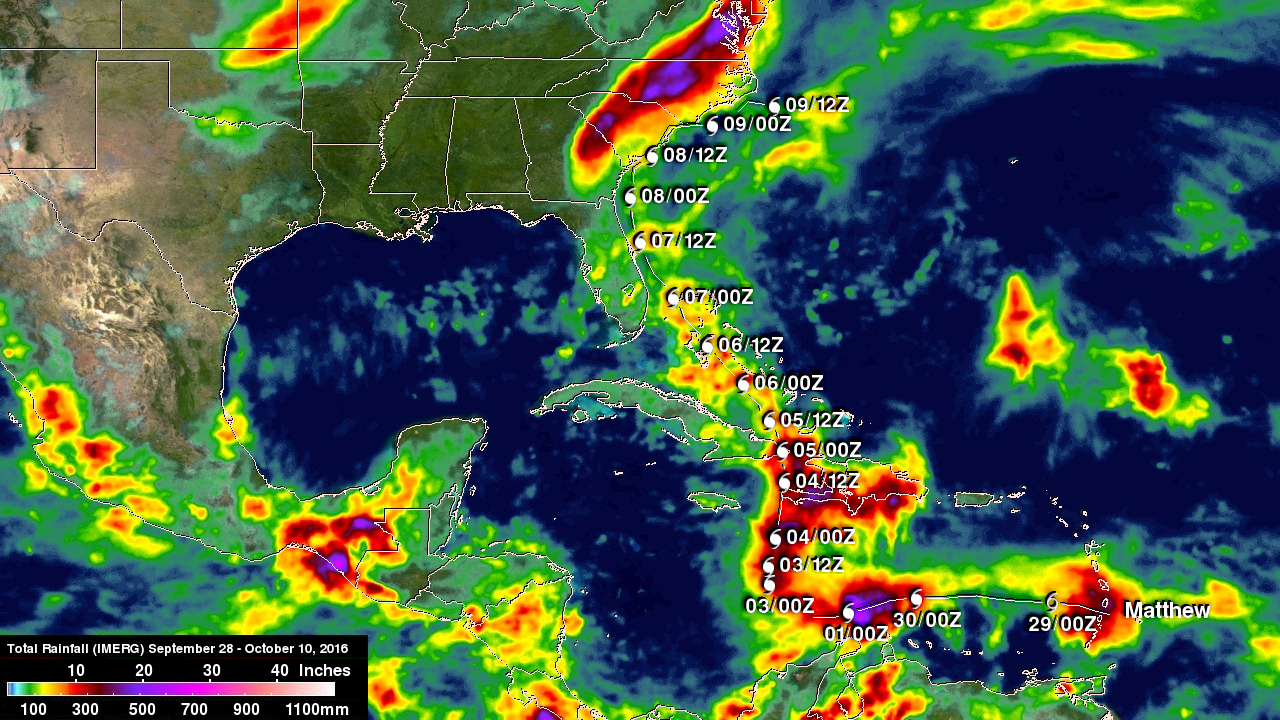
Hurricane Matthew dropped a lot of rain, caused flooding and deaths in the state of North Carolina. Flooding is still widespread in North Carolina. Some rivers in North Carolina such as the Tar and the Neuse Rivers were still rising on Oct. 12.
At NASA’s Goddard Space Flight Center in Greenbelt, Maryland a rainfall analysis was accomplished using data from NASA’s Integrated Multi-satellitE Retrievals for GPM (IMERG). The GPM or Global Precipitation Measurement mission is a joint mission between NASA and the Japanese space agency JAXA.
Credits: NASA/JAXA, Hal Pierce
The Integrated Multi-satellitE Retrievals for GPM (IMERG) is a unified U.S. algorithm that provides a multi-satellite precipitation product. IMERG is run twice in near-real time with the “Early” multi-satellite product being created at about 4 hours after observation time and a “Late” multi-satellite product provided at about 12 hours after observation time.
This rainfall analysis was created using IMERG real time data covering the period from Sept. 28 through Oct. 10, 2016. The totals included some rain from a low pressure area that moved through the area near the end of September.
Hurricane Matthew’s interaction with a frontal boundary caused extreme rainfall in North Carolina resulting in over 20 inches (508 mm) of rain being reported in North Carolina. The area was already saturated before Hurricane Matthew arrived. Heavy rainfall from a slow moving low and frontal system moved through during the last week of September. Maximum rainfall total estimates for the real-time IMERG product have been adjusted to reflect observed values.
On Wednesday, Oct. 12 the National Weather Service (NWS) in Wilmington, North Carolina (NC) reported “All major area rivers will remain above flood stage throughout this upcoming week. At 10:59 a.m. EDT on Oct. 12, the North Carolina Department of Transportation reported numerous flooded roads persisting across much the coastal plain of North Carolina. This being the result of heavy rainfall totaling 5 to 12 inches across the region in the last 36 hours. Many roads are impassable, barricaded or washed away. Some neighborhoods are cut off. Swamps, creeks and rivers are still rising flooding even more areas and slowing the recession of high water. People in the warned area should not travel and be prepared for widespread flooding of a magnitude not seen in many years. If asked to evacuate please do so.”
Credits: NASA SVS
Further south, a Flood Warning has been extended for the following rivers: Cape Fear at Elizabethtown affecting Bladen County NC; Cape Fear at Lock and Dam 1 affecting Bladen County NC; Black Creek at Quinby affecting Darlington and Florence Counties South Carolina (SC); Lynches at Effingham affecting Florence County SC.
In addition, a Flood Warning continues for the following rivers: Cape Fear at William O. Huske Lock and Dam 3 affecting Bladen County NC; Northeast Cape Fear near Burgaw affecting Pender County NC; Lumber Near Lumberton affecting Robeson County NC; Little Pee Dee at Galivants Ferry affecting Dillon, Horry and Marion Counties, SC; Waccamaw at Conway affecting Horry County SC; Great Pee Dee at Pee Dee affecting Marion and Florence Counties SC; and Black at Kingstree affecting Williamsburg County SC.
For updated River Forecasts from the NWS, visit: http://water.weather.gov/ahps2/forecasts.php?wfo=ilm
Hal Pierce/Rob Gutro
NASA’s Goddard Space Flight Center
Oct. 10, 2016 – NASA Gets a Last Look at Post-Tropical Cyclone Matthew Before It was Swallowed Up
Post-Tropical Cyclone Matthew was swallowed up or absorbed by a cold front on Oct. 10, but NASA’s Terra satellite captured a last look at the storm before that happened.
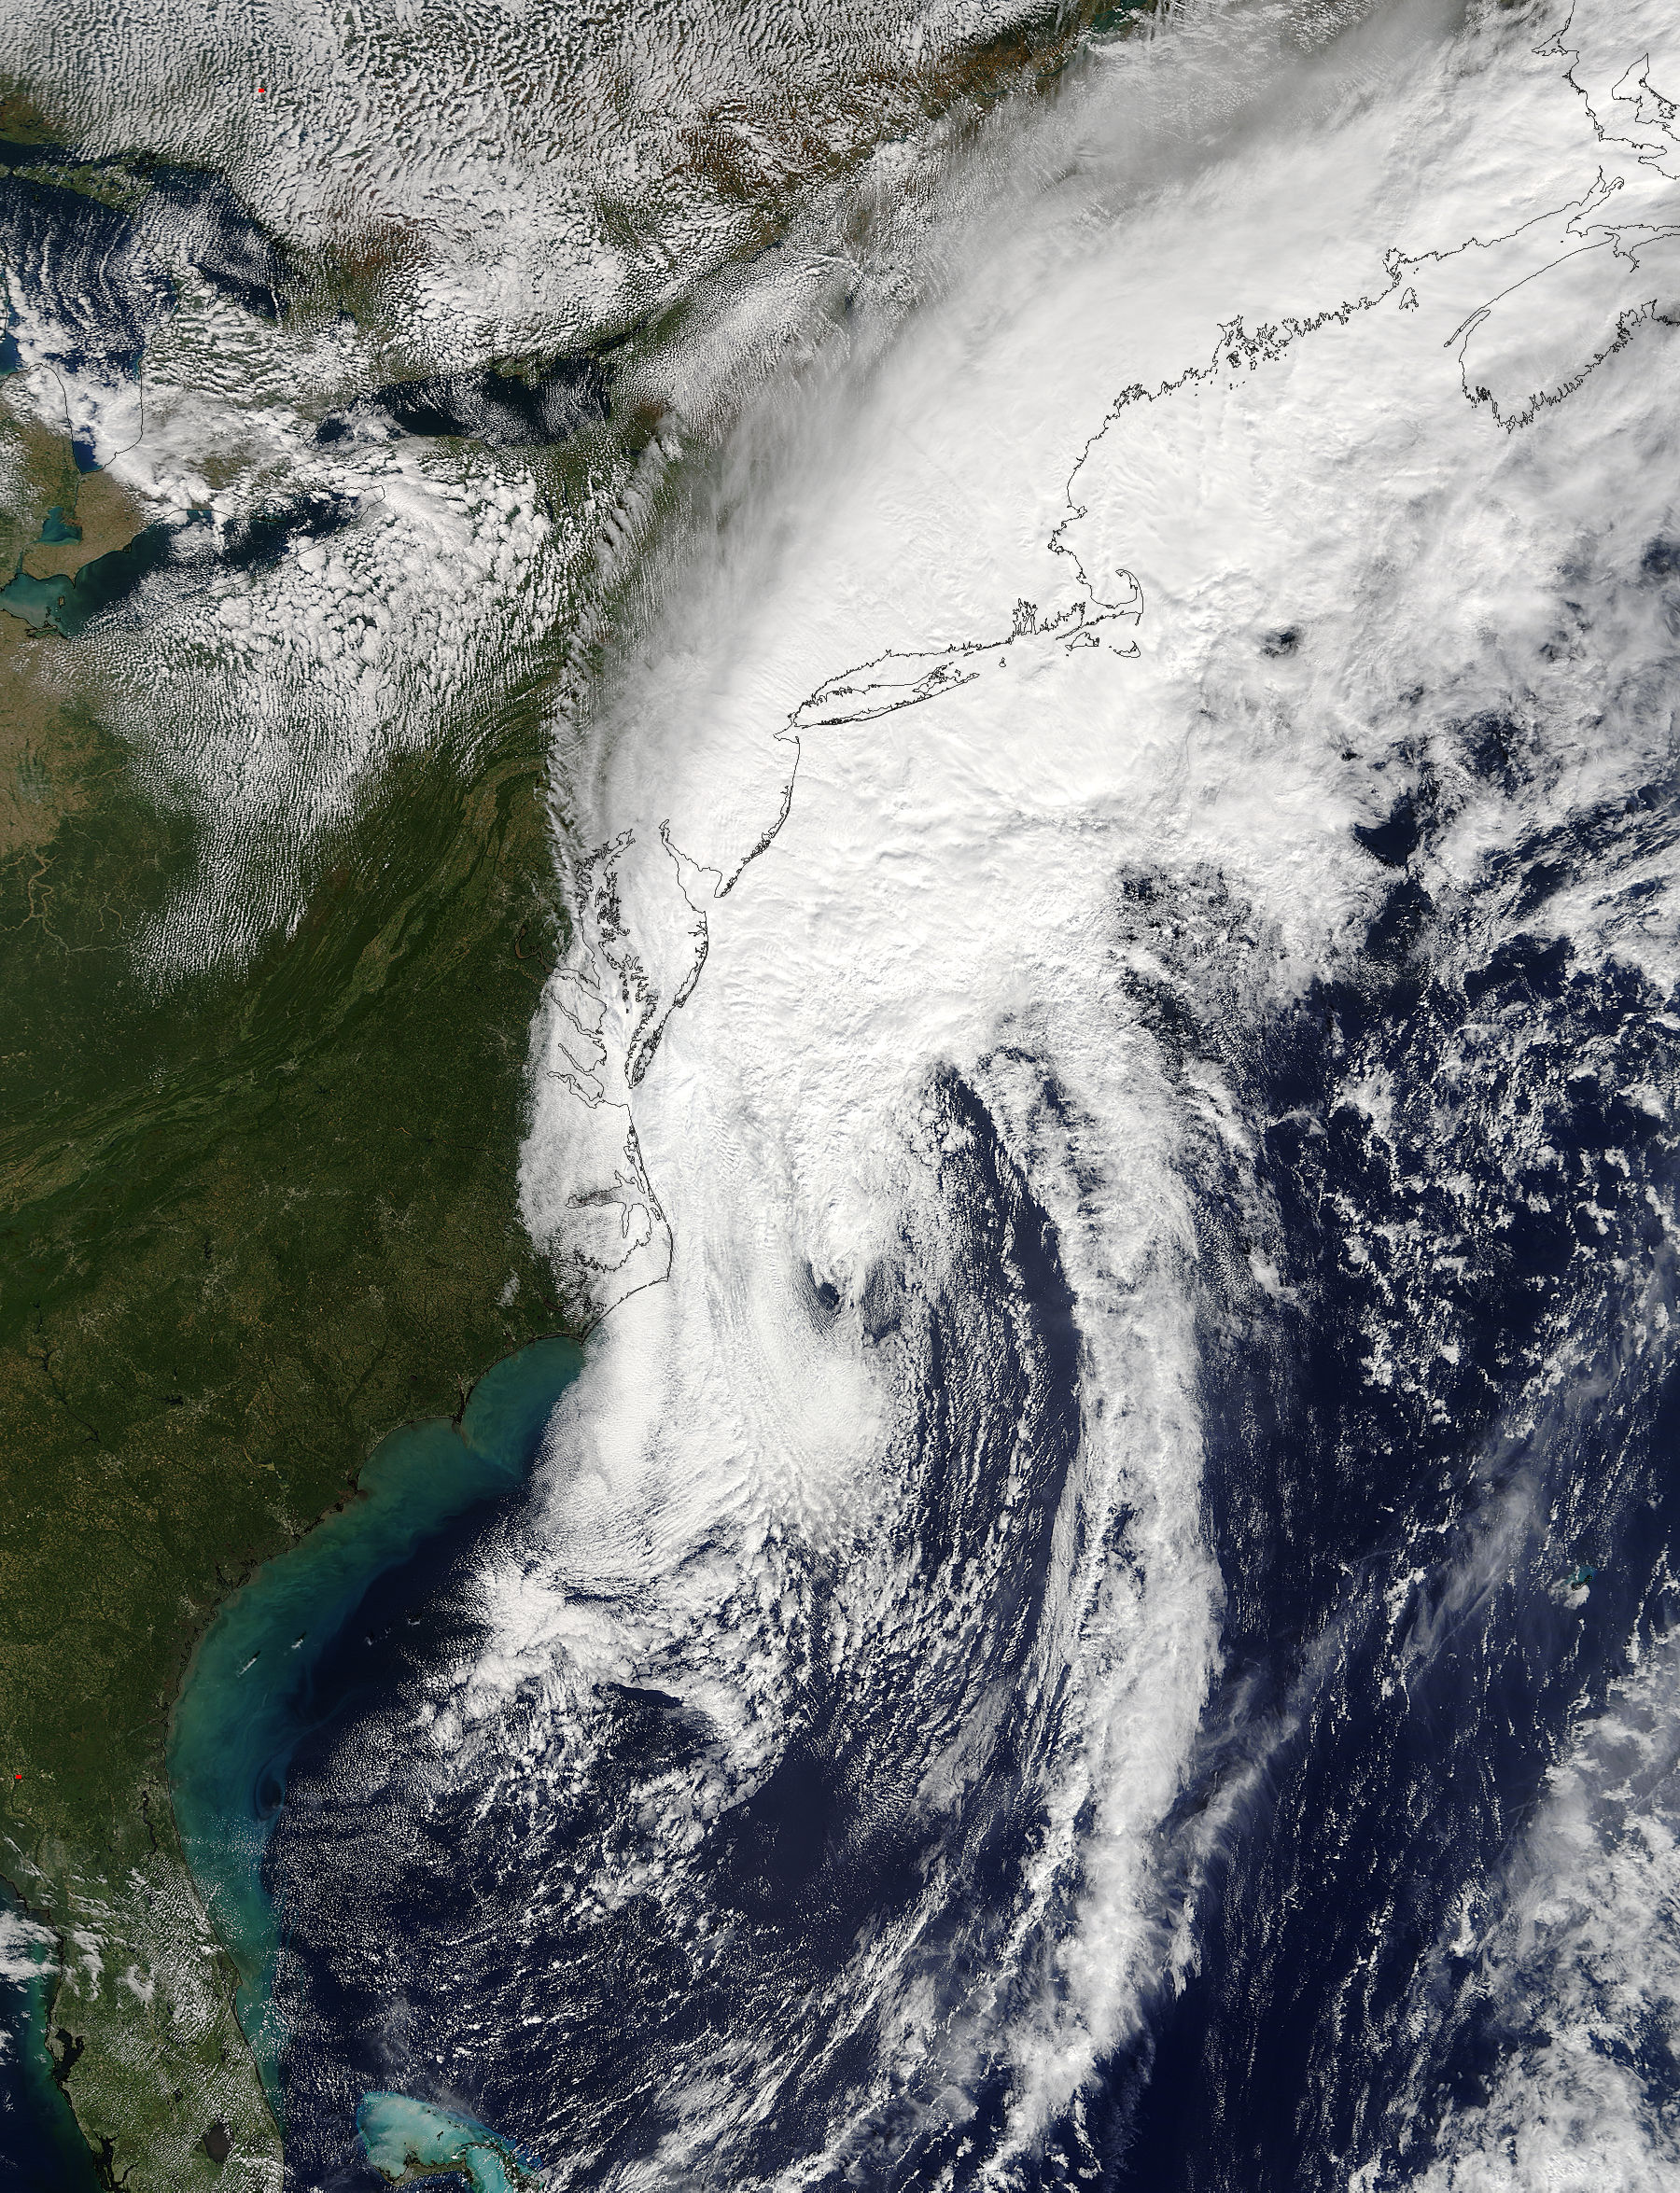
On Sunday, Oct. 9, 2016 at 11:45 a.m. EDT (1545 UTC) the Moderate Resolution Imaging Spectroradiometer or MODIS instrument aboard NASA’s Terra satellite captured a last look at Post-Tropical Cyclone Matthew as it was being absorbed by a cold front along the U.S. Eastern Seaboard.
At 5 p.m. EDT (2100 UTC) NOAA’s National Hurricane Center (NHC) issued the final advisory on Post-Tropical Cyclone Matthew when it was located near 35.4 degrees north latitude and 72.0 degrees west longitude. That’s about 200 miles (320 km) east of Cape Hatteras, North Carolina. The post-tropical cyclone was moving toward the east-northeast near 15 mph (24 kph).
Maximum sustained winds were near 75 mph (120 kph) with higher gusts. Some weakening is forecast tonight, and the NHC said “the low is expected to be absorbed within a frontal boundary on Monday [Oct. 10].”
On Monday, Oct. 10, the NHC reported that the remnant surface low pressure area of Matthew was centered off the Delmarva region near 38 degrees north and 68 degrees west. Matthew’s remnants were now part of the cold front that extends to the southeastern Bahamas.
Rob Gutro
NASA’s Goddard Space Flight Center
Oct. 09, 2016 – NASA Sees Post-Tropical Cyclone Matthew’s Rainfall North of Its Center
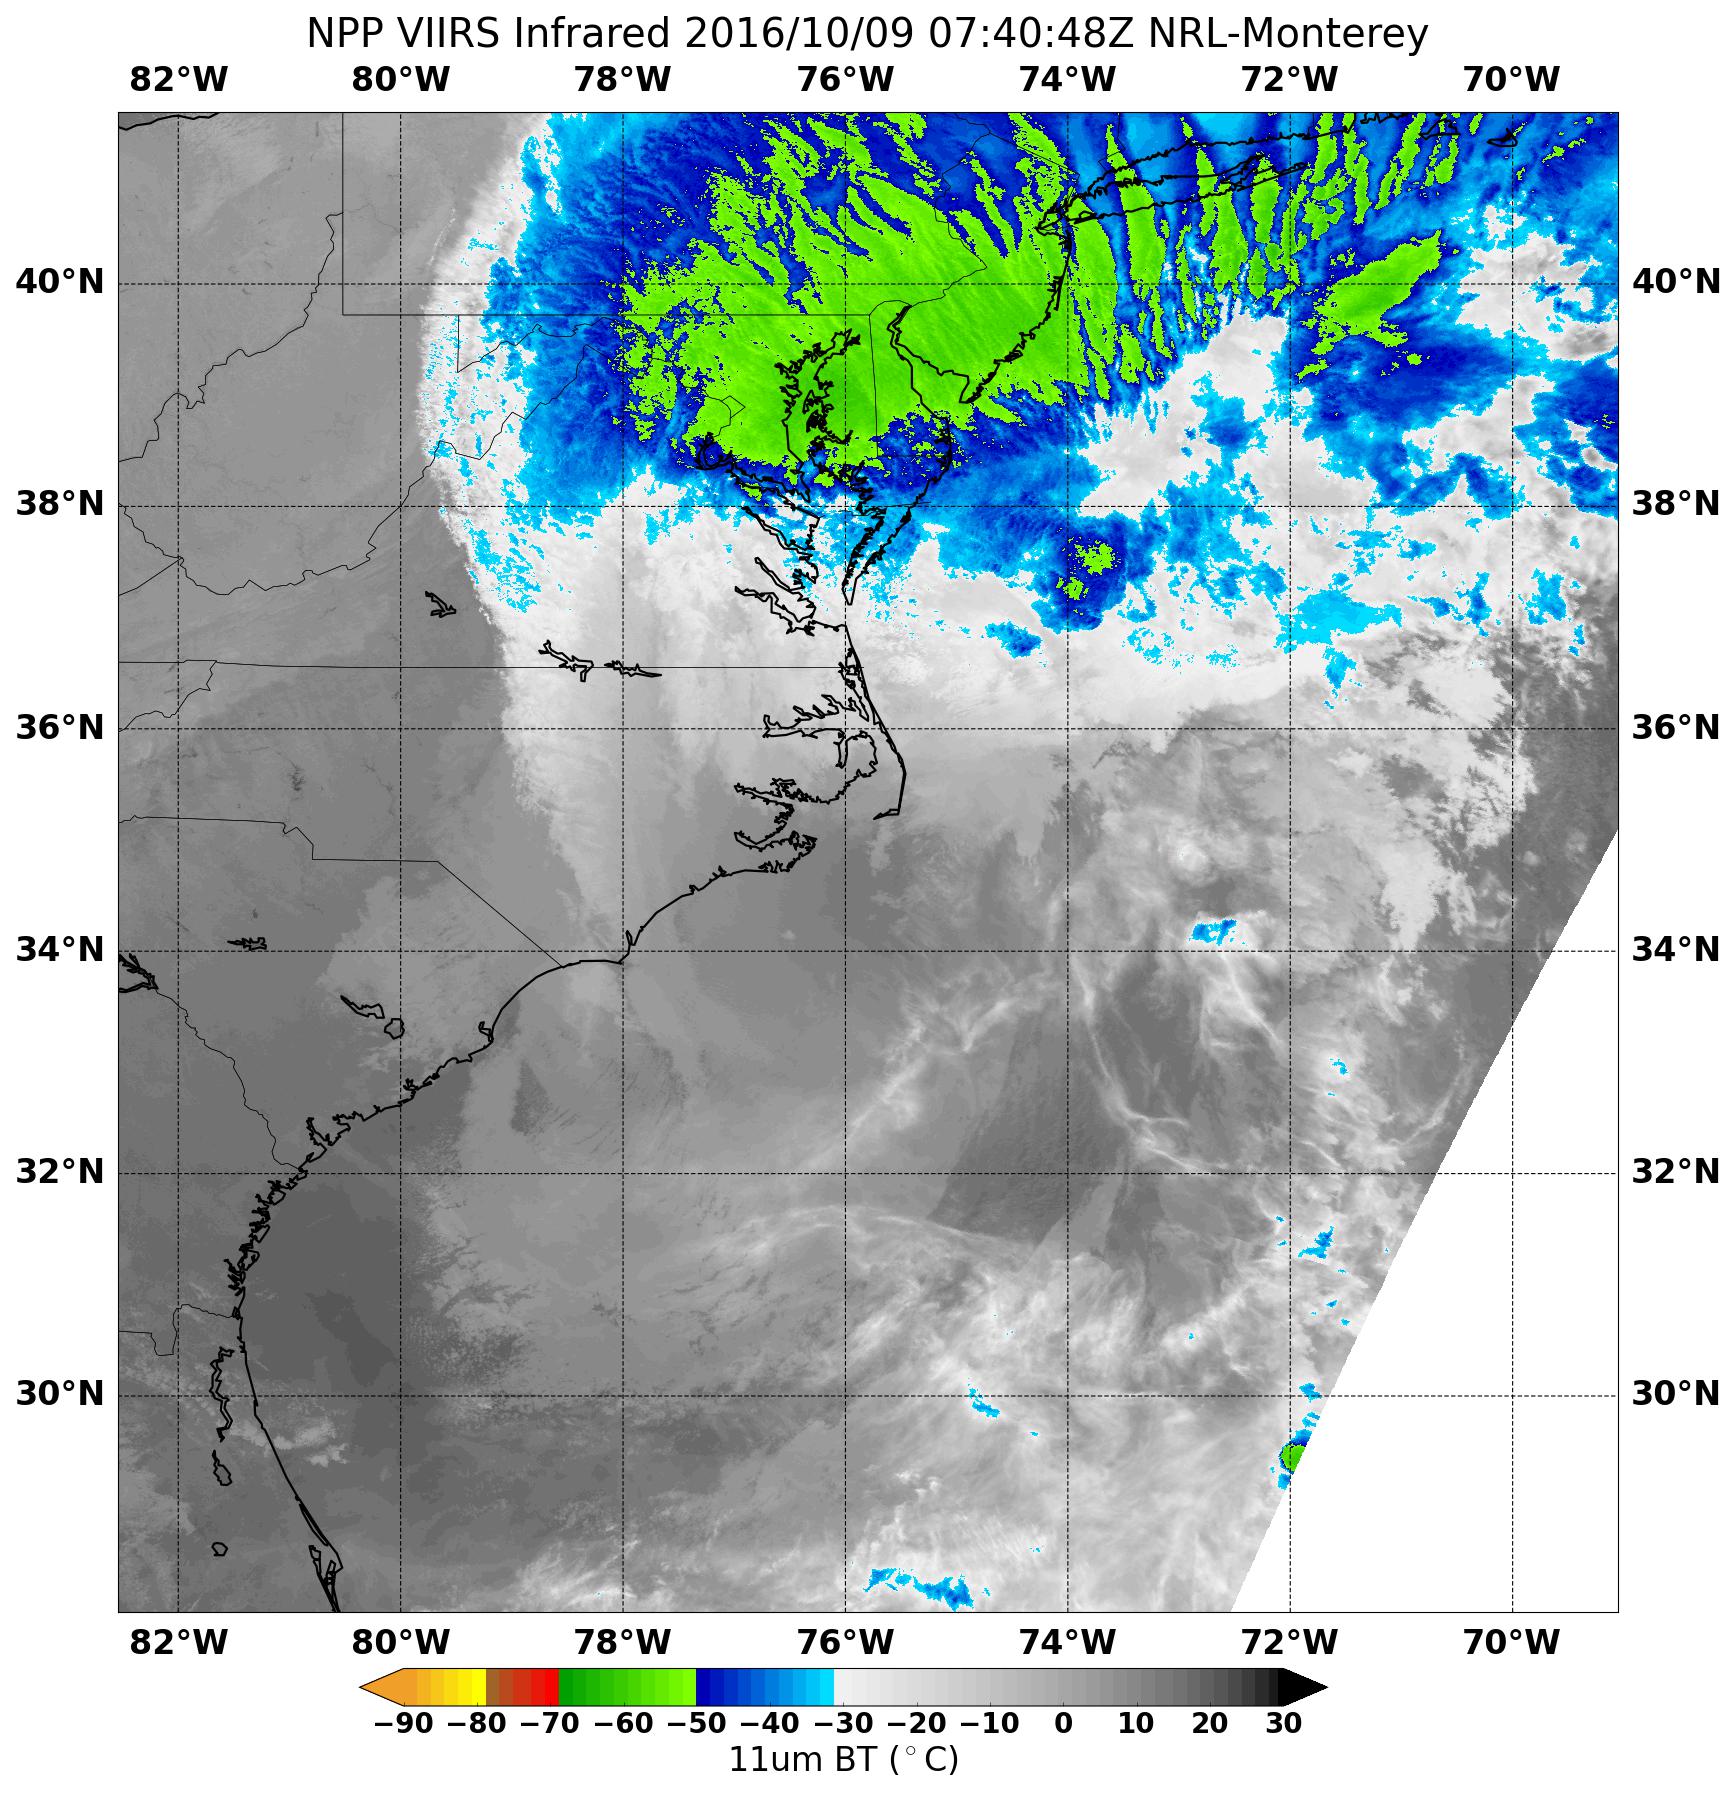
Hurricane Matthew became a post-tropical cyclone on Sunday, Oct. 9 as a result of interaction with a cold front along the Eastern U.S. NASA-NOAA’s Suomi NPP satellite provided an infrared view that showed the bulk of its rainfall north of its center.
At 8 a.m. EDT on Oct. 9 Matthew still has hurricane-strength winds and still poses a threat to coastal North Carolina. The National Hurricane Center (NHC) noted that hurricane-force wind gusts and sound-side storm surge flooding were occurring over the North Carolina Outer Banks.
A Hurricane Watch was in effect on Oct. 8 from north of Surf City to Duck, North Carolina and the Pamlico and Albemarle Sounds. A Tropical Storm Warning wass in effect from Cape Fear to Duck and the Pamlico and Albemarle Sounds
On Oct. 9 at 3:40 a.m. EDT (0740 UTC) NASA-NOAA’s Suomi NPP satellite passed over Post Tropical Cyclone Matthew and measured cloud-top temperatures. The Visible Infrared Imaging Radiometer Suite (VIIRS) instrument aboard NASA-NOAA’s Suomi NPP satellite captured an infrared image of the storm that revealed the location of coldest cloud top temperatures and strongest storms. VIIRS data showed cloud top temperatures of powerful storms as cold as minus 50 degrees Fahrenheit (minus 45.4 Celsius) were found north of the center of circulation.
According to the National Hurricane Center, surface observations indicate that a cold front should overtake Matthew’s center resulting in extratropical transition. Global and regional computer models show that Matthew should slowly weaken over the next two days and Matthew’s circulation is expected to dissipate within the frontal system.
NHC forecaster Stewart noted “Satellite and radar imagery indicate that Matthew has become a post-tropical cyclone, with the closest deep convection now located more than 150 nautical miles north and northeast of the exposed low-level center. Despite this change in structure, surface observations across eastern North Carolina and an earlier ASCAT pass indicate that strong winds persist northwest through southwest of the center.”
At 8 a.m. EDT (1200 UTC), the center of Post-Tropical Cyclone Matthew was located about 60 miles (95 km) east-southeast of Cape Hatteras, North Carolina near 35.0 degrees north latitude and 74.5 degrees west longitude.
Matthew is moving toward the east-northeast near 14 mph (22 kph) and a motion toward the east-northeast or east is expected for the next couple of days. On the forecast track, the center of Matthew will move farther offshore of the coast of the North Carolina Outer Banks today and tonight, according to the NHC.
Maximum sustained winds are near 75 mph (120 kph) with higher gusts. Gradual weakening is forecast during the next 48 hours. The estimated minimum central pressure is 984 millibars.
The National Weather Service reported a coastal marine observing site near Hatteras, North Carolina, indicated sustained winds of 63 mph (102 kph) with a gust to 84 mph (135 kph). A wind gust to 90 mph (127 kph) was measured at an elevated private weather station near Nags Head, North Carolina, and a wind gust to 70 mph (113 kph) has been observed at Dare County Airport near Manteo, North Carolina.
Matthew is now fully embedded within the mid-latitude westerly (wind) flow. That flow is expected to push Matthew to the east-northeast and away from the coast of North
Carolina today. An eastward motion is expected by tonight and should continue until Matthew dissipates in 48 hours or so.
For local forecasts and effects of winds, rain and storm surge, visit the NHC website: www.nhc.noaa.gov.
Rob Gutro
NASA’s Goddard Space Flight Center
Oct. 8, 2016 – Satellites See Hurricane Matthew’s Center Near Coastal South Carolina
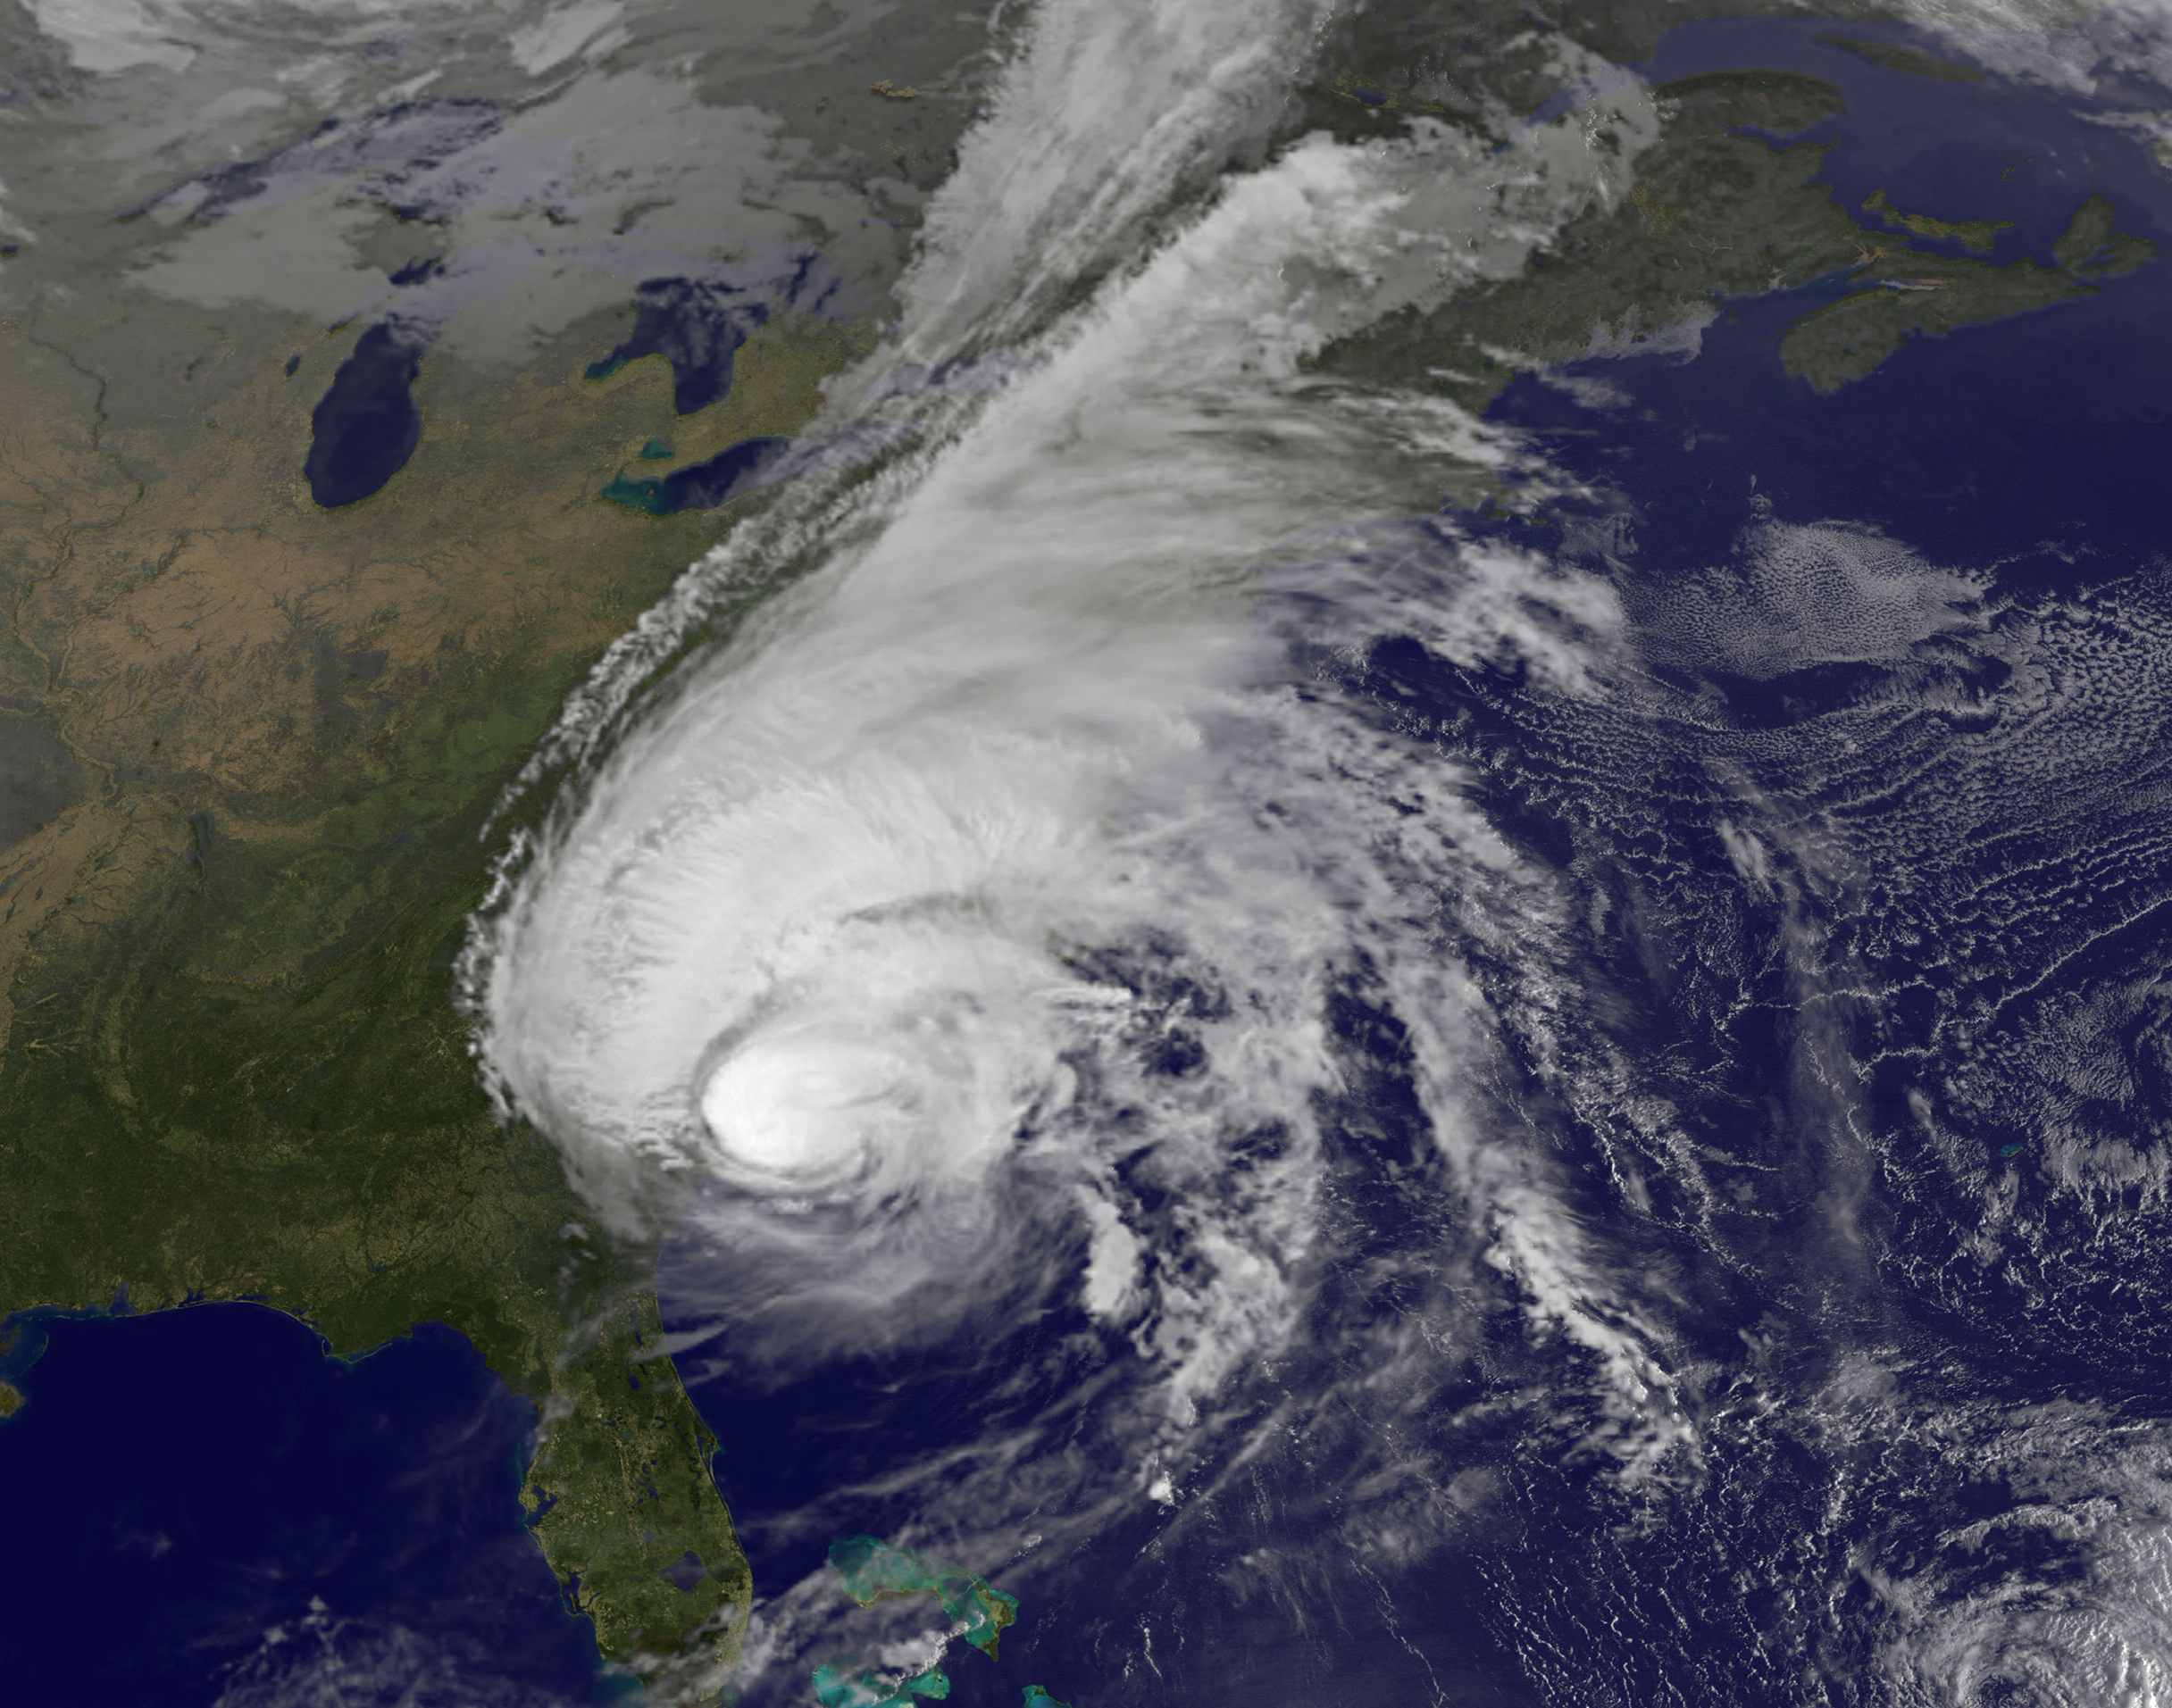
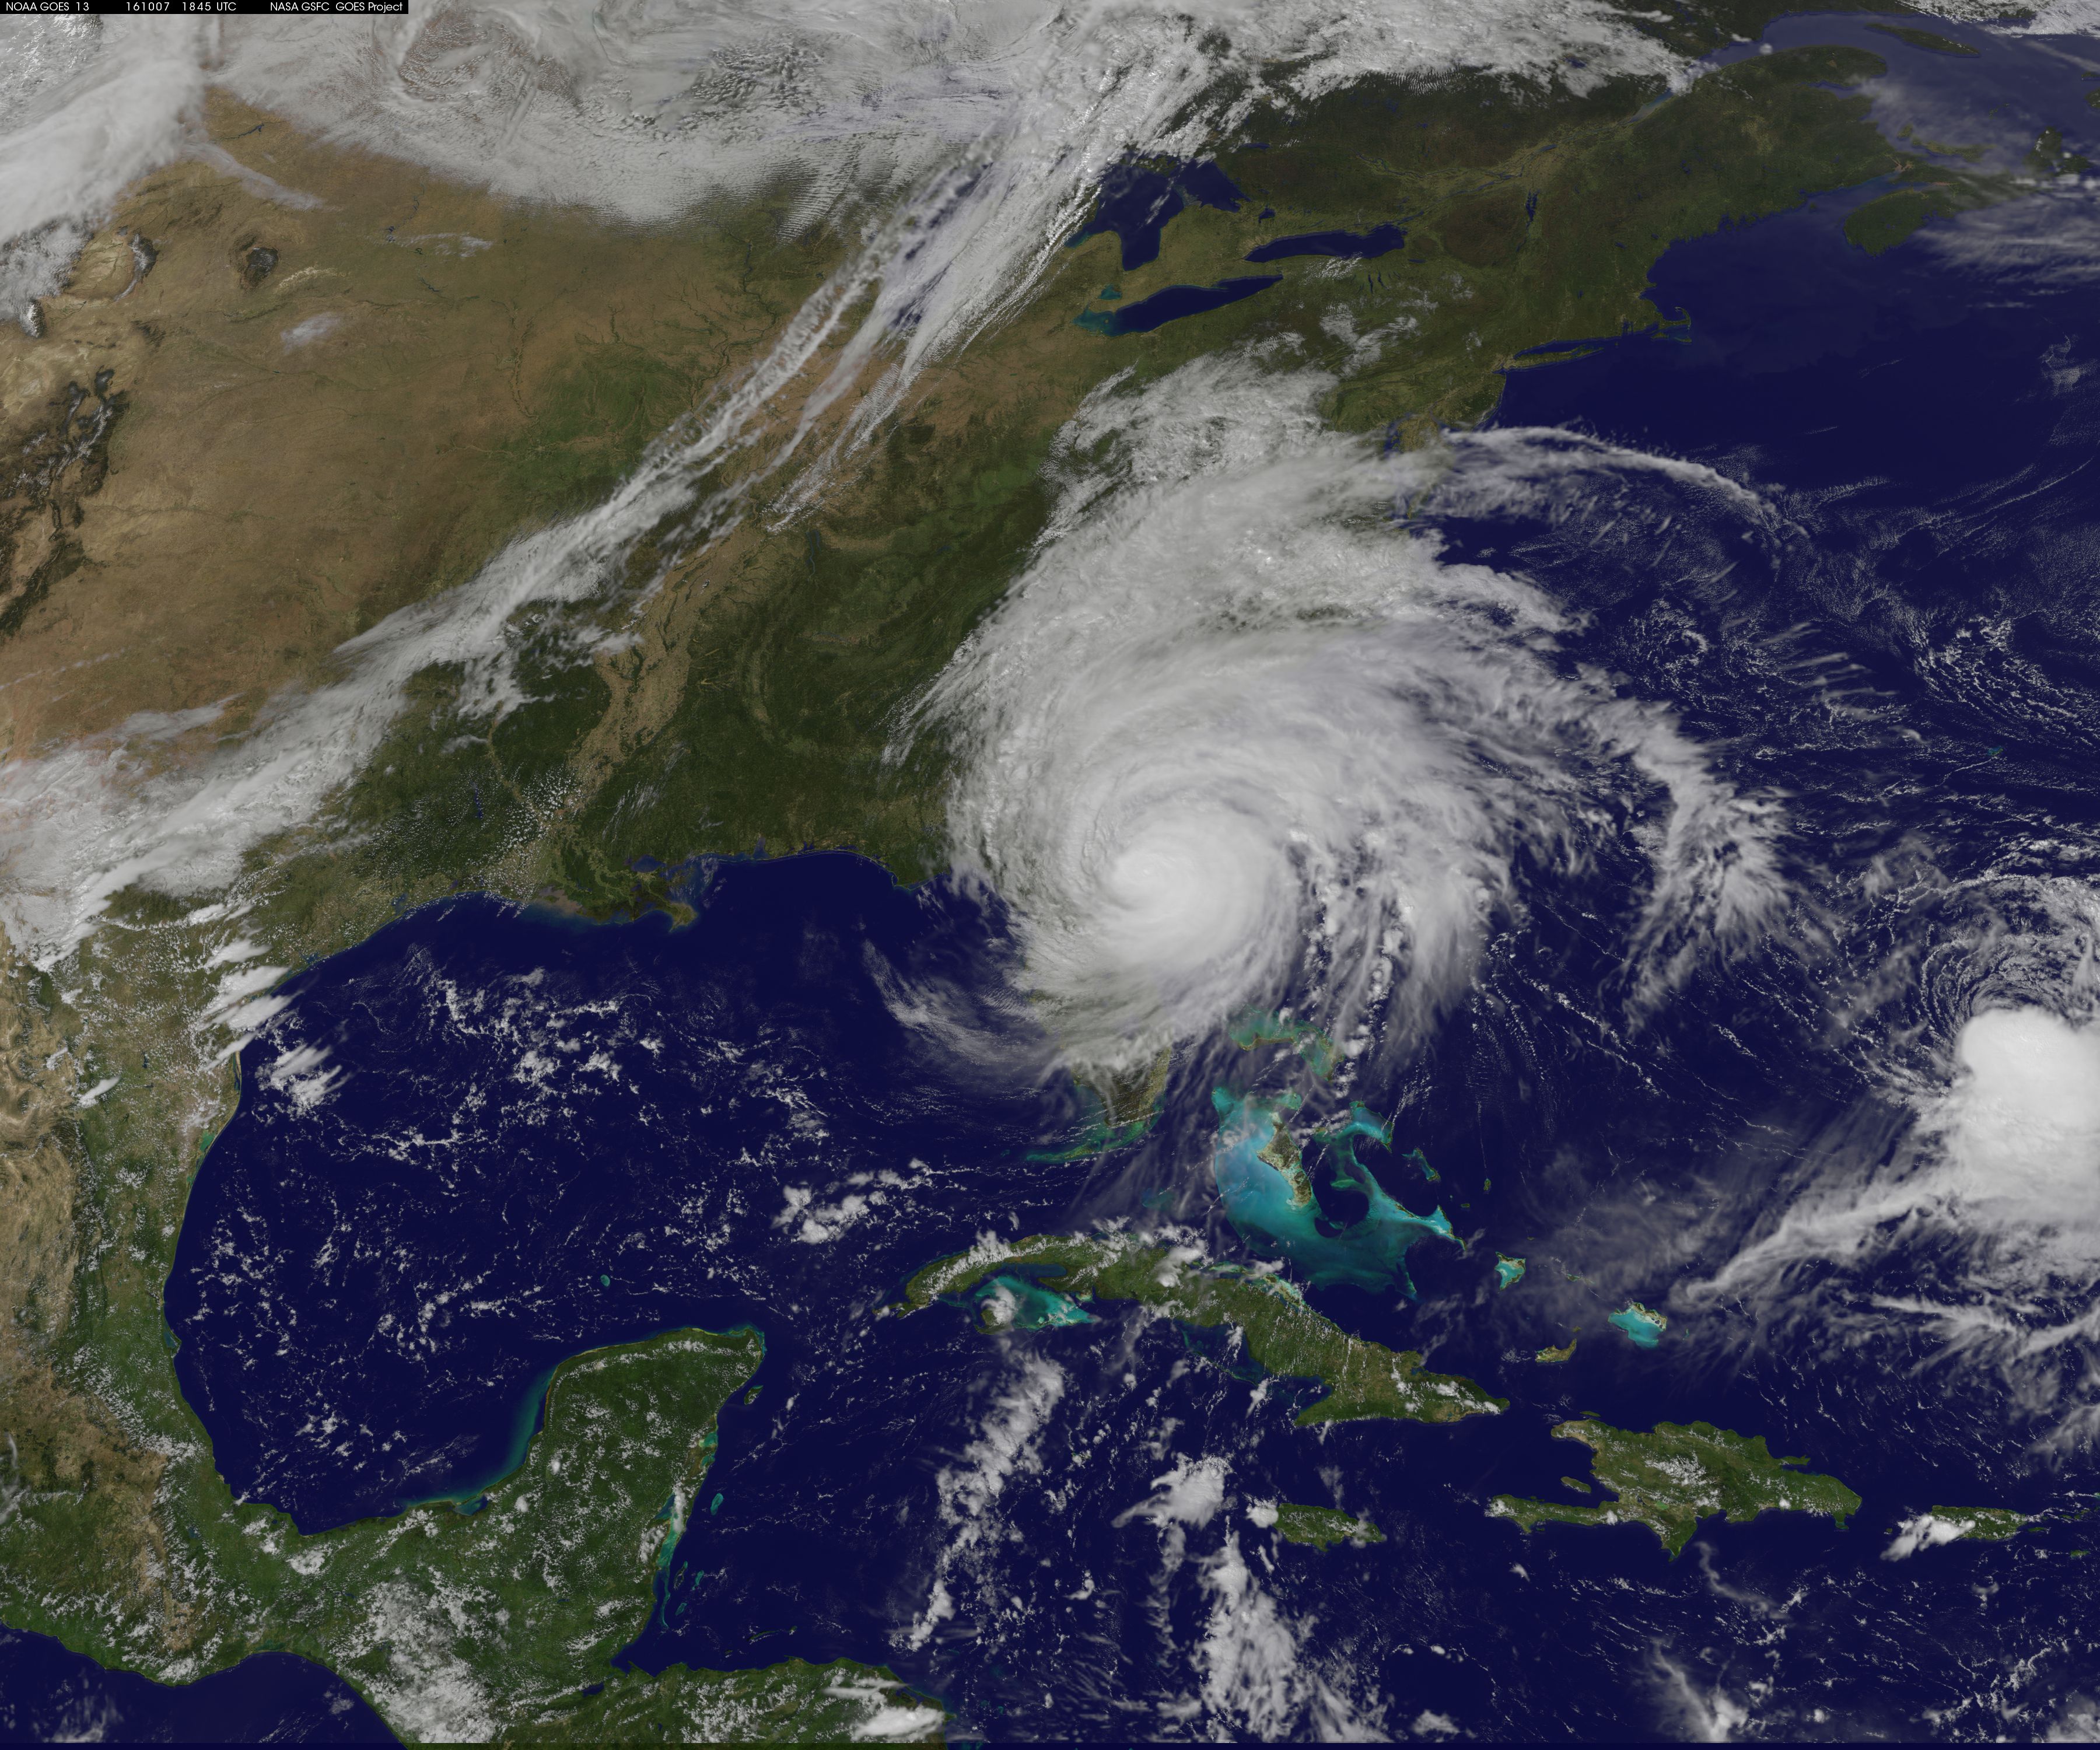
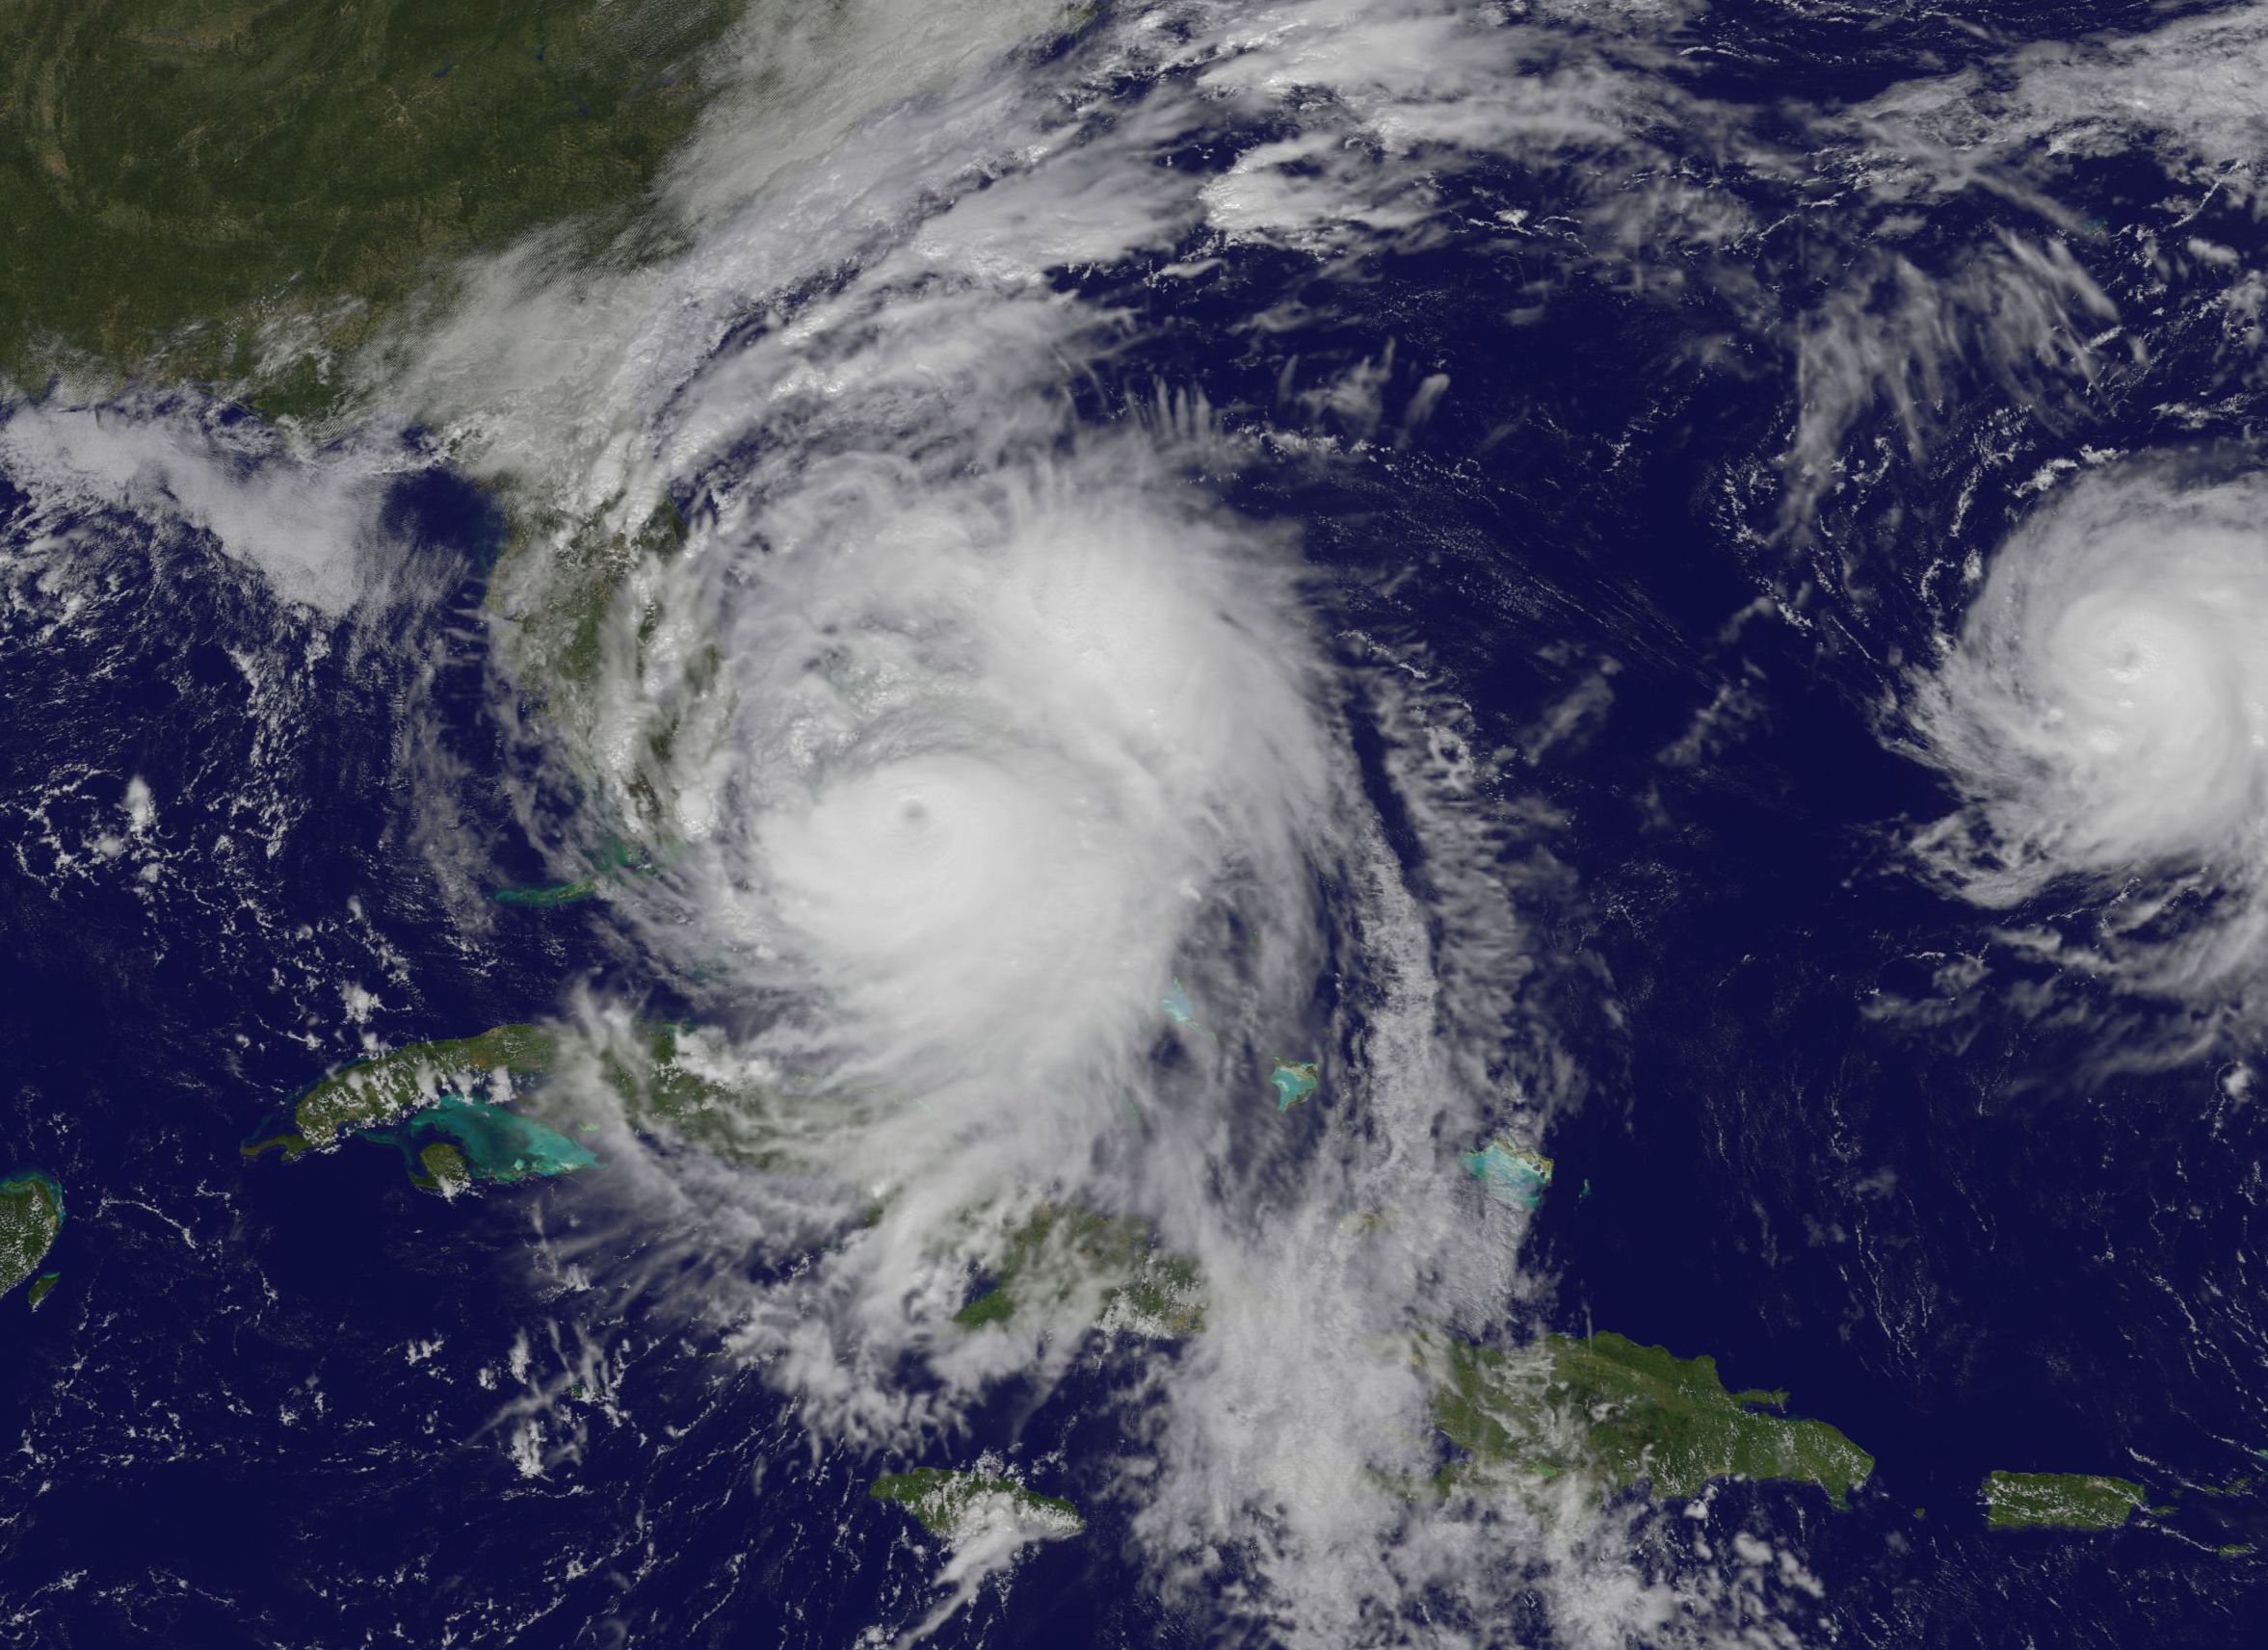
Hurricane Matthew’s center was near the coast of South Carolina during the morning of Oct. 8, 2016, when NOAA’s GOES-East satellite captured a visible image of the storm. Imagery showed that clouds associated with Matthew stretched all the way up the U.S. East Coast beyond New England.
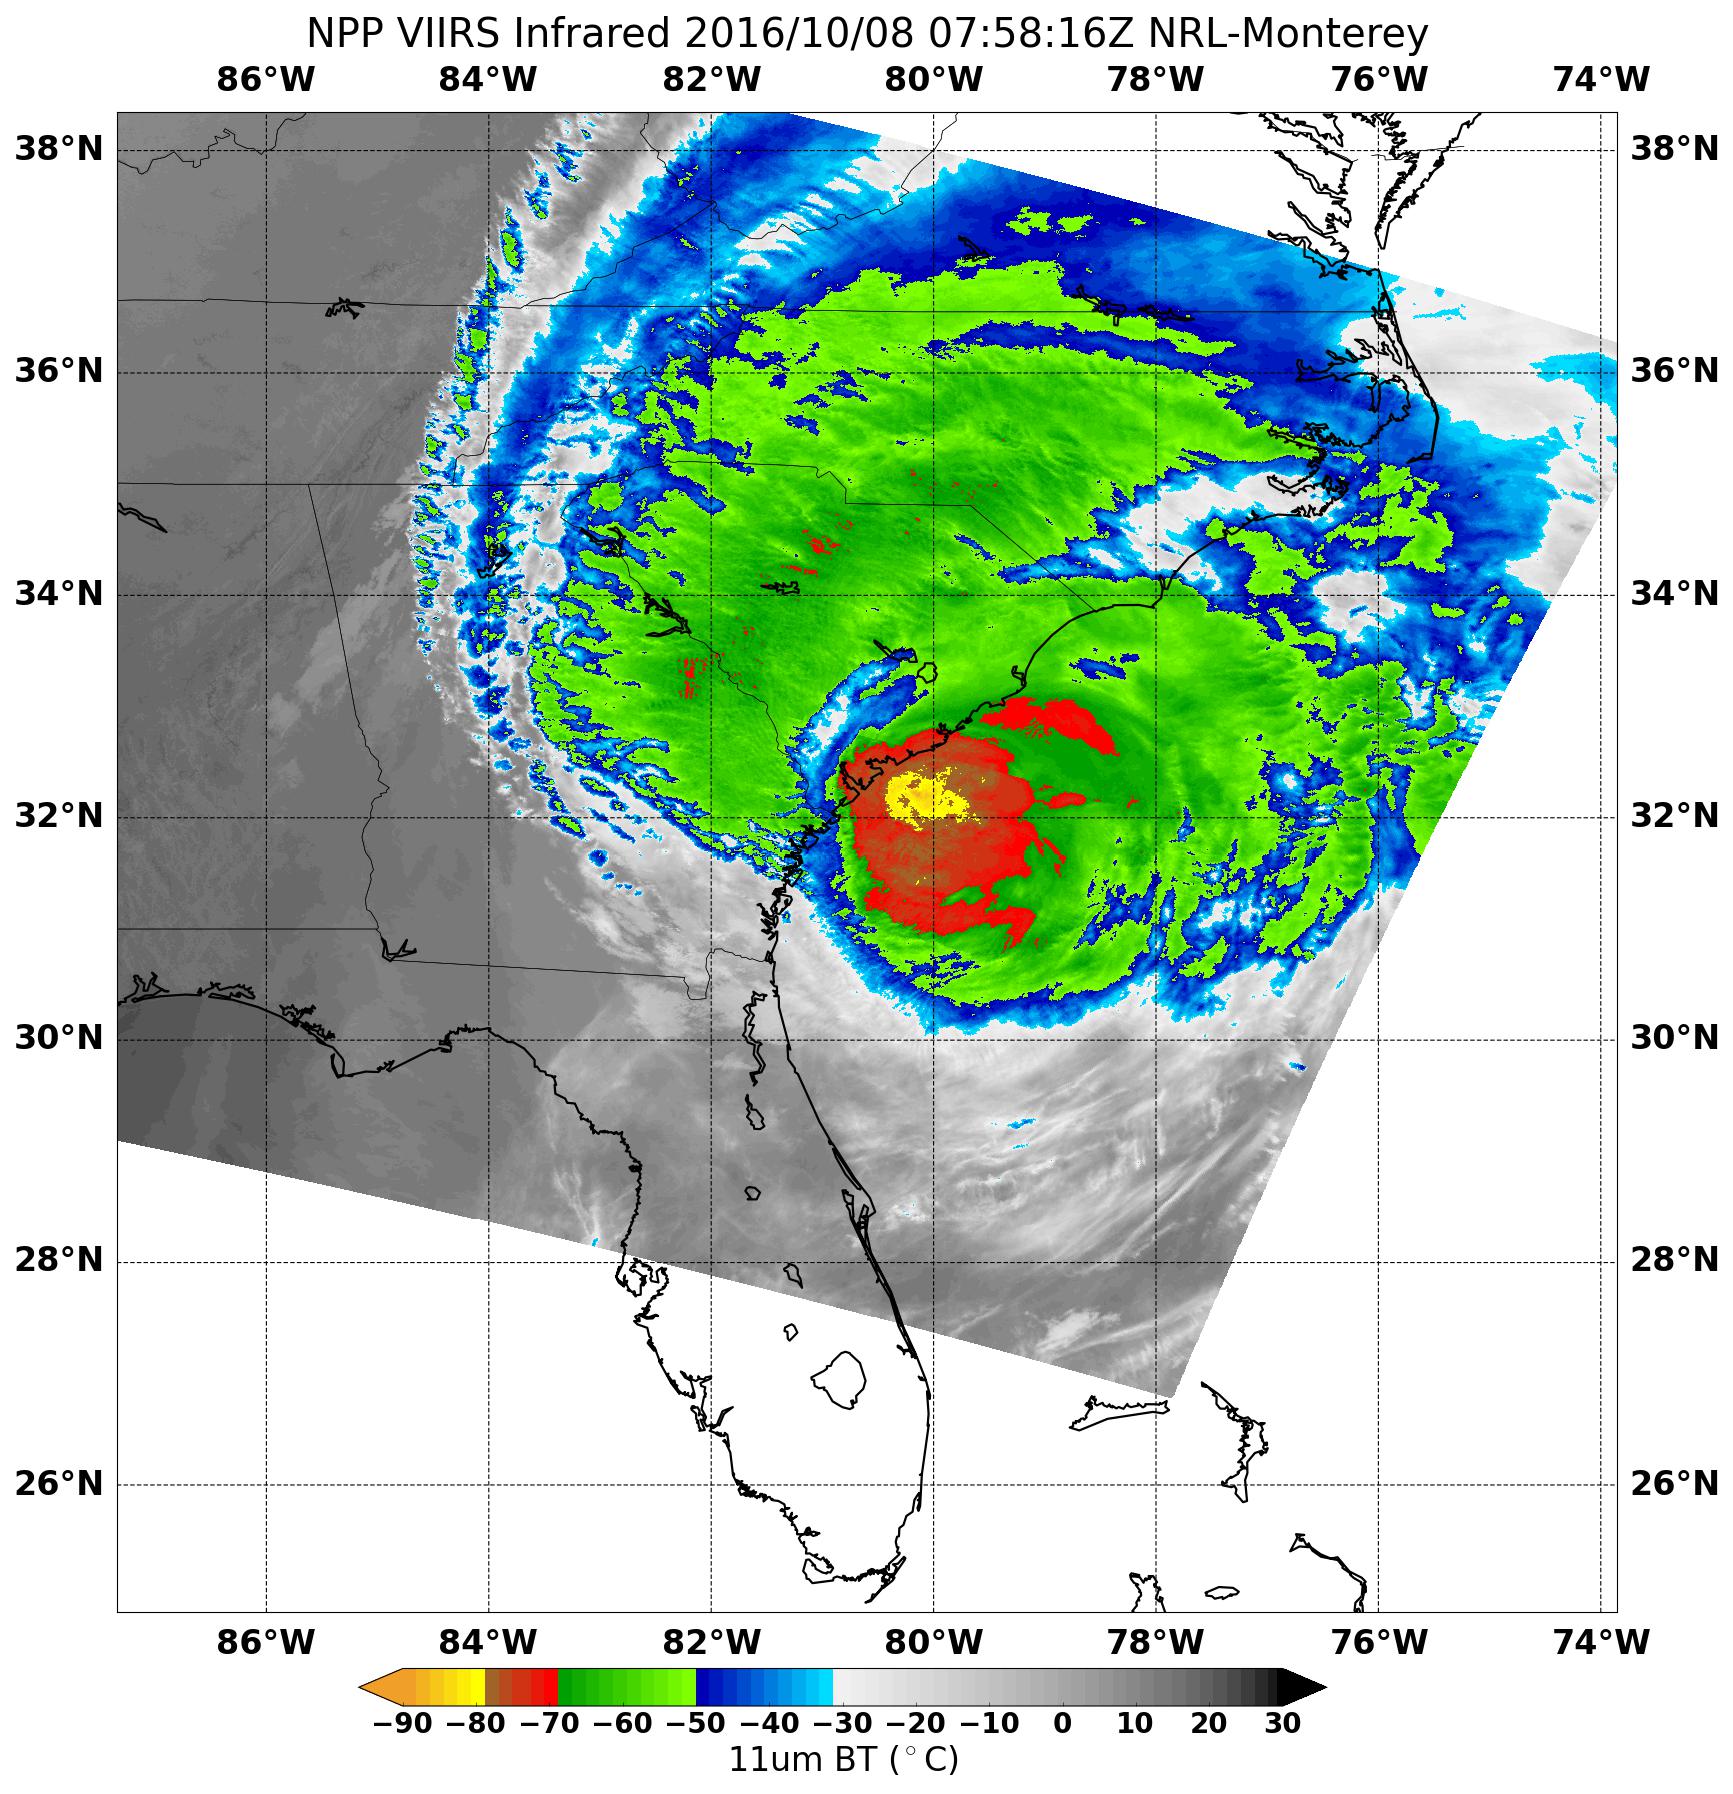
On Oct. 8 at 3:58 a.m. EDT (758 UTC) NASA-NOAA’s Suomi NPP satellite passed over Hurricane Matthew and measured cloud-top temperatures. The Visible Infrared Imaging Radiometer Suite (VIIRS) instrument aboard NASA-NOAA’s Suomi NPP satellite captured an infrared image of the storm that revealed the location of coldest cloud top temperatures and strongest storms.
VIIRS data showed cloud top temperatures of powerful storms as cold as minus 80 F (minus 62.2 C) were found around the center of circulation. Temperatures that cold indicate strong uplift in the storm and cloud tops high into the troposphere. NASA research has shown that storms with cloud tops that cold have the ability to generate heavy rain.
A visible image of Hurricane Matthew taken by NOAA’s GOES-East satellite on Oct. 7 at 7:45 a.m. EDT shows strong thunderstorms in a tight circulation around the center. Bands of thunderstorms surrounded the center, while clouds associated with Matthew stretched northward into eastern Canada. NOAA manages the GOES satellites and the NASA/NOAA GOES Project at NASA’s Goddard Space Flight Center in Greenbelt, Maryland, used the data to create the image.
At 8 a.m. EDT a Hurricane Warning was in effect for north of Altamaha Sound, Georgia, to Surf City, North Carolina. A Hurricane Watch was in effect from north of Surf City to Cape Lookout, North Carolina. A Tropical Storm Warning was in effect from north of Surf City to Duck, and for the Pamlico and Albemarle Sounds of North Carolina.
At that time the center of Hurricane Matthew was located by NOAA Doppler weather radars, and an Air Force Reserve Hurricane Hunter aircraft, just 20 miles (35 km) south-southeast of Charleston, South Carolina near 32.5 degrees north latitude and 79.8 degrees west longitude.
The National Hurricane Center said that Matthew is moving toward the northeast near 12 mph (19 kph), and this general motion is expected to continue today.
On the forecast track, the center of Matthew will continue to move near or over the coast of South Carolina today, and be near the coast of southern North Carolina by tonight, Oct. 8. Although weakening is forecast during the next 48 hours, Matthew is expected to remain a hurricane while the center is near the coasts of South Carolina and North Carolina.
Hurricane-force winds extend outward up to 45 miles (75 km) from the center, and tropical-storm-force winds extend outward up to 185 miles (295 km). NHC received several wind observations early on Oct. 8. A private weather station at Folly Beach, South Carolina, reported a wind gust of 76 mph (122 kph). At 8 a.m. EDT, NHC said strong wind gusts are also occurring well inland in South Carolina. Orangeburg, South Carolina, recently reported a wind gust of 55 mph (89 kph).
The minimum central pressure recently reported by an Air Force reconnaissance aircraft was 962 millibars.
For forecast updates and local effects from Matthew, visit the National Hurricane Center page: www.nhc.noaa.gov.
Rob Gutro
NASA’s Goddard Space Flight Center, Greenbelt, Md.
Update #6 – NASA JPL Satellites Dissect Powerful Hurricane Matthew
Hurricane forecasters use many different types of data to forecast a storm’s intensity and track. NASA satellites and airborne instruments, including several developed and operated by NASA’s Jet Propulsion Laboratory, Pasadena, California, contribute to scientists’ understanding of tropical cyclones and help improve forecasts.
Here are some of the latest data on Hurricane Matthew from JPL-developed satellites and instruments:
High-Altitude Monolithic Microwave Integrated Circuit Sounding Radiometer (HAMSR)
Taking Matthew’s Temperature
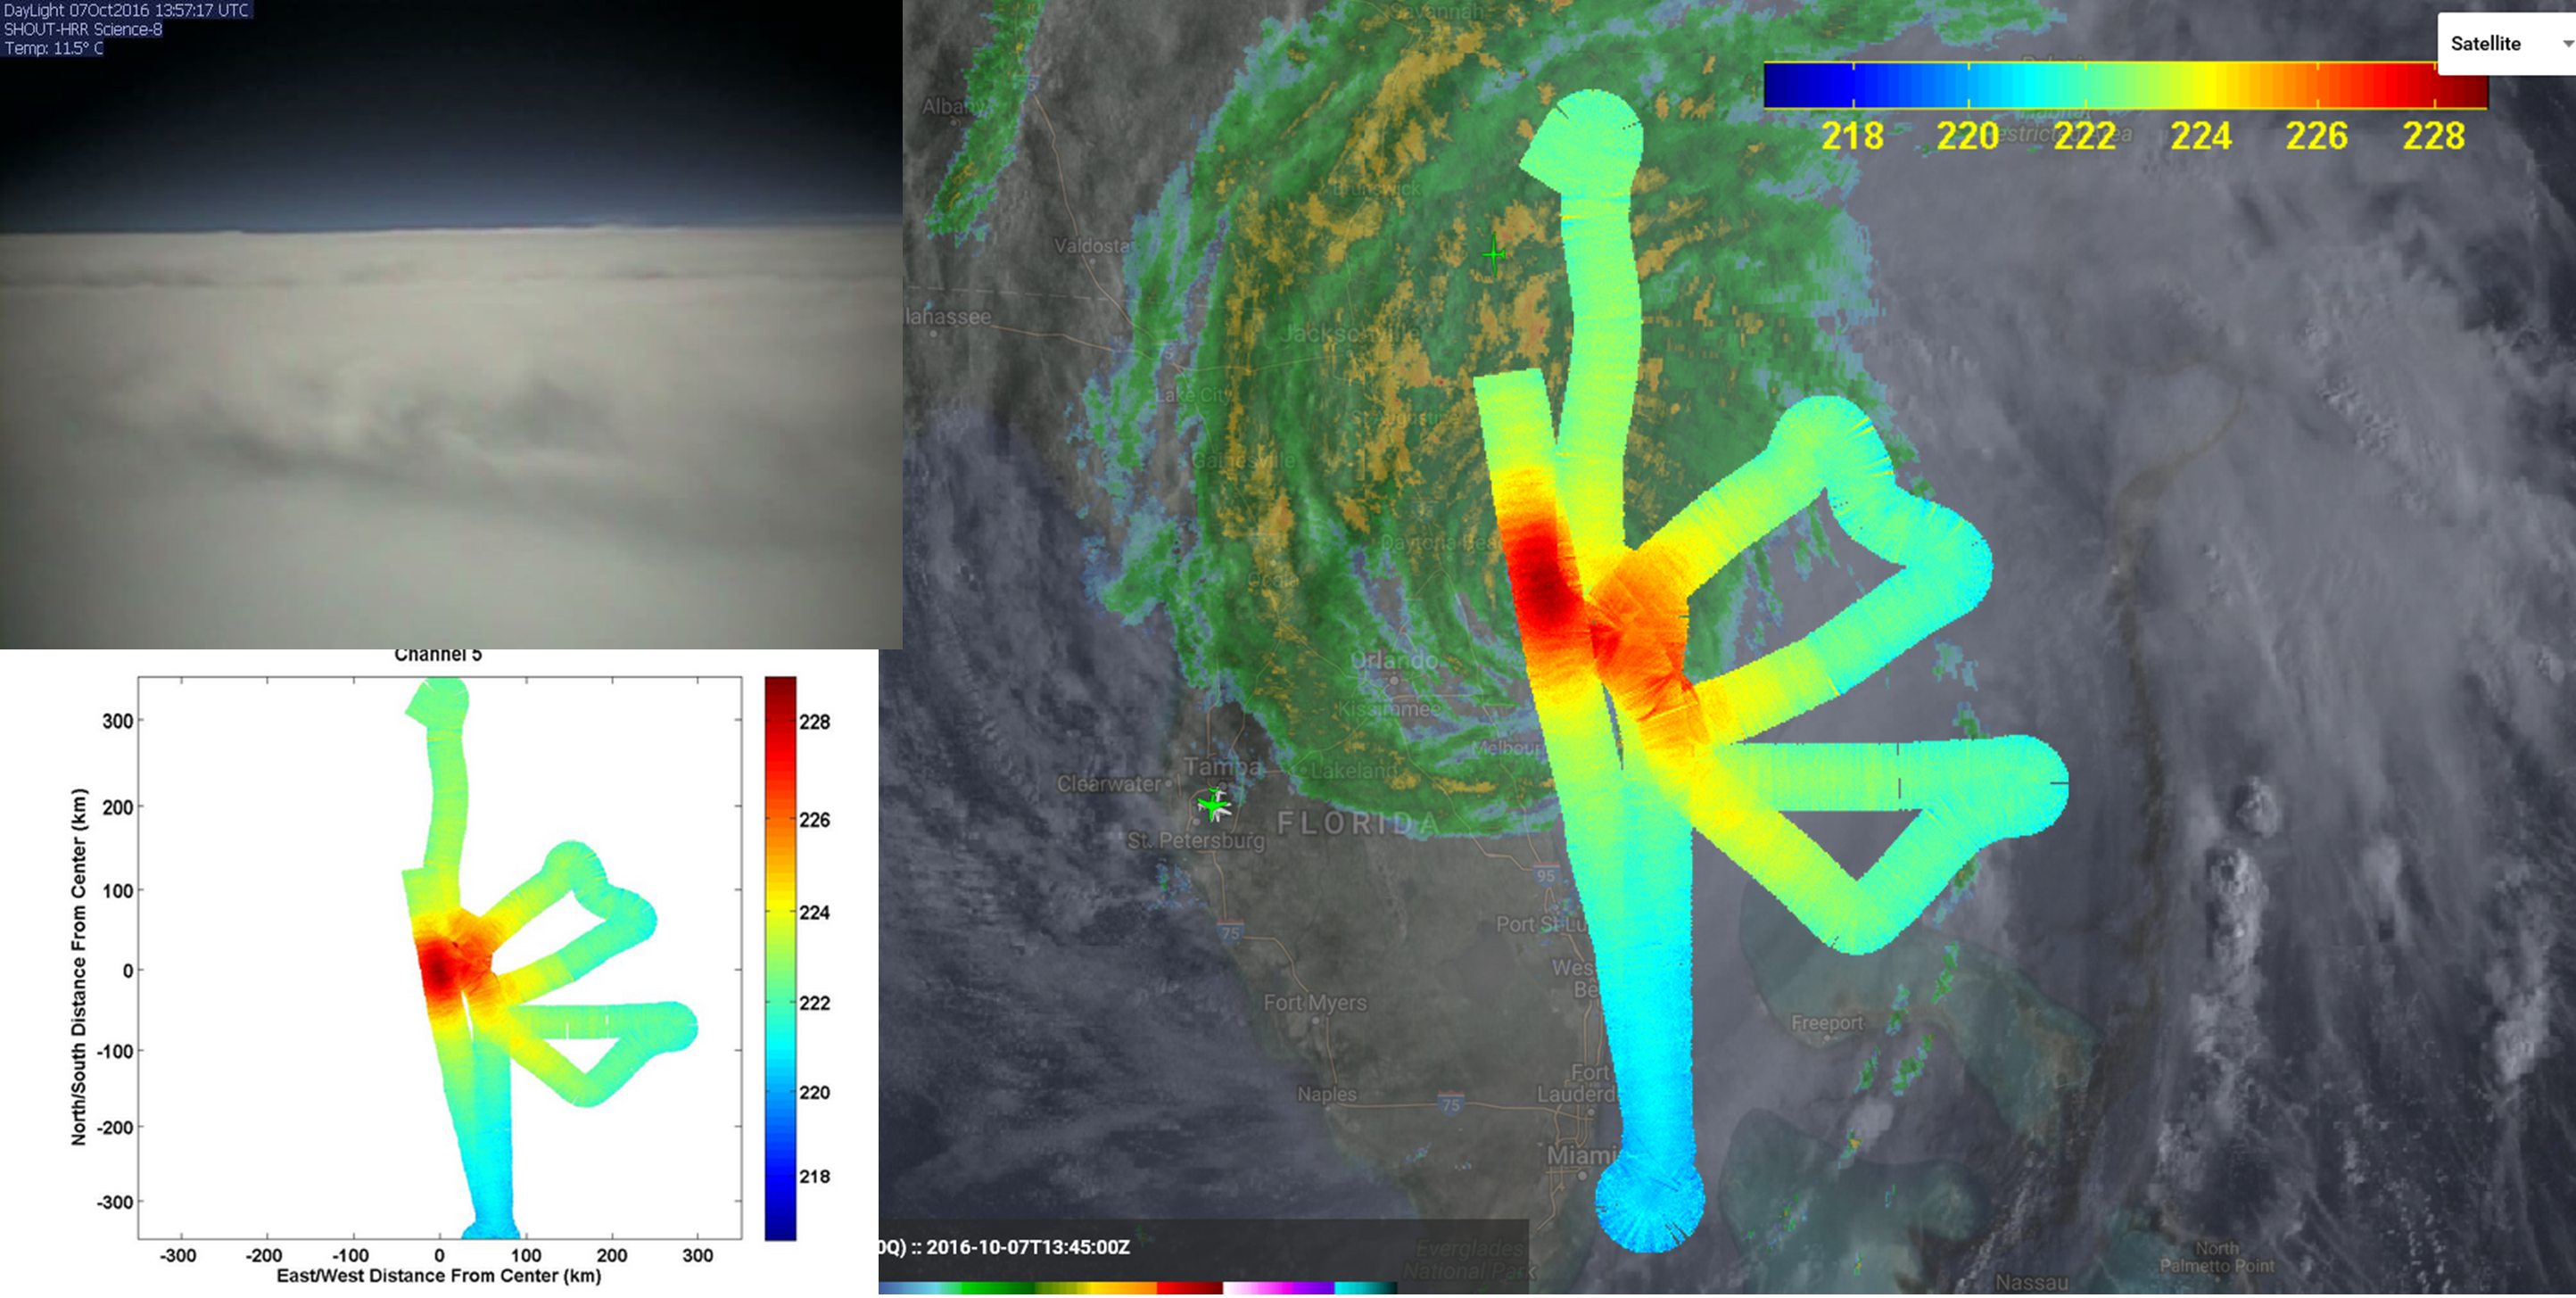
A hurricane is like an engine: the more it revs up, the warmer it gets. A JPL-developed microwave sounder called the High-Altitude Monolithic Microwave Integrated Circuit Sounding Radiometer (HAMSR) can measure a hurricane’s atmospheric temperature and humidity, even in the presence of clouds, and can also be used to measure rain and ice from Earth’s surface to the top of the storm’s convective clouds.
HAMSR has been flying repeatedly over Hurricane Matthew aboard a NASA Global Hawk unmanned aircraft as part of the National Oceanic and Atmospheric Administration’s Sensing Hazards with Operational Unmanned Technology (SHOUT) field campaign.
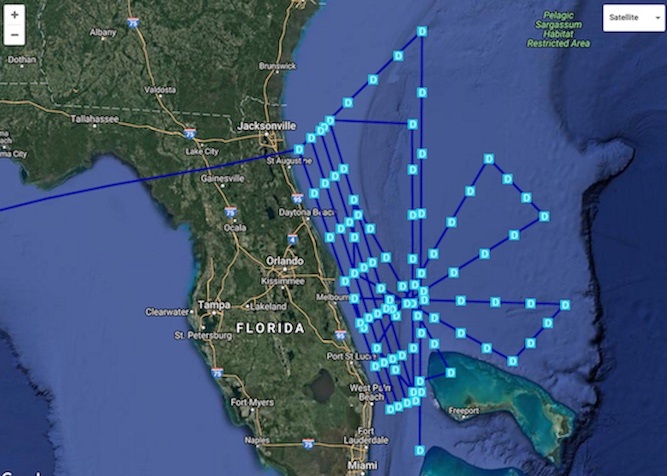
The image montage shows observations from HAMSR as it crisscrossed above Matthew at an altitude of about 55,000 feet (16,764 meters) in the early morning hours of Oct. 7, as the storm was approaching Florida’s east coast. The “swaths” are about 30 miles (48 kilometers) wide. The large image at right shows the temperature of the upper atmosphere above Matthew’s core. The temperature is proportional to the storm’s intensity — the higher the temperature over the core relative to the environment, the more intense the storm. The HAMSR data are overlaid atop a ground-based radar image and satellite visible image. Red colors (warm) depict areas without clouds, while blue colors (very cold) represent scattering due to ice in the atmosphere and heavy precipitation. The image in the lower left shows the HAMSR data alone. The image in the upper left was taken by a camera aboard the Global Hawk.
As the Global Hawk prepared to return home to NASA’s Armstrong Flight Research Center in Edwards, California, it captured one last look inside Matthew’s spiral cloud bands. The red colors show cloud bands without precipitation, while blue colors show rain bands. The Global Hawk’s location is just past the eye (the red circle in the center of the image).
The HAMSR data were transmitted in real time via a communications satellite to the ground, where they were immediately processed and shared with the SHOUT scientists, who use them for situational awareness. They were also posted on a public web server. Images and data were also shared with forecasters at the NOAA/National Weather Service’s National Hurricane Center.
HAMSR was developed at JPL as part of NASA’s technology development program. For more on HAMSR, visit:
http://microwavescience.jpl.nasa.gov/instruments/hamsr/
CloudSat
Taking a 3D Slice of the Storm
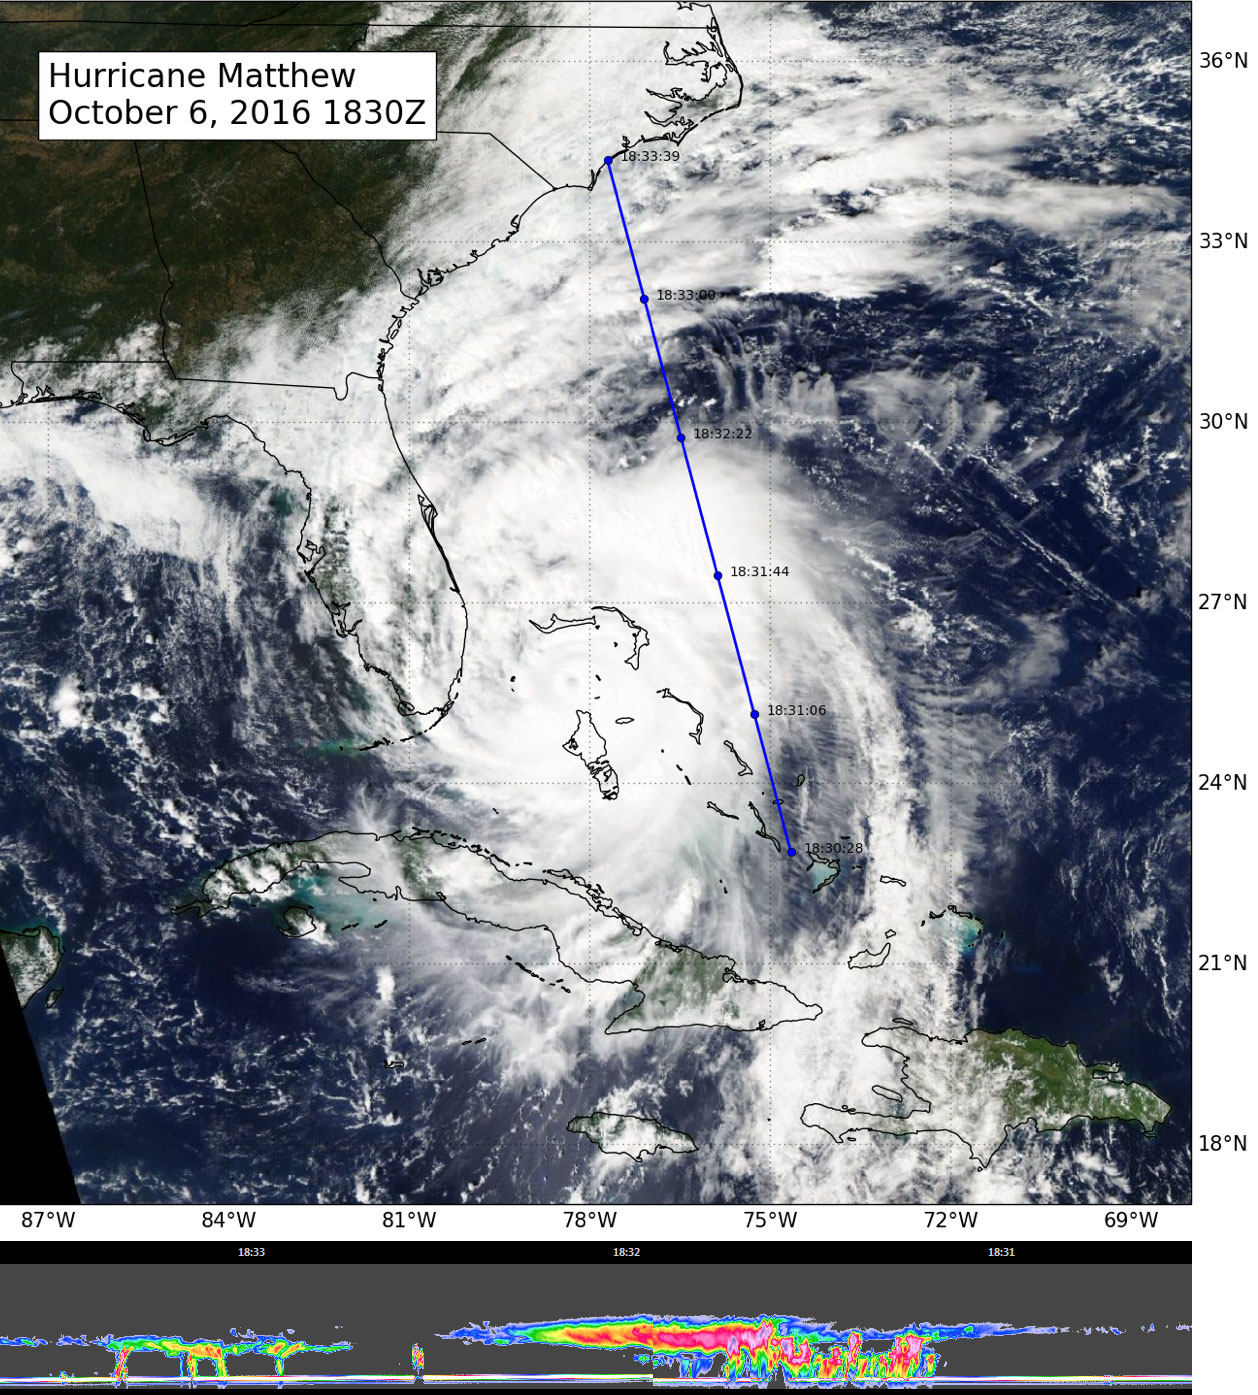
NASA’s CloudSat satellite flew to the east of the center of Hurricane Matthew on Oct. 6 at 11:30 a.m. PDT (2:30 p.m. EDT and 18:30 UTC), intersecting portions of Matthew’s outer rain bands. Although the overpass did not directly intersect the storm center, CloudSat data reveal Matthew’s anvil clouds (thick cirrus cloud cover), with cumulus and cumulonimbus clouds visible beneath the cirrus. Red and pink colors in the CloudSat overpass indicate areas of higher reflectivity (larger water and/or ice droplets) throughout the clouds.
For more on CloudSat, visit:
http://cloudsat.atmos.colostate.edu/home
Soil Moisture Active Passive (SMAP)
A New Measure of Matthew’s Winds
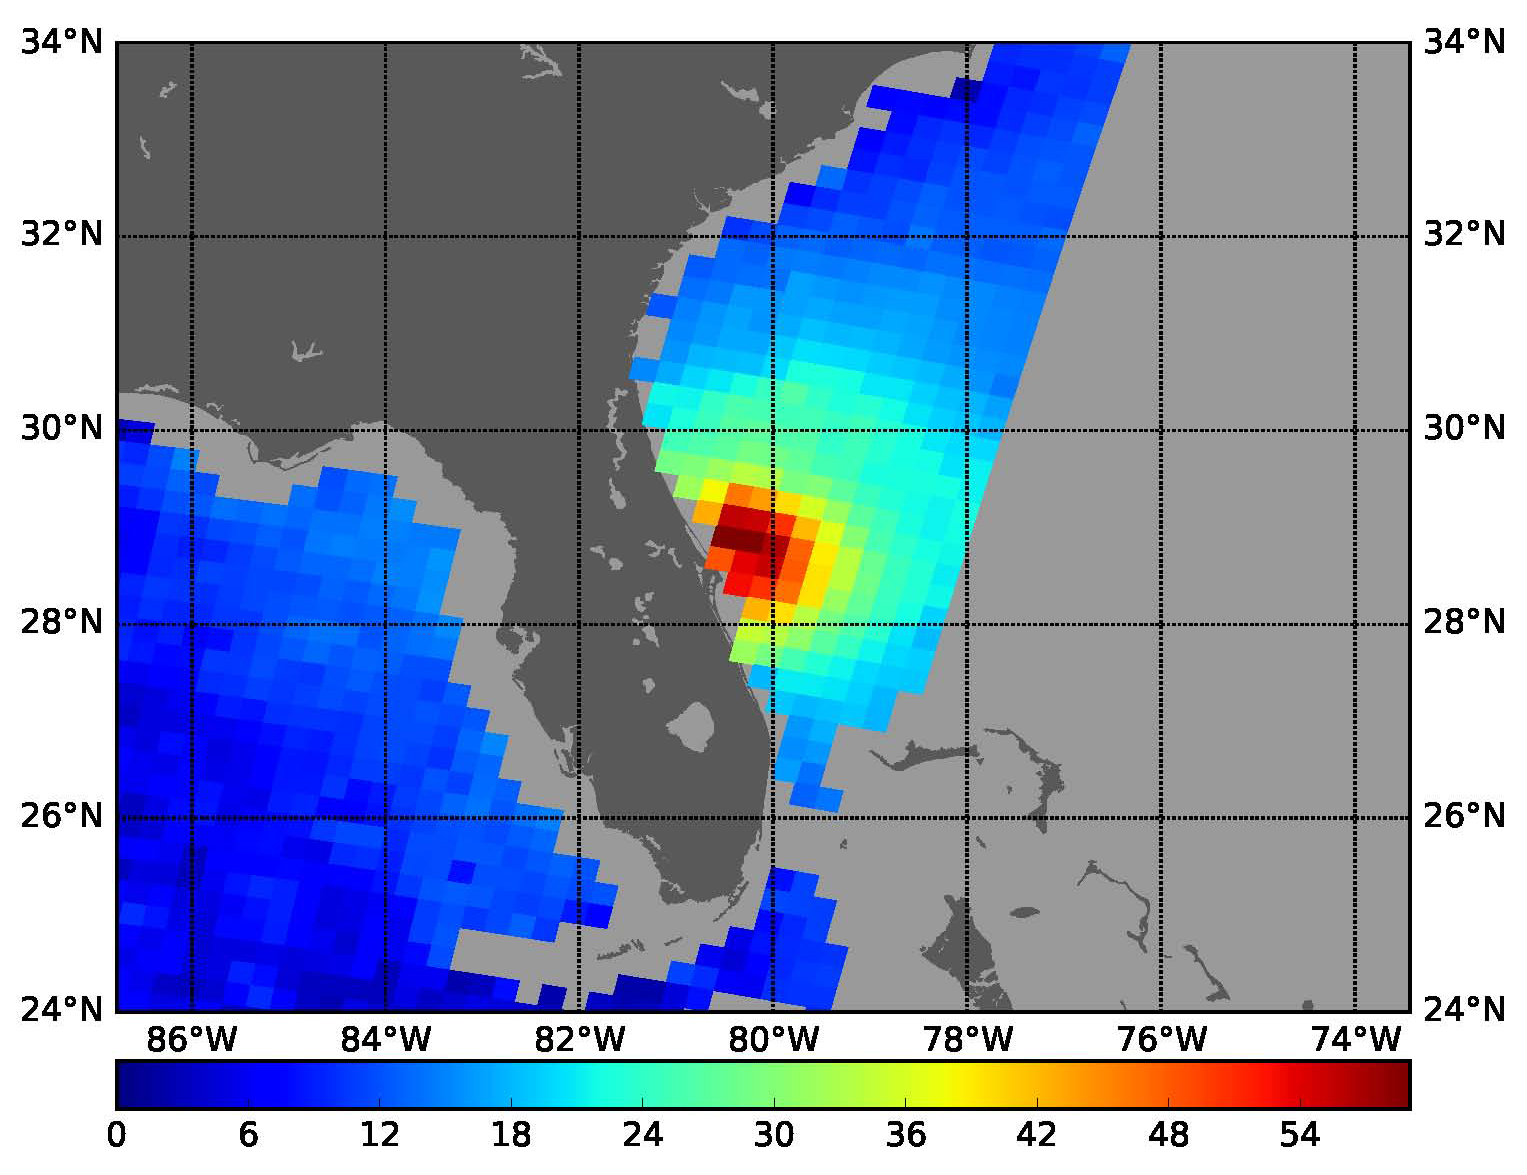
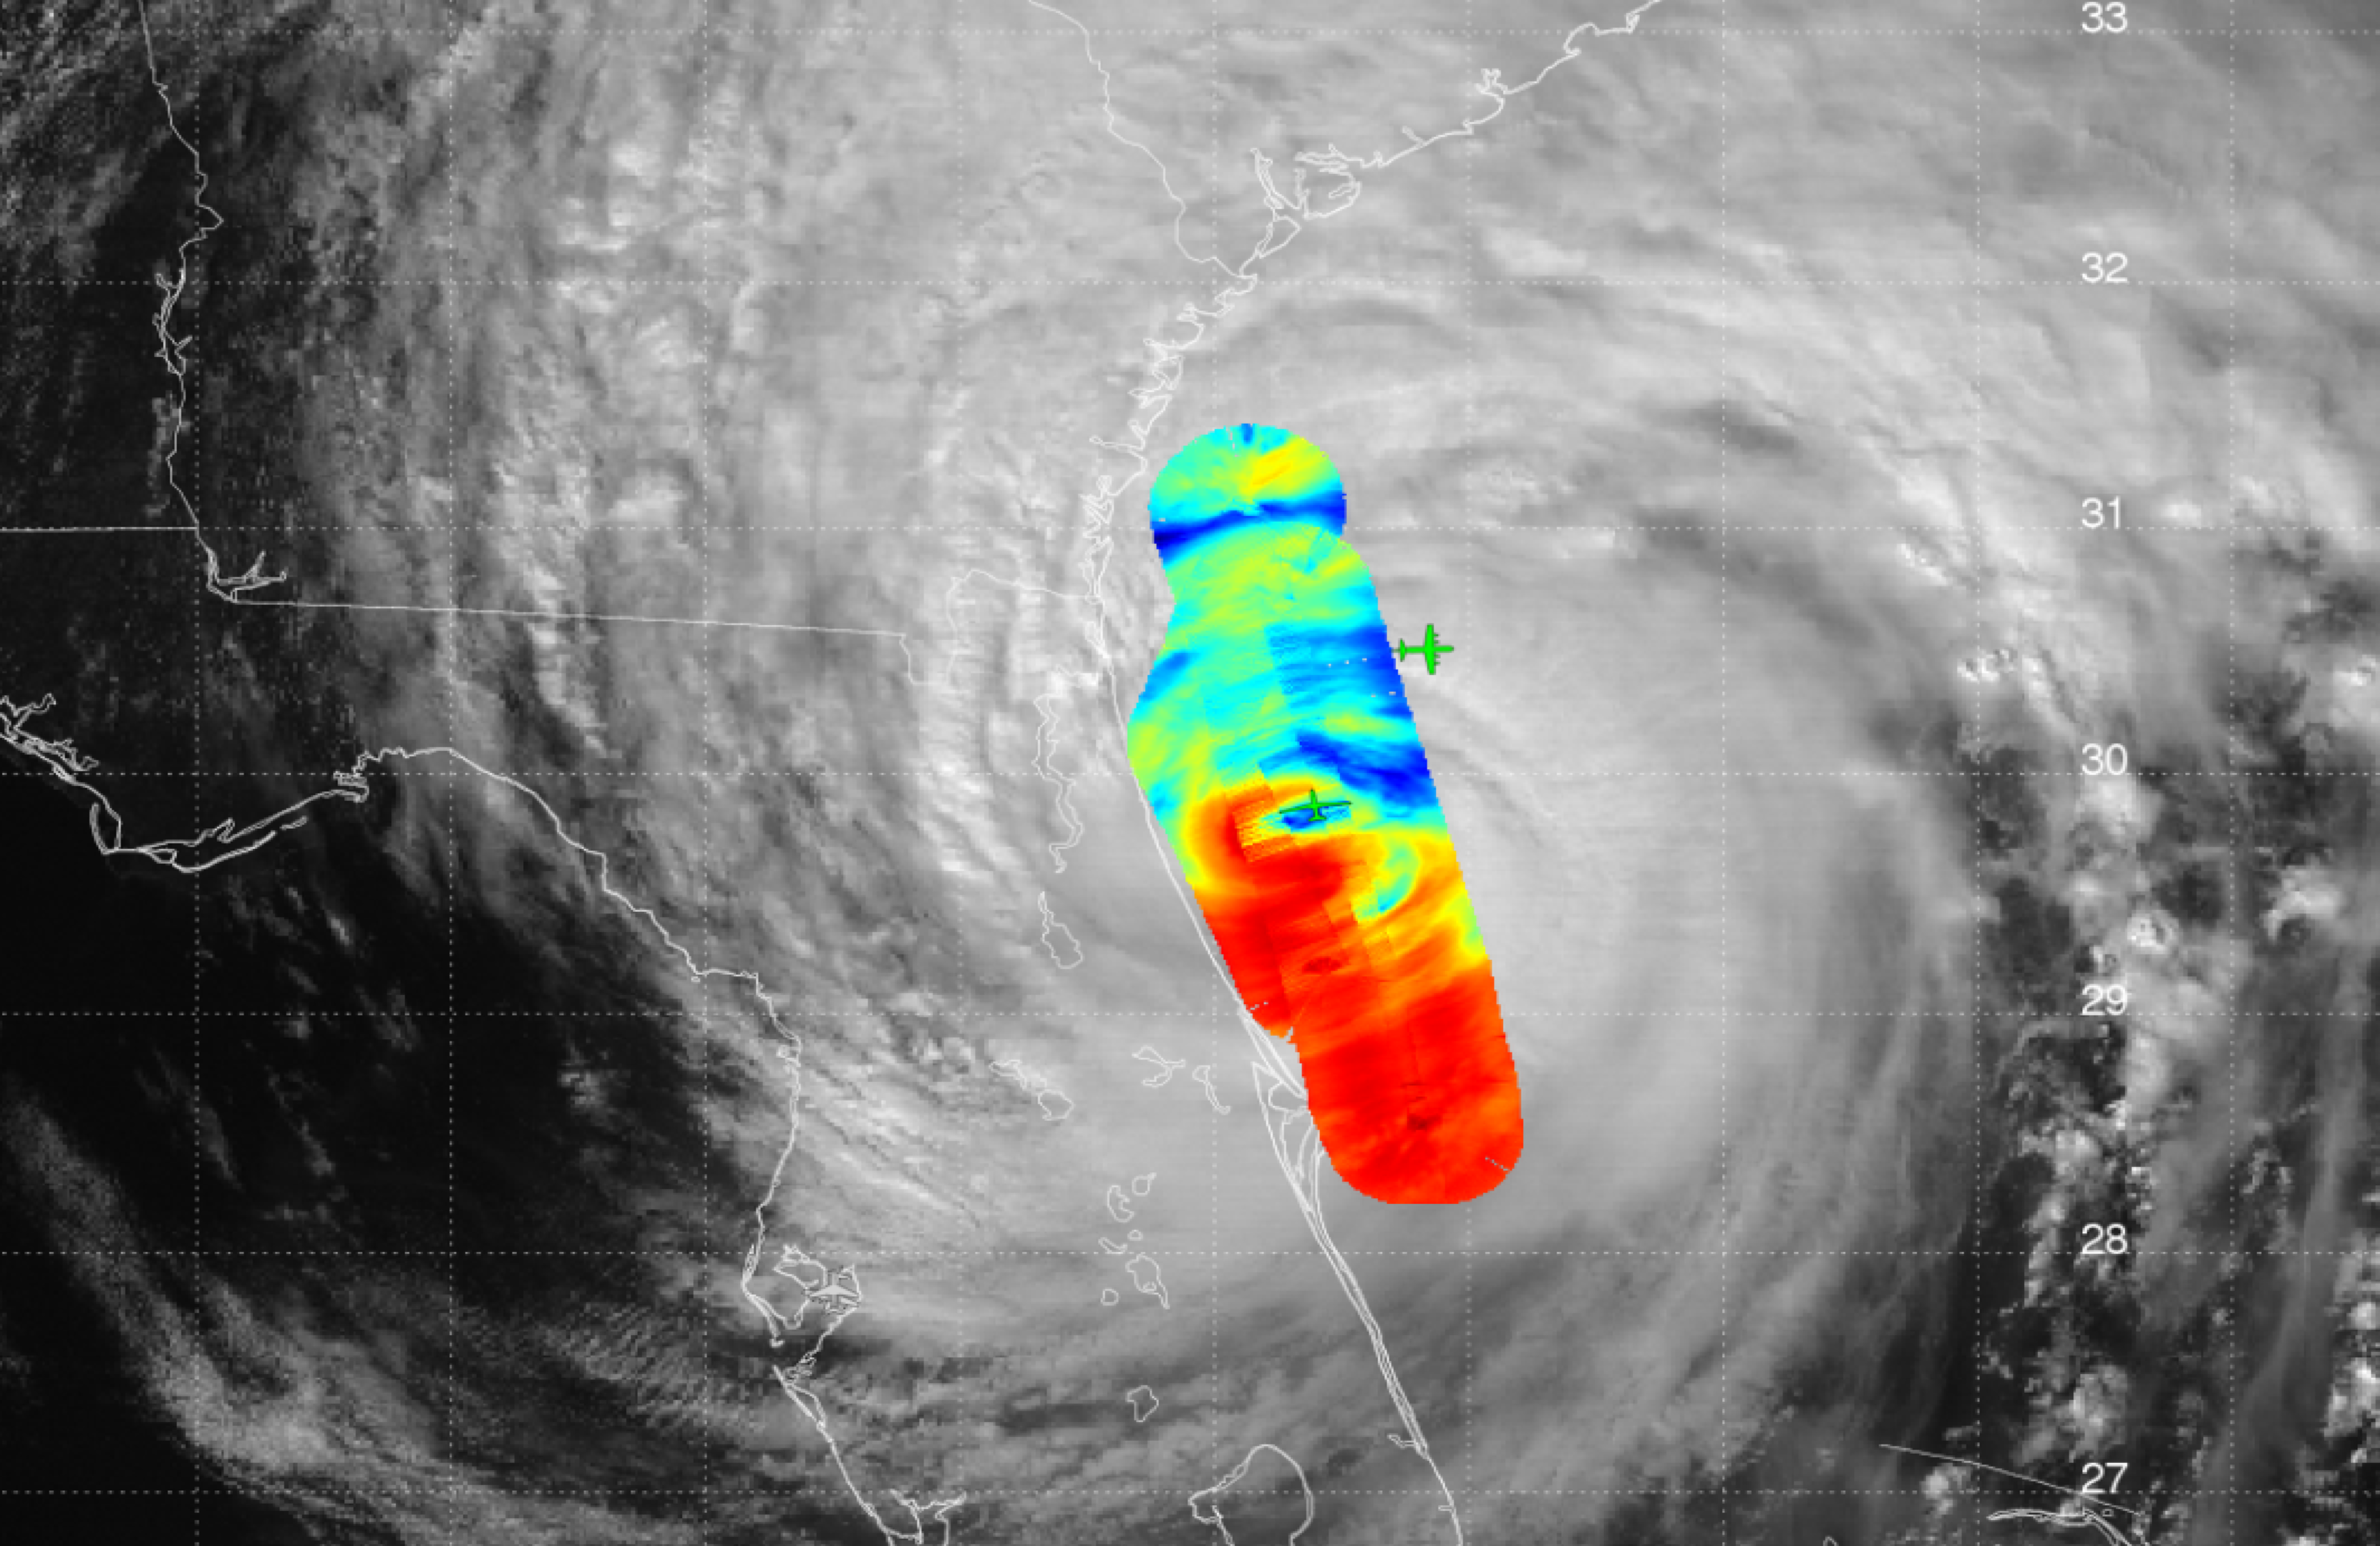
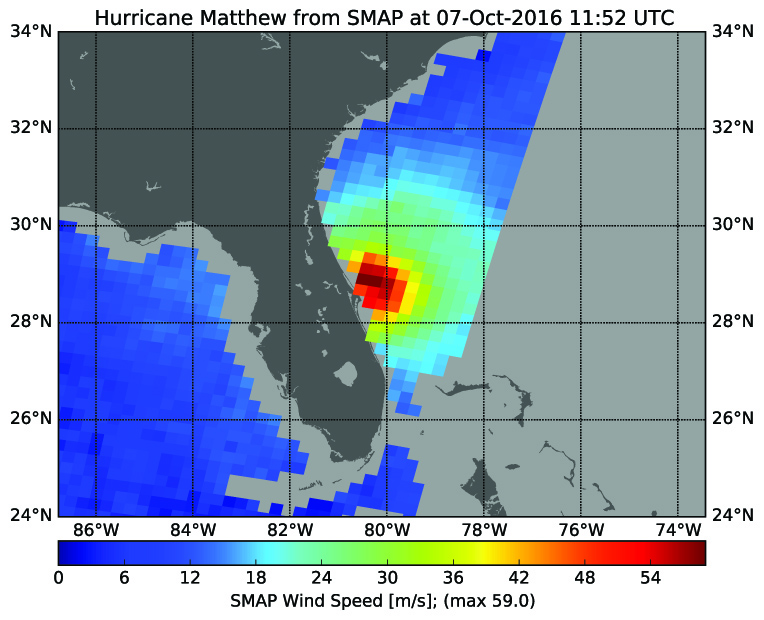
The radiometer instrument on NASA’s Soil Moisture Active Passive (SMAP) satellite can measure a hurricane’s wind speeds. SMAP observations of Hurricane Matthew, taken at 4:52 a.m. PDT (7:52 a.m. EDT and 11:52 UTC) on Oct 7, found wind speeds up to 132 mph (59 meters per second). SMAP has excellent sensitivity to extreme winds, far beyond that of typical scatterometer instruments now in orbit. This is because SMAP’s L-band is not affected by rain and can provide accurate wind speeds regardless of rain conditions.
For more information on SMAP, visit:
Atmospheric Infrared Sounder (AIRS)
A 3D Map of Matthew’s Atmospheric Temperature, Water Vapor and Clouds
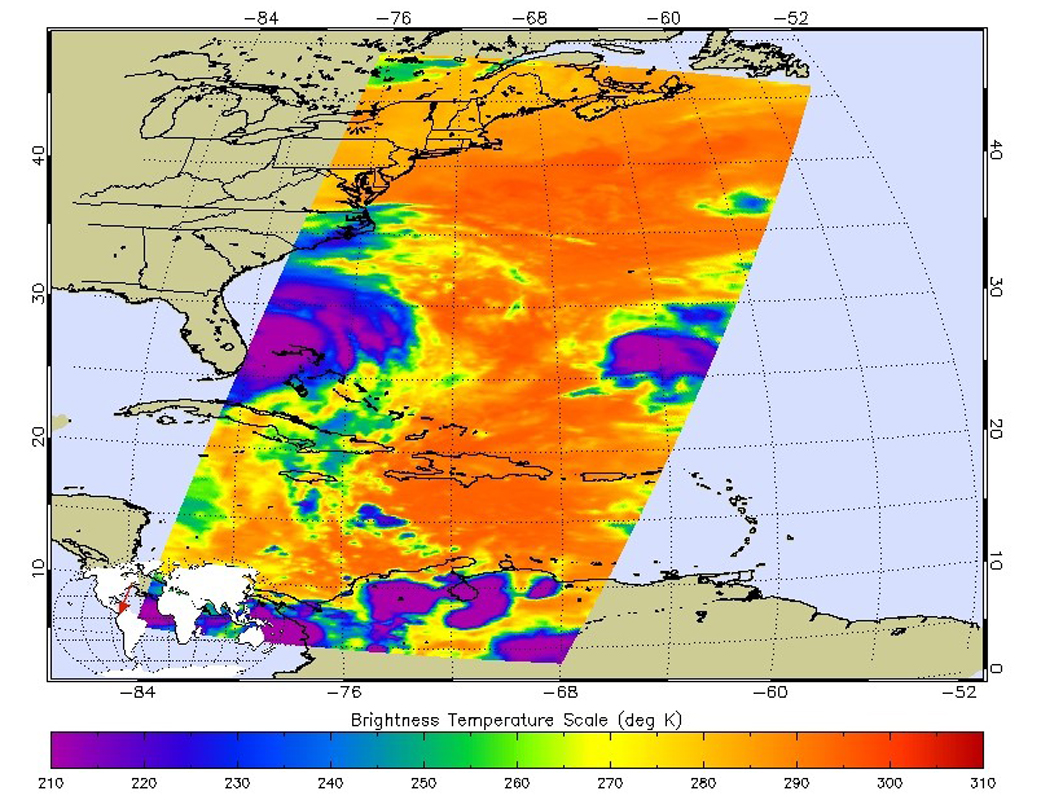
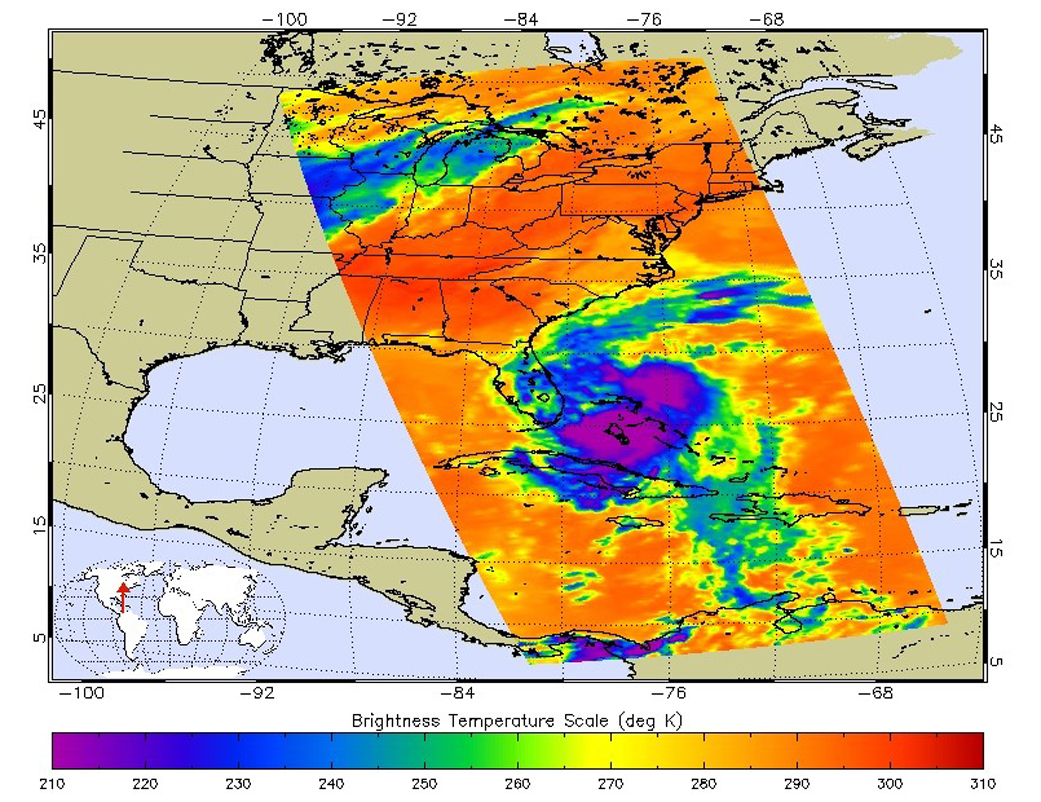
At 11:29 p.m. PDT on Oct. 6 (2:29 a.m. EDT and 6:29 UTC on Oct. 7), NASA’s Atmospheric Infrared Sounder (AIRS) instrument aboard NASA’s Aqua satellite produced this false-color infrared image of Matthew as the storm moved up the coast of central Florida. Hurricane Nicole is visible to the right in the Atlantic.
The AIRS data create an accurate 3-D map of atmospheric temperature, water vapor and clouds, data that are useful to forecasters. The image shows the temperature of Matthew’s cloud tops or the surface of Earth in cloud-free regions. The coldest cloud-top temperatures appear in purple, indicating towering cold clouds and heavy precipitation. The infrared signal of AIRS does not penetrate through clouds. Where there are no clouds, AIRS reads the infrared signal from the surface of the ocean waters, revealing warmer temperatures in orange and red.
For more information on AIRS, visit:
Alan Buis
NASA’s Jet Propulsion Laboratory
Update #5 -NASA Looks at Major Hurricane Matthew’s Winds, Clouds
As Hurricane Matthew continues to crawl along the southeastern U.S. coast NASA observed the storm’s winds, clouds, precipitation and more. Matthew remained a major hurricane on Friday, Oct. 7 at 2 p.m. EDT.
On Oct. 6, NASA’s CloudSat passed over the eastern quadrant of Hurricane Matthew at 2:30 p.m. EDT. CloudSat revealed the anvil (thick cirrus cloud cover) with cumulus and cumulonimbus clouds beneath the cirrus. CloudSat found areas of higher reflectivity that included larger water and/or ice droplets throughout the clouds.
The next day, NASA’s Soil Moisture Active Passive (SMAP) satellite observatory captured data on Matthew’s winds. SMAP observations of hurricane Matthew showed winds up to 132 mph (59 meters per second/212 kph) at 7:52 a.m. EDT (11:52 UTC) on Oct. 7. “SMAP has excellent sensitivity to extreme winds, far beyond that from typical scatterometers,” said Alexander Fore, of NASA’s Jet Propulsion Laboratory in Pasadena, California. “SMAP is sensitive to these extreme winds due to the use of the L-band passive brightness temperature observation, which has the additional benefit of not being attenuated by rain giving accurate wind speeds regardless of rain conditions.”
SMAP will map global soil moisture and detect whether soils are frozen or thawed. The mission will help scientists understand the links between Earth’s water, energy and carbon cycles; help reduce uncertainties in predicting weather and climate; and enhance our ability to monitor and predict natural hazards such as floods and droughts.
At 2:30 p.m. EDT a visible image from NOAA’s GOES-East satellite showed Matthew’s clouds engulfing almost all of Florida, Georgia and the Carolinas. The image was created by the NASA/NOAA GOES Project at NASA’s Goddard Space Flight Center, Greenbelt, Maryland.
At that time a Hurricane Warning was in effect for Cocoa Beach to Surf City. A Hurricane Watch is in effect from north of Surf City to Cape Lookout, North Carolina. A Tropical Storm Warning was in effect from Florida’s Sebastian Inlet to Cocoa Beach, and north of Surf City to Duck, North Carolina, and the Pamlico and Albemarle Sounds, North Carolina.
At 2 p.m. EDT (1800 UTC) on Oct. 7, Matthew remained a Category 3 Hurricane on the Saffir-Simpson Hurricane Wind Scale. The eye of Hurricane Matthew was located near latitude 29.7 North, longitude 80.7 West. That’s about 40 miles (60 km) east-southeast of St. Augustine, Florida.
NOAA’s National Hurricane Center (NHC) said Matthew is moving toward the north-northwest near 13 mph (20 km/h), and this general motion is expected to continue today. A turn toward the north is expected tonight or Saturday, Oct. 8. On the forecast track, the center of Matthew will continue to move near or over the coast of northeast Florida and Georgia through tonight, and near or over the coast of South Carolina on Saturday.
Maximum sustained winds are near 115 mph (185 kph) with higher gusts. Matthew is a category 3 hurricane on the Saffir-Simpson Hurricane Wind Scale. Although weakening is forecast during the next 48 hours, Matthew is expected to remain a hurricane until it begins to move away from the United States on Sunday.
Hurricane-force winds extend outward up to 60 miles (95 km) from the center and tropical-storm-force winds extend outward up to 185 miles (295 km). The latest minimum central pressure reported by an Air Force Hurricane Hunter plane was 947 millibars.
A wind gust to 84 mph (135 kph) was recently reported at Ponte Vedra, and a coastal marine observing station at St. Augustine recently measured a wind gust of 85 mph (137 kph). A tidal gauge at Fernandina Beach, Florida reported a storm surge inundation of 3.11 feet above mean higher high water.
For updated forecasts, please visit the National Hurricane Center website: www.nhc.noaa.gov.
Rob Gutro
NASA’s Goddard Space Flight Center
Update #4 – NASA Sees Hurricane Matthew Develop Concentric Eyewalls
Matthew developed concentric eyewalls which is common in intense hurricanes. The Global Precipitation Measurement mission or GPM core satellite captured an image of those double eyewalls.
Credits: NASA SVS
An eyewall consists of powerful thunderstorms in the area immediately outside the eye of a hurricane. Those storms have very heavy rainfall and strong winds.
“GPM had a recent overpass at 3:06 p.m. EDT [on Oct. 6] that shows that Matthew is undergoing an eyewall replacement cycle,” said Scott Braun, research meteorologist at NASA’s Goddard Space Flight Center in Greenbelt, Maryland. “The GPM image showed concentric rings of precipitation. The inner ring is the original eyewall, the larger outer ring is the new one”
“When this occurs, there is a transition from a small, extremely intense inner core of winds to a larger wind field that is not as intense at its maximum, but more spread out. In Matthew’s case, the winds have weakened from 140 to 120 mph moving it from category 4 to 3,” Braun said.
The larger eye means that the center of the storm does not have to track as close to the coast for the coast to experience the strong winds in the eyewall.
NASA’s Kennedy Space Center has already felt the effects of Matthew. “Hurricane Matthew is passing Cape Canaveral and Kennedy Space Center at this time with sustained winds of 90 mph with gusts to 107 mph,” said George Diller of the Office of Communications at NASA’s Kennedy Space Center, Cape Canaveral, Florida. “The storm is passing the space center about 26 miles off the tip of Cape Canaveral.”
At 8 a.m. EDT on Oct. 7, the National Hurricane Center (NHC) noted “Eyewall of dangerous Hurricane Matthew hugging the coast of central Florida.”
A Hurricane Warning is in effect for Sebastian Inlet to South Santee River, Florida. A Tropical Storm Warning is in effect for Jupiter Inlet to Sebastian Inlet; Anclote River to Suwannee River; North of South Santee River to Surf City. A Tropical Storm Watch is in effect for Anna Maria Island to Anclote River.
At 8 a.m. EDT (1200 UTC), the eye of Hurricane Matthew was located near 28.9 degrees north latitude and 80.3 degrees west longitude.
Maximum sustained winds are near 120 mph (195 kph) with higher gusts. Matthew is a category 3 hurricane on the Saffir-Simpson Hurricane Wind Scale. Although weakening is forecast during the next 48 hours, Matthew is expected to be a category 3 hurricane as it moves near the coast of Florida today.
Hurricane-force winds extend outward up to 60 miles (95 km) from the center, and tropical-storm-force winds extend outward up to 185 miles (295 km). Cape Canaveral recently reported and wind gust to 97 mph (155 kph), and Daytona Beach reported a wind gust of 67 mph (110 kph).
Matthew is moving toward the north-northwest near 13 mph (20 kph), and this general motion is expected to continue today. NHC said turn toward the north is expected tonight or Saturday. On the forecast track, the center of Matthew will be moving near or over the east coast of the Florida peninsula through tonight, and near or over the coasts of Georgia and South Carolina on Saturday, Oct. 8.
The latest minimum central pressure reported by the reconnaissance aircraft was 944 millibars.
For NHC forecast updates, conditions and tracks visit: http://www.nhc.noaa.gov.
Rob Gutro
NASA’s Goddard Space Flight Center
Update #3 – Oct. 07, 2016 – Hurricane Matthew Viewed from the International Space Station
Credits: NASA
Update #2 – Oct. 07, 2016 – NASA/NOAA Team up to Monitor Matthew
A NASA Global Hawk aircraft with instruments for the NOAA Sensing Hazards with Operational Unmanned Technology or SHOUT project is flying over Hurricane Matthew Friday, Oct. 7.
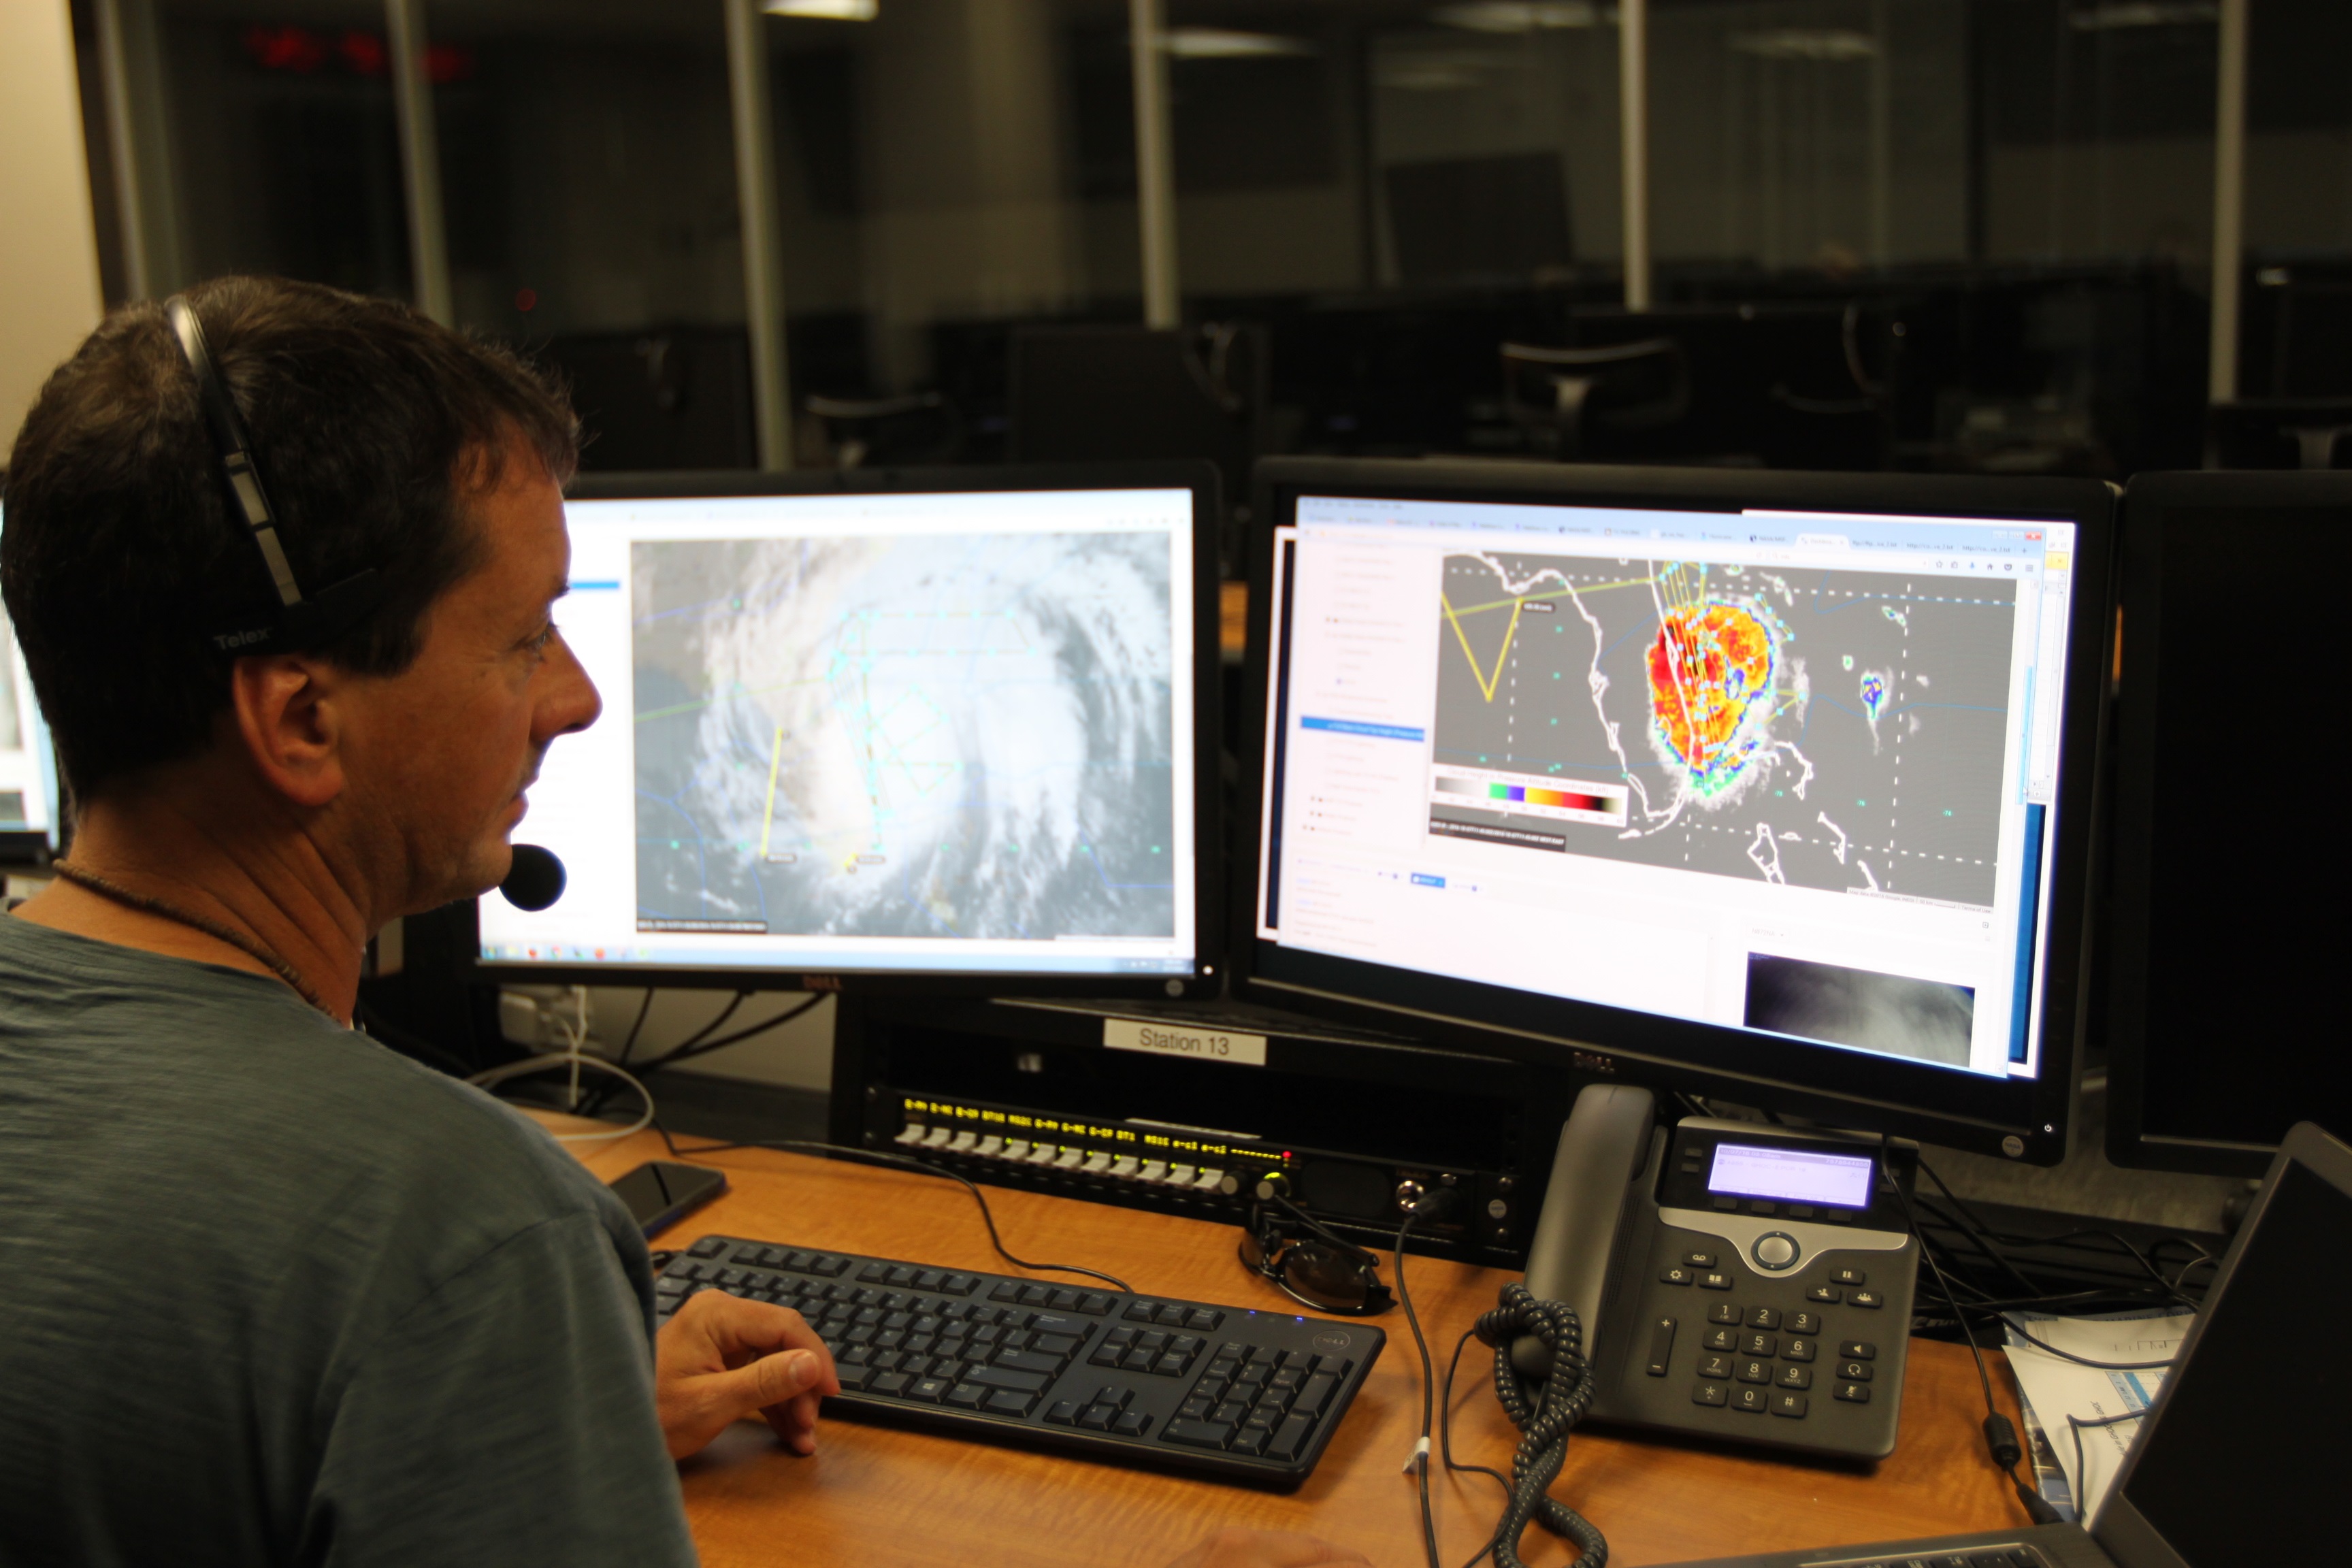
The aircraft flew from its home base at the Armstrong Flight Research Center in California to support the project. In addition NOAA, NASA and university scientists are at NASA’s Wallops Flight Facility in Virginia supporting the hurricane flight.
During the flight, the aircraft will deliver dropsondes (squares noted on the flight path in the photograph) that will gather data such as temperature, pressure, relative humidity and winds. This information will be delivered in real-time to the National Hurricane Center in Florida, the NOAA National Centers for Environmental Prediction and numerous modeling centers around the world for use in forecast and model development.
This is the second year of NOAA’s SHOUT, a three-year research project with NASA to evaluate the benefits of using the unmanned aircraft in routine operations to improve severe storm forecasts. The research also looks at whether unmanned aircraft can fill data gaps if there are interruptions in with weather satellite coverage.
Keith Koehler
NASA’s Wallops Flight Facility, Virginia
Update #1 – Oct. 07, 2016 – NASA’s Global Precipitation Measurement Mission satellite Shows a 3D View of Matthew’s Intensification
Credits: NASA
Update #5 – An Infrared Look at Hurricane Matthew from NASA’s AIRS
A JPL-developed advanced atmospheric sounding system aboard NASA’s Aqua satellite is providing important insights into the inner workings of dangerous Hurricane Matthew.
Hurricane Matthew, currently an extremely dangerous Category 4 storm on the Saffir-Simpson Hurricane Wind Scale, continues to bear down on the southeastern United States. At 11:23 a.m. PDT (2:23 p.m. EDT and 18:23 UT) today, NASA’s Atmospheric Infrared Sounder (AIRS) instrument aboard NASA’s Aqua satellite observed the storm as its eye was passing over the Bahamas. The AIRS false-color infrared image shows that the northeast and southwest quadrants of the storm had the coldest cloud tops, denoting the regions of the storm where the strongest precipitation was occurring at the time. Data from the Advanced Microwave Sounding Unit (AMSU), another of AIRS’ suite of instruments, indicate that the northeast quadrant, which appears smaller in the infrared image, likely had the most intense rain bands at the time. The AIRS infrared image shows that at the time of the image the storm had full circulation, with a small eye surrounded by a thick eye wall.
For more information on AIRS, visit:
Alan Buis
NASA’s Jet Propulsion Laboratory
Update #4 -NASA Sees Hurricane Matthew Regain Category 4 Status
Satellite imagery showed Hurricane Matthew’s clouds already streaming over Florida on Oct. 6 as it regained Category 4 status.
A visible image showing powerful Hurricane Matthew and Nicole on Oct. 6 at 1 p.m. EDT was captured by NOAA’s GOES-East satellite. The image shows large Hurricane Matthew’s clouds stretching from eastern Cuba and Hispaniola, over the Bahamas and extending to Florida. Matthew is west of the much smaller Tropical Storm Nicole. The image was created at the NASA/NOAA GOES Project at NASA’s Goddard Space Flight Center in Greenbelt, Maryland.
At 11 a.m. EDT (1500 UTC), the eye of Hurricane Matthew was located near 25.1 degrees north latitude and 77.8 degrees west longitude. That’s about 25 miles (40 km) west-northwest of Nassau, Bahamas and 180 miles (290 km) southeast of West Palm Beach, Florida.
NOAA’s National Hurricane Center (NHC) said the “eye is moving toward the northwest near 14 mph (22 kph) between Andros Island and Nassau in the Bahamas. This general motion is expected to continue today with a turn toward the north-northwest tonight or early Friday. On the forecast track, Matthew should cross the northwestern Bahamas later today and move close to or over the east coast of the Florida peninsula through Friday night.
Reports form an Air Force plane indicate that the maximum sustained winds are near 140 mph (220 kph) with higher gusts. Matthew is a category 4 hurricane on the Saffir-Simpson Hurricane Wind Scale. Some additional strengthening is possible, and Matthew should remain a Category 4 hurricane while it approaches the Florida coast.”
Hurricane-force winds extend outward up to 60 miles (95 km) from the center and tropical-storm-force winds extend outward up to 160 miles (260 km). The minimum central pressure estimated by an Air Force plane was 940 millibars.
For updated forecasts, please visit the NHC website at: www.nhc.noaa.gov.
Rob Gutro
NASA’s Goddard Space Flight Center
Oct. 06, 2016 – Update #3 – GPM Captures Hurricane Matthew Over Haiti
Credits: NASA’s Scientific Visualization Studio Data provided by the joint NASA/JAXA GPM mission.
Oct. 06, 2016 – Update #2 -NASA Calculates Matthew’s Heavy Rains
NASA satellite data was used to provide estimates of Hurricane Matthew’s heavy precipitation over the course of seven days. NASA estimates were created from a combination of space-borne passive microwave sensors and showed very heavy rainfall amounts in Matthew’s track and over Hispaniola.
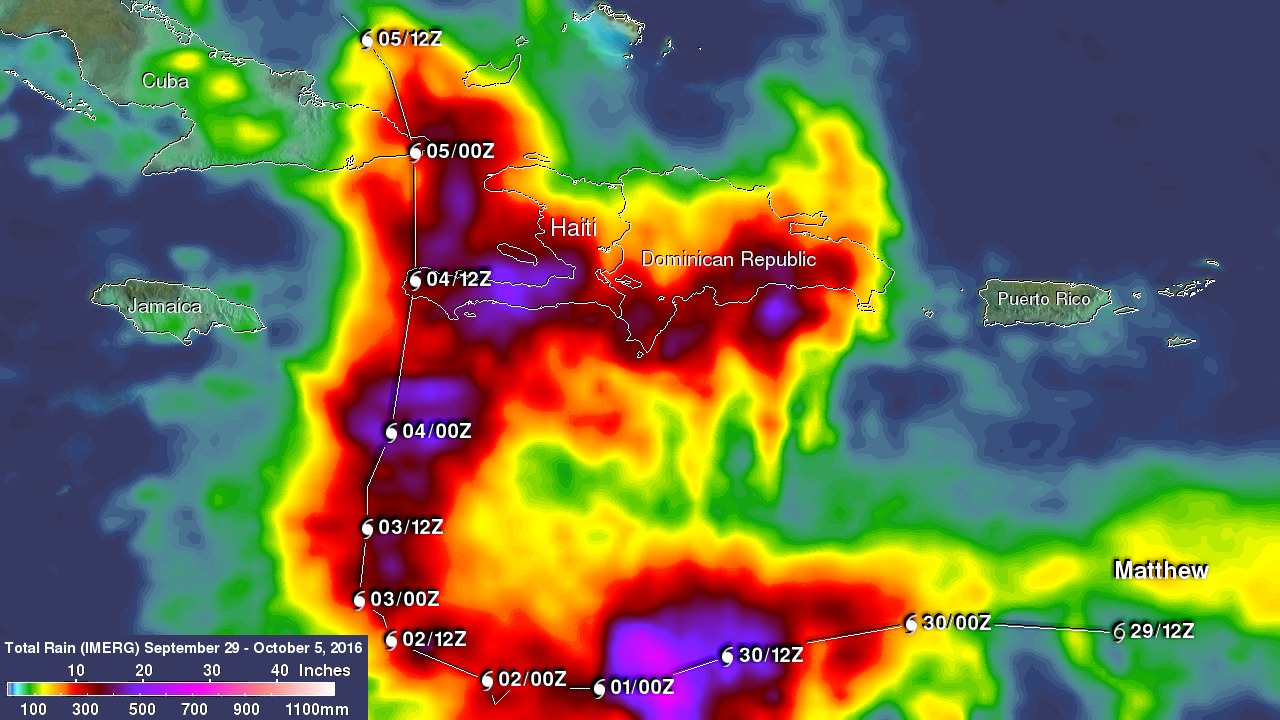
Matthew began as a fairly impressive tropical wave that emerged off of the coast of Africa on Sept.23 but had to make its way all the way across the Central Atlantic before finally organizing into a tropical storm on the morning of Sept. 28 while passing through the Windward Islands. Matthew then slowly but steadily intensified into a minimal hurricane by the early afternoon of the following day as it continued to track westward through the central eastern Caribbean.
The next day, September 30th, Matthew underwent a period of rapid intensification; its winds increased in intensity from 85 knots (~98 mph) to 140 knots (~161 mph) in the span of just 15 hours, taking the storm from a Category 2 to a Category 5 hurricane. Matthew was only at Category 5 intensity briefly, dipping back down to a still powerful Category 4 storm, which it maintained over the coming the 3 days. On Sunday, Oct. 2, while over the central Caribbean, Matthew made a turn to the north between a weak trough of lower pressure over the Gulf of Mexico and a ridge of higher pressure to its east. This put the storm on a direct course for southwest Haiti, the eastern tip of Cuba and the lower Bahamas. Matthew stuck the southwest coast of Haiti around 7 a.m. EDT as a powerful Category 4 hurricane near Les Anglais on the morning of Tuesday, Oct. 4 with maximum sustained winds reported at 145 mph by the National Hurricane Center. Matthew then continued moving northward before striking the eastern tip of Cuba in the evening later that same day before starting to veer off towards the northwest towards the Central Bahamas as a slightly weaker Category 3 storm.
Credits: NASA/JAXA, Hal Pierce
NASA’s Integrated Multi-satellitE Retrievals for GPM or IMERG product is used to make estimates of precipitation from a combination of space-borne passive microwave sensors, including the GMI microwave sensor onboard the Global Precipitation Measurement mission or GPM satellite, and geostationary IR (infrared) data.
This image shows IMERG rainfall estimates for the period from Sept. 29 to Oct. 5, 2016 for the northeastern Caribbean in association with the passage of Hurricane Matthew, which is indicated by the white line and corresponding storm symbols. Beginning at 00 UTC on the Sept. 30 rainfall totals associated with Matthew are in excess of 10 inches all along its track, reaching upwards of 25 inches when the storm was intensifying on the Sept. 30.
Over land, IMERGE shows wide areas of between 15 to 20 inches of rain all along the southern coasts of Haiti and the Dominican Republic on the island of Hispaniola. Rainfall amounts on the right side of Matthew are higher where the storm’s counter-clockwise cyclonic circulation interacted with the island’s topography. A separate but nearby cluster of thunderstorms on the eastern side of Matthew also contributed to the rainfall totals there.
Haiti was hit hard by the storm. Though damage estimates are still coming in, so far a major bridge connecting Port-au-Prince with the southern part of country has been swept away by flooding as a result of the storm.
Currently, all eyes along the U.S. East Coast are on Matthew. With warm waters and a favorable environment, the National Hurricane Center is forecasting Matthew, which has since regained some of its strength, to remain a powerful Category 4 storm as it approaches the east coast of Florida, forcing a massive evacuation from Florida to South Carolina.
GPM is a joint mission between NASA and the Japanese space agency JAXA. Maximum rainfall totals for the real-time IMERG product have been adjusted to reflect observed values.
Steve Lang
NASA’s Goddard Space Flight Center
Oct. 06, 2016 – Update #1 – NASA Sees Hurricane Matthew Moving Through the Bahamas
Satellites continue to provide forecasters and scientists valuable data on the development and changes in Hurricane Matthew as it moves through the Bahamas and toward the Florida coast. NASA and NOAA satellites have provided visible, infrared and microwave data that enable forecasters to analyze the storm. The National Hurricane Center noted that Matthew is forecast to be a category 4 hurricane as it approaches the east coast of Florida.
On Oct. 5 at 2:30 p.m. EDT (1830 UTC) the Visible Infrared Imaging Radiometer Suite (VIIRS) instrument aboard the NASA-NOAA Suomi NPP satellite captured a visible image of Hurricane Matthew moving through the Bahamas.
At NASA’s Goddard Space Flight Center in Greenbelt, Maryland the NASA/NOAA GOES Project combined infrared and visible imagery from NOAA’s GOES-East satellite into an animation of Matthew. The animation of imagery from Oct. 4 to Oct. 6 shows Hurricane Matthew making landfall on Oct. 4 in western Haiti and moving through the Bahamas on Oct. 6.
A Hurricane Warning is in effect for the Southeastern Bahamas including The Inaguas, Mayaguana, Acklins, Crooked Island, Long Cay, and Ragged Island. The warning is in effect for the Central Bahamas, Including Long Island, Exuma, Rum Cay, San Salvador, and Cat Island; the Northwestern Bahamas, including The Abacos, Andros Island, Berry Islands, Bimini, Eleuthera, Grand Bahama Island and New Providence. In Florida and Georgia, Hurricane Warnings are in effect north Of Golden Beach Florida to Altamaha Sound Georgia and Lake Okeechobee.
Credits: NASA/NOAA GOES Project
A Hurricane Watch is in effect from north of Altamaha Sound to South Santee River South Carolina. A Tropical Storm Warning is in effect from Chokoloskee to Golden Beach, Florida; for the Florida Keys from Seven Mile Bridge Eastward and Florida Bay. A Tropical Storm Watch is in effect from north Of Chokoloskee to Suwannee River.
At 8 a.m. EDT (1200 UTC), the eye of Hurricane Matthew was located near 24.6 degrees north latitude and 77.5 degrees west longitude. That’s about 30 miles (45 km) south-southwest of Nassau, Bahamas and 215 miles (350 km) southeast of West Palm Beach, Florida.
The National Hurricane Center (NHC) said that Matthew is moving toward the northwest near 12 mph (19 kph), and this general motion is expected to continue today, Oct. 6. A turn toward the north-northwest is expected tonight. On the forecast track, the eye of Matthew should pass near Andros Island and New Providence in the northwestern Bahamas during the next few hours, pass near Grand Bahama Island late today, and move very close to the east coast of the Florida peninsula tonight through Friday night, Oct. 7.
NHC said that reports from an Air Force Reserve Hurricane Hunter aircraft indicate that the maximum sustained winds remain near 125 mph (205 kph) with higher gusts. Matthew is a category 3 hurricane on the Saffir-Simpson Hurricane Wind Scale. Additional strengthening is expected today, and Matthew is forecast to be a category 4 hurricane as it approaches the east coast of Florida.
Hurricane-force winds extend outward up to 40 miles (65 km) from the center and tropical-storm-force winds extend outward up to 160 miles (260 km). Nassau in the Bahamas recently reported sustained winds of 50 mph (80 kph) with a wind gust of 61 mph (98 km/h).
The latest minimum central pressure estimated by a reconnaissance aircraft was 940 millibars.
For updated forecasts, please visit the NHC website at : www.nhc.noaa.gov.
Rob Gutro
NASA’s Goddard Space Flight Center
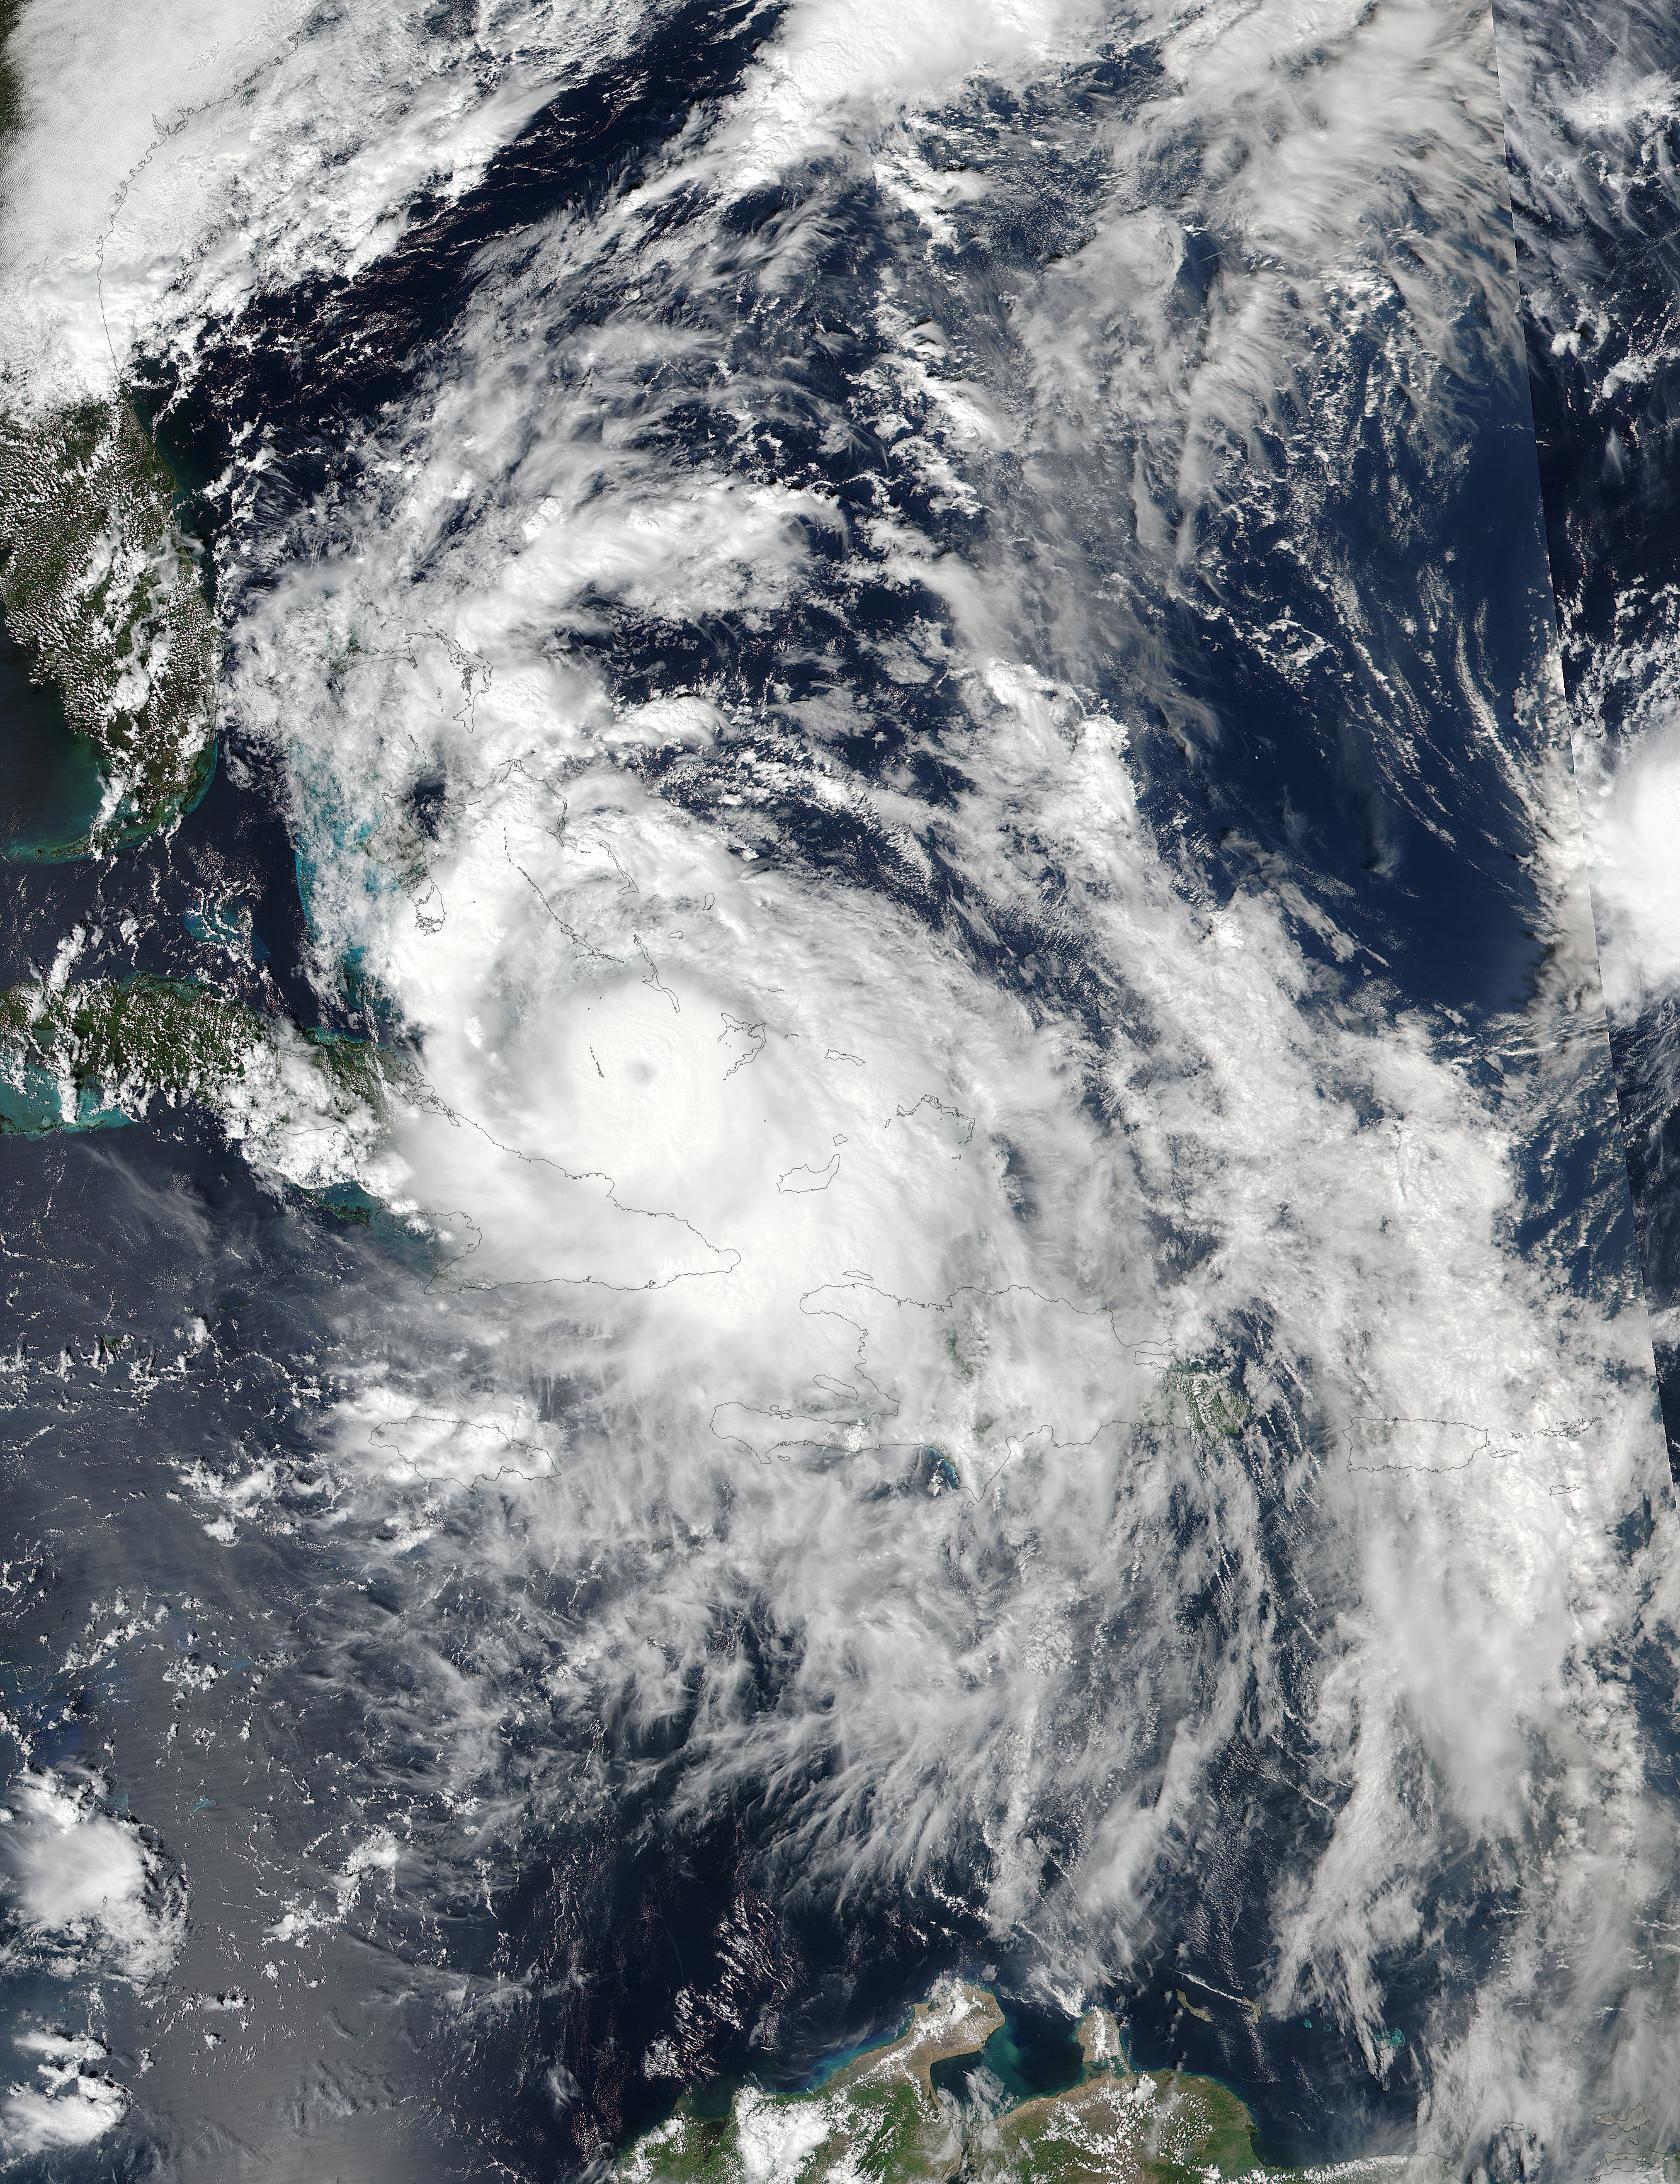
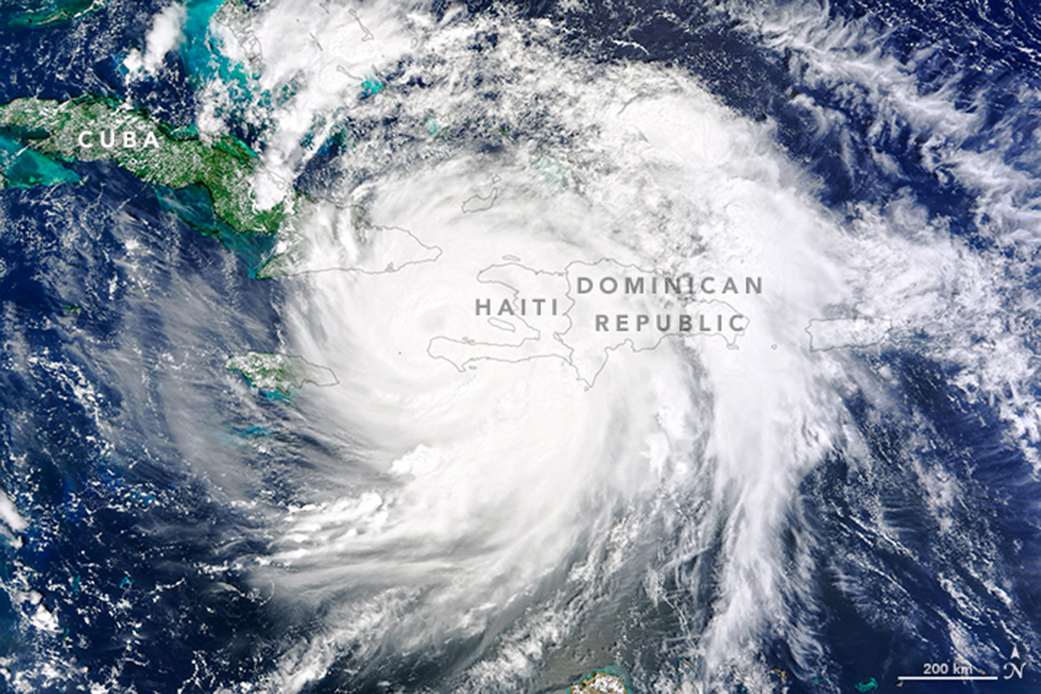
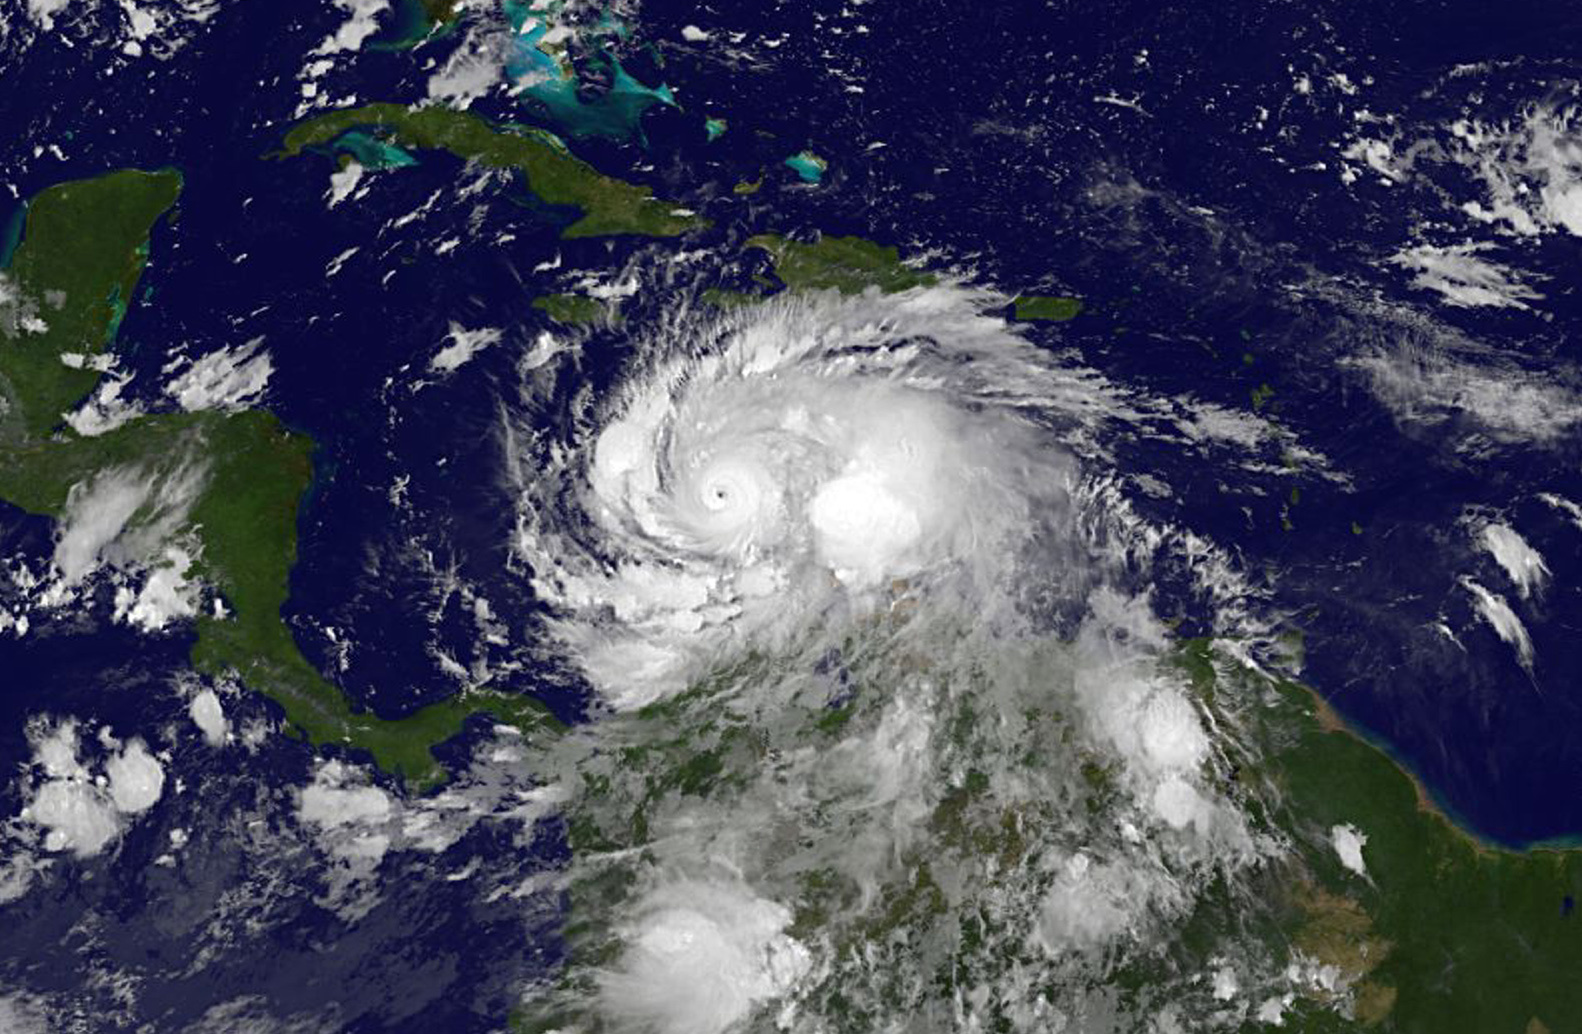
Oct. 05, 2016 – NASA Sees Hurricane Matthew Heading for the Bahamas
Satellites from NASA and NOAA have been tracking and analyzing powerful Hurricane Matthew since its birth just east of the Leeward Islands on Sept. 28.
On October 4, 2016, Hurricane Matthew made landfall on southwestern Haiti as a category-4 storm—the strongest storm to hit the Caribbean nation in more than 50 years. Just hours after landfall, the Moderate Resolution Imaging Spectroradiometer (MODIS) on NASA’s Terra satellite acquired a natural-color image that showed the western extent over the eastern tip of Cuba and the eastern-most extent over Puerto Rico.
At NASA’s Goddard Space Flight Center in Greenbelt, Maryland the NASA/NOAA GOES Project combined infrared and visible imagery from NOAA’s GOES-East satellite into an animation of Matthew. The animation of imagery from Oct. 3 to Oct. 5 shows Hurricane Matthew making landfall in Haiti and eastern Cuba then move toward the Bahamas.
On Oct. 5, there were many warnings and watches in effect on Oct. 5 from Cuba to the Bahamas to Florida.
A Hurricane Warning is in effect for the Cuban provinces of Guantanamo, Santiago de Cuba, Holguin, Granma and Las Tunas; the Southeastern Bahamas, including the Inaguas, Mayaguana, Acklins, Crooked Island, Long Cay, and Ragged Island; the Central Bahamas, including Long Island, Exuma, Rum Cay, San Salvador, and Cat Island; the Northwestern Bahamas, including the Abacos, Andros Island, Berry Islands, Bimini, Eleuthera, Grand Bahama Island, and New Providence. In Florida a Hurricane Warning is in effect from north of Golden Beach to the Flagler/Volusia county line and Lake Okeechobee.
A Hurricane Watch is in effect for the Cuban province of Camaguey and north of the Flagler/Volusia county line to Fernandina Beach. A Tropical Storm Warning is in effect for Haiti, Turks and Caicos Islands. In Florida a Hurricane Watch is in effect for Chokoloskee to Golden Beach, the Florida Keys from Seven Mile Bridge eastward, and Florida Bay.
At 11 a.m. EDT (1500 UTC), the eye of Hurricane Matthew was located near 21.8 degrees north latitude and 75.2 degrees west longitude. That’s about 55 miles (90 km) north-northwest of Cabo Lucrecia, Cuba and about 105 miles (165 km) south of Long Island, Bahamas.
Credits: NASA/NOAA GOES Project
The National Hurricane Center (NHC) said “Matthew is moving toward the northwest near 12 mph (19 kph), and this motion is expected to continue during the next 24 to 48 hours. On this track, Matthew will be moving across the Bahamas through Thursday, and is expected to be very near the east coast of Florida by Thursday evening, Oct. 6.
Maximum sustained winds are near 120 mph (195 kph) with higher gusts. Matthew is a category 3 hurricane on the Saffir-Simpson Hurricane Wind Scale. Some strengthening is forecast during the next couple of days, and Matthew is expected to remain at category 3 or stronger while it moves through the Bahamas and approaches the east coast of Florida. Hurricane-force winds extend outward up to 45 miles (75 km) from the center and tropical-storm-force winds extend outward up to 175 miles (280 km).”
The minimum central pressure reported by both Hurricane Hunter planes was 962 millibars.
An unconfirmed wind gust of 155 mph (250 kph) was reported in Baracoa, Cuba, on the night of Oct. 4 as the eye of Matthew passed nearby.
For storm specifics on rainfall, wind and storm surge, visit the NHC website: www.nhc.noaa.gov.
Rob Gutro
NASA’s Goddard Space Flight Center
Oct. 4, 2016 – Update No. 2 – View of Matthew from the International Space Station
Credits: NASA
Download this video in HD formats
Oct. 4, 2016 – Update No. 1 – NASA Sees Hurricane Matthew Making Landfall in Haiti
Hurricane Matthew made landfall in western Haiti during the morning hours of Oct. 4, and a NASA animation of NOAA’s GOES-East satellite covered the monster storm.
NOAA’s GOES-East satellite provides continuous imagery of the Atlantic Ocean and eastern U.S. and has been keeping a close eye on powerful Hurricane Matthew. Infrared imagery shows Matthew’s movements at night, while visible imagery shows Matthew’s movements during the day. At NASA’s Goddard Space Flight Center in Greenbelt, Maryland, both infrared and visible imagery were combined into an animation from Oct. 2 to Oct. 4. The animation ends just after Hurricane Matthew made landfall on Oct. 4 near Les Anglais in western Haiti about 7 a.m. EDT (1100 UTC).
A hurricane warning is in effect for Haiti; the Cuban provinces of Guantanamo, Santiago de Cuba, Holguin, Granma and Las Tunas; the southeastern Bahamas, including the Inaguas, Mayaguana, Acklins, Crooked Island, Long Cay and Ragged Island; the Central Bahamas, including Long Island, Exuma, Rum Cay, San Salvador and Cat Island; and the northwestern Bahamas, including the Abacos, Andros Island, Berry Islands, Bimini, Eleuthera, Grand Bahama Island and New Providence.
A tropical storm warning is in effect for the Dominican Republic from Barahona westward to the border with Haiti, Jamaica, and the Turks and Caicos Islands.
There are also hurricane and tropical storm watches in effect today, Oct. 4. A hurricane watch is in effect for the Cuban province of Camaguey. A tropical storm watch is in effect for the Dominican Republic from Puerto Plata westward to the border with Haiti.
On Oct. 4 at 2:10 a.m. EDT (0610 UTC), NASA’s Aqua satellite passed over Matthew and analyzed the hurricane in infrared light to show temperatures. The MODIS, or Moderate Resolution Imaging Spectroradiometer, instrument aboard NASA’s Aqua satellite revealed cloud top temperatures as cold or colder than minus 70 F (minus 56.6 C). NASA research indicates very cold cloud tops with the potential to generate very heavy rainfall.
At 8 a.m. EDT (1200 UTC) on Oct. 4 the eye of Hurricane Matthew was located inland Haiti near 18.4 degrees north latitude and 74.2 degrees west longitude. That’s just 10 miles (15 km) east of Tiburon, Haiti, and about 125 miles (200 km) south of the eastern tip of Cuba.
NOAA’s National Hurricane Center (NHC) said Matthew was moving to the north near 9 mph (15 kph), and this general motion is expected to continue today. A turn toward the north-northwest is expected by Wednesday, Oct. 5, followed by a northwest turn Wednesday night. On the forecast track, the eye of Matthew will move near or over portions of the southeastern and central Bahamas tonight and Wednesday, and approach the northwestern Bahamas Wednesday night.
Maximum sustained winds remain near 145 mph (230 kph) with higher gusts. Matthew is a category 4 hurricane on the Saffir-Simpson Hurricane Wind Scale. Some fluctuations in intensity are possible during the next couple of days, but Matthew is expected to remain a powerful hurricane through at least Wednesday night.
Hurricane-force winds extend outward up to 40 miles (65 km) from the center and tropical-storm-force winds extend outward up to 185 miles (295 km). The estimated minimum central pressure is 934 millibars.
For information on rainfall, storm surge, winds and updated forecasts and tracks, visit the National Hurricane Center website: http://www.nhc.noaa.gov.
By Rob Gutro
NASA’s Goddard Space Flight Center, Greenbelt, Md.
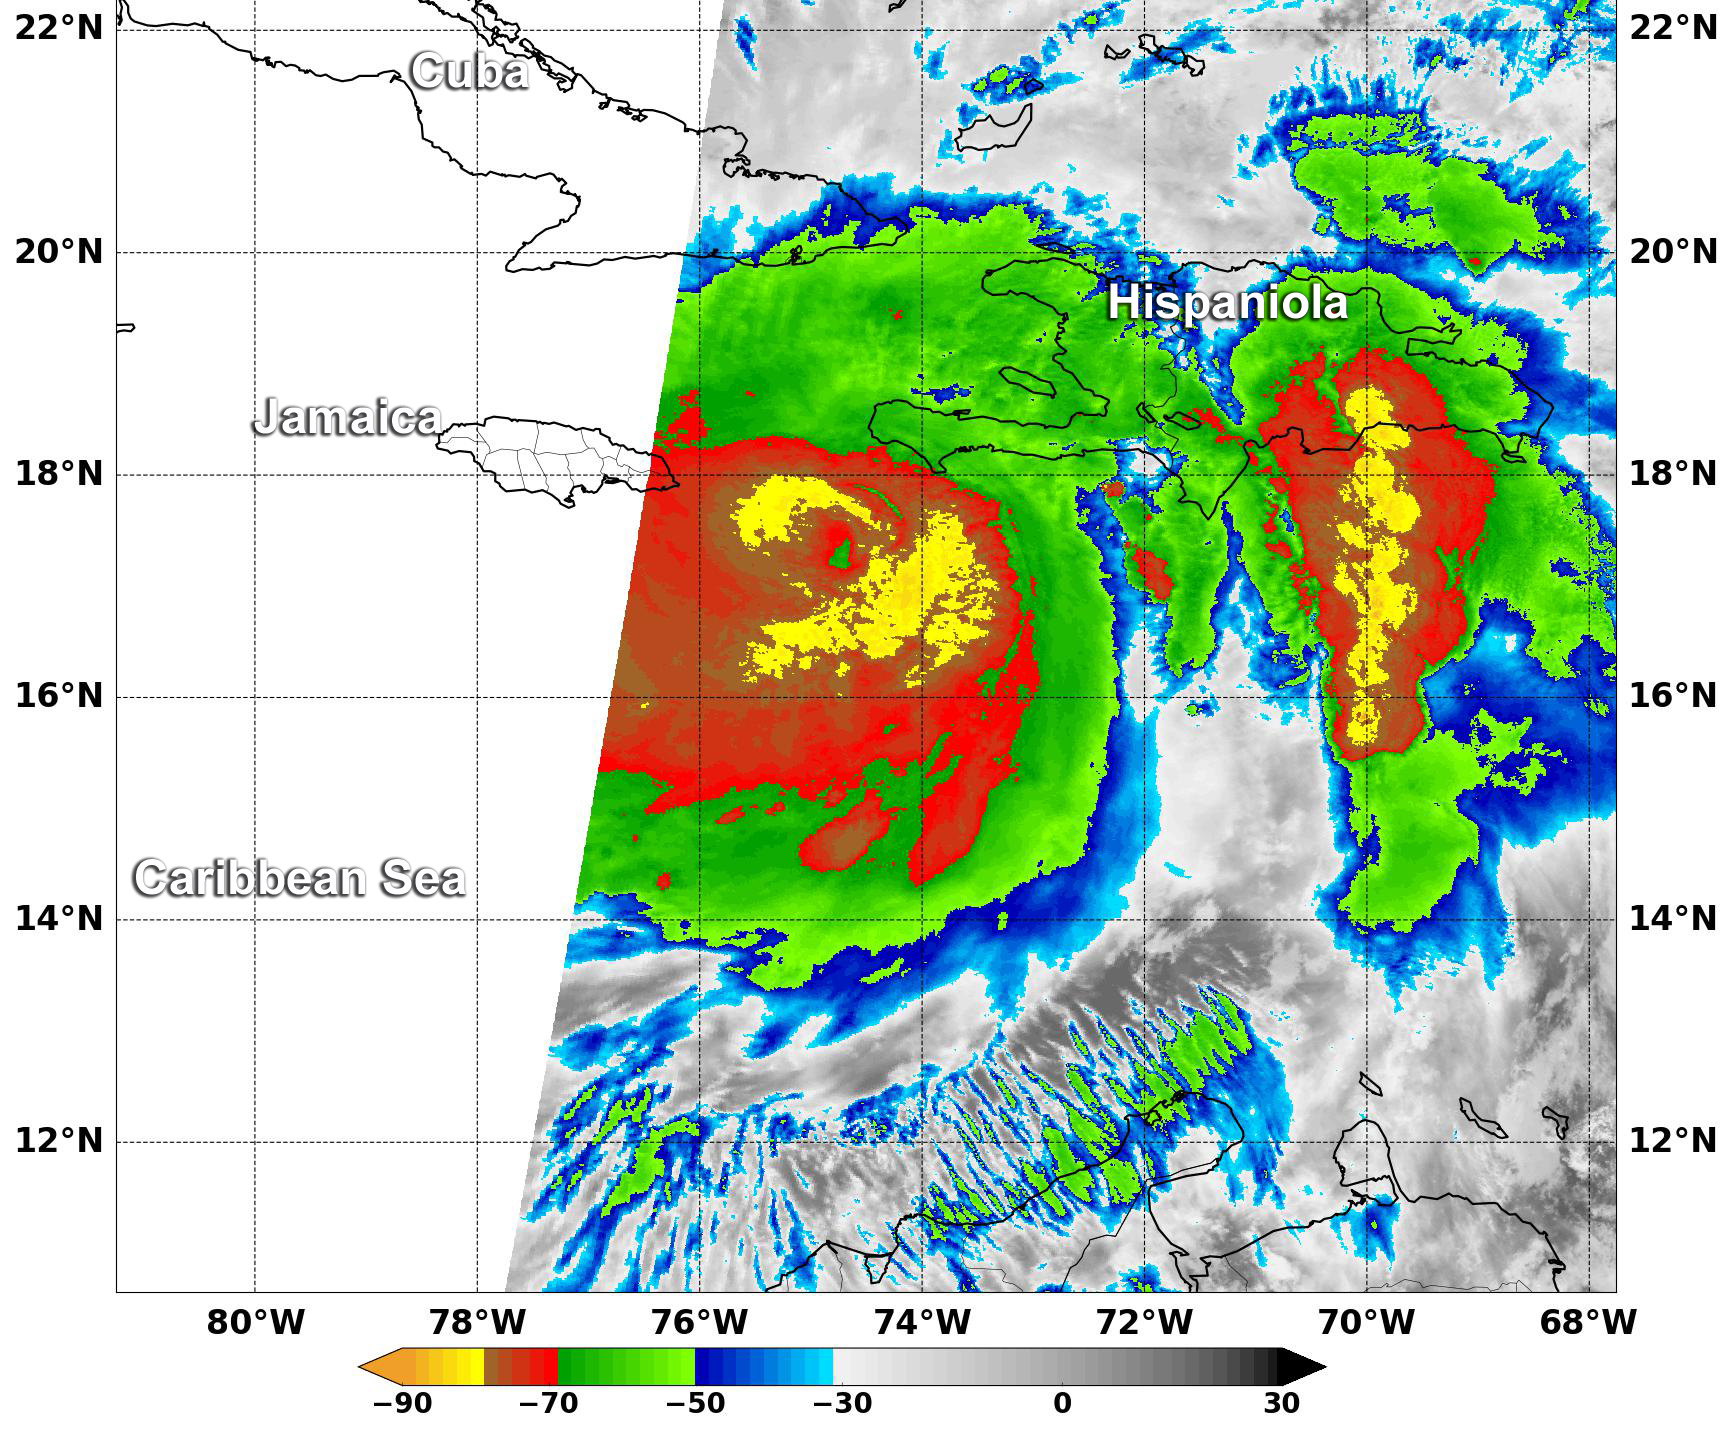
Oct. 3, 2016 – NASA Sees Hurricane Matthew Producing Dangerous Rainfall
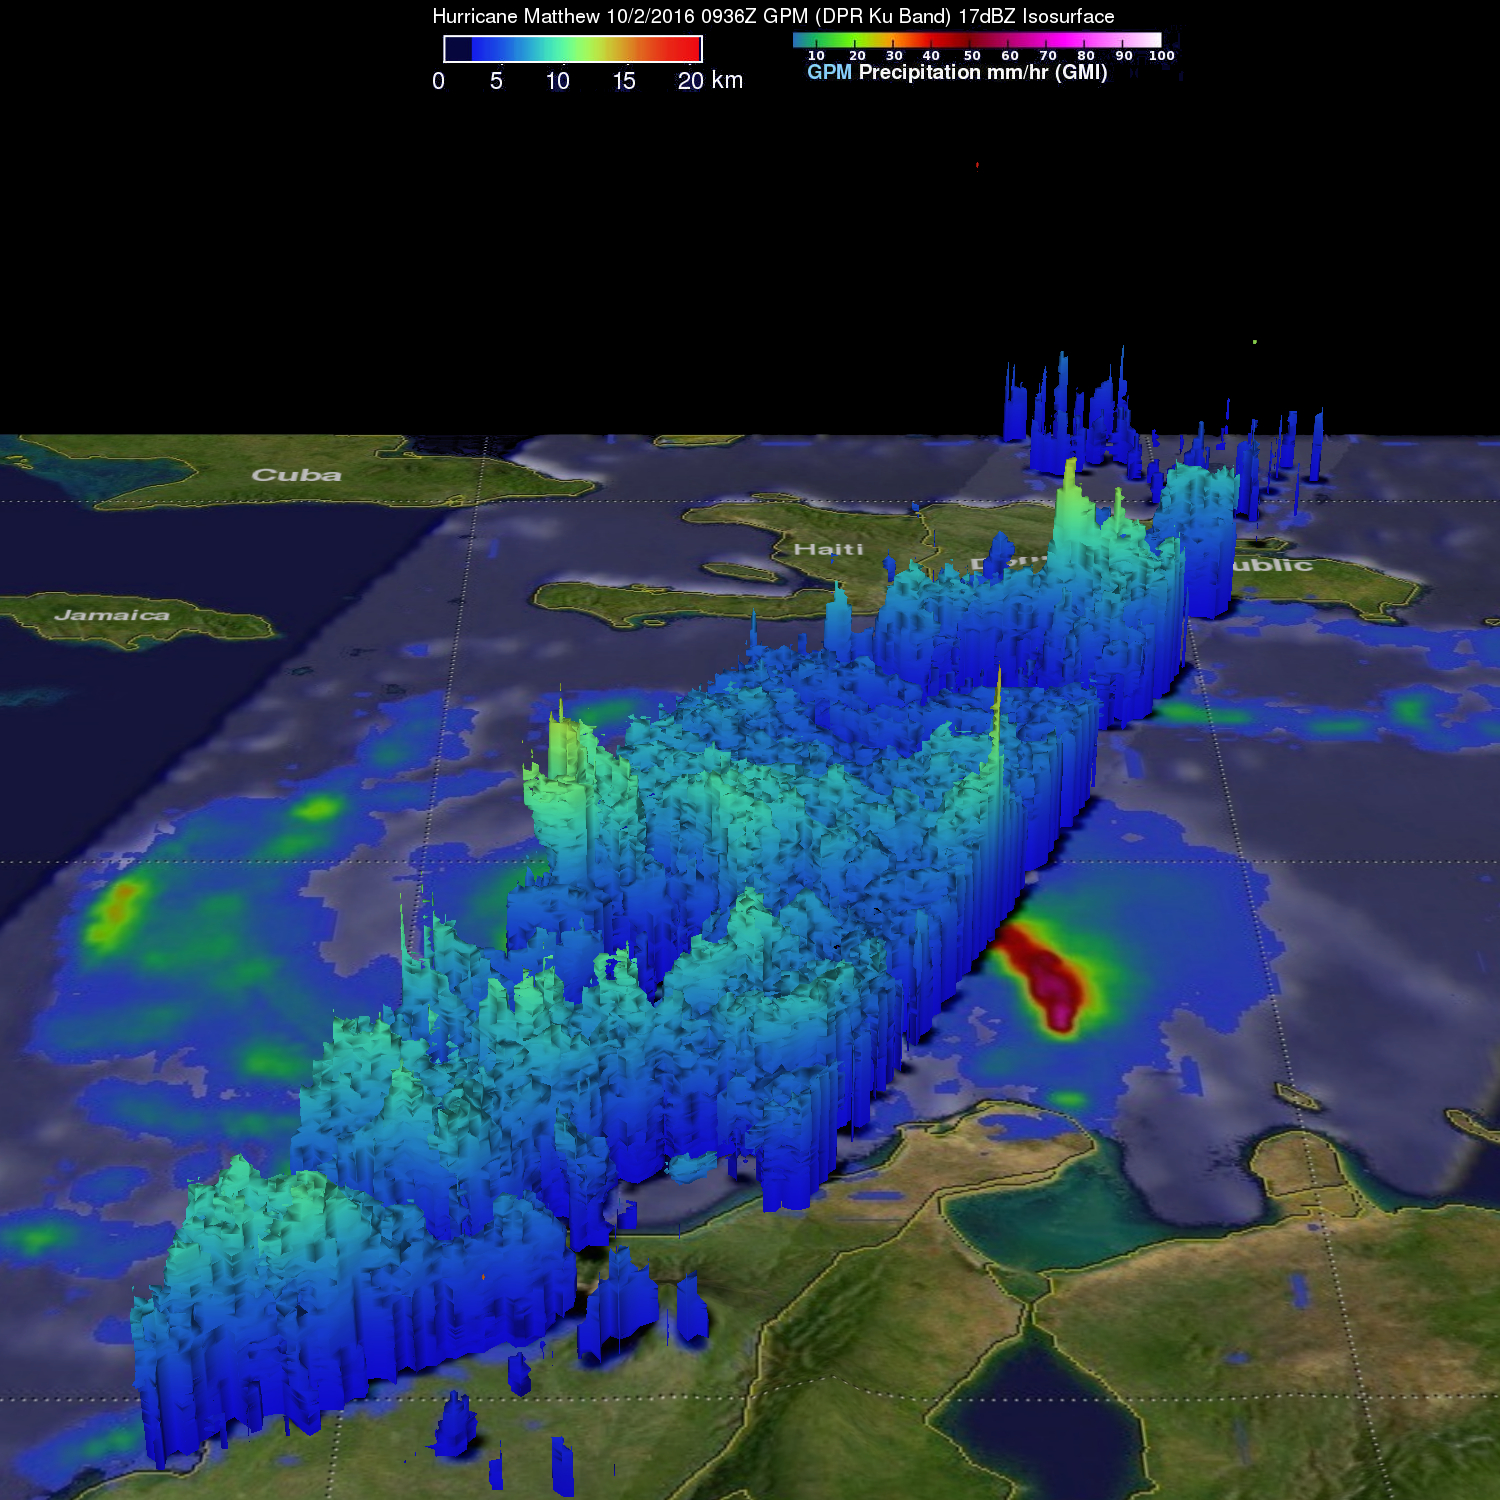
The Global Precipitation Measurement mission or GPM core observatory satellite passed above major Hurricane Matthew and found very heavy rainfall that is expected to affect Hispaniola.
On Oct. 2 at 5:46 a.m. EDT (0946 UTC) GPM’s Microwave Imager (GMI) and Dual-Frequency Precipitation Radar (DPR) instruments collected data that were used to create a map of rainfall occurring within Hurricane Matthew. GPM found very heavy rainfall falling at a rate of over 6.4 inches (163 mm) in some areas near hurricane Matthew.
“Heaviest rain was seen well to the east of Hurricane Matthew’s center,” said Hal Pierce of NASA’s Goddard Space Flight Center in Greenbelt, Maryland, who created the imagery. “This area of strong convective storms has been persistent over the past few days. This area of intense rainfall is due to convergence between the trade winds (prevailing easterlies) and the wind flow from the south with Matthew. This area of heavy rainfall with Matthew may cause devastating torrential rainfall as it moves slowly over Haiti.” Up to 40 inches (1016 mm) of rainfall have been predicted over Haiti.
A 3-D depiction of storm tops was created using data from GPM’s radar (DPR Ku Band). The 3-D image showed the area of heaviest rainfall east of Hurricane Matthew’s eye. Several storms in the area had cloud tops that were measured by DPR reaching heights above 9.9 miles (16 km). GPM is a joint mission between NASA and the Japan Aerospace Exploration Agency JAXA.
On Oct. 3 many warnings and watches were in effect from NOAA’s National Hurricane Center (NHC). A Hurricane Warning is in effect for Jamaica, Haiti, and the Cuban provinces of Guantanamo, Santiago de Cuba, Holguin, Granma, and Las Tunas. Hurricane Warnings were also in effect for the southeastern Bahamas, including the Inaguas, Mayaguana, Acklins, Crooked Island, Long Cay, and Ragged Island.
Credits: NASA/NOAA GOES Project
A Hurricane Watch is in effect for the Cuban province of Camaguey, Turks and Caicos Islands, Central Bahamas, including Long Island, Exuma, Rum Cay, San, Salvador, and Cat Island.
A Tropical Storm Warning is in effect for Dominican Republic from Barahona westward to the border with Haiti, and a Tropical Storm Watch is in effect for the Dominican Republic from Puerto Plata westward to the border with Haiti. Interests elsewhere in Hispaniola and in the Bahamas should monitor the progress of Matthew.
NHC said at 8 a.m. EDT (1200 UTC) the eye of Hurricane Matthew was located near 15.4 degrees north latitude and 74.9 degrees west longitude. That puts the eye about 220 miles (355 km) southeast of Kingston, Jamaica, and about 280 miles (450 km) southwest of Port Au Prince, Haiti.
Matthew was moving toward the north near 6 mph (9 kph). NHC said a general northward motion with some increase in forward speed is expected through Tuesday, Oct. 4. On the forecast track, the center of Matthew will approach Jamaica and southwestern Haiti tonight, and eastern Cuba on Tuesday.
Maximum sustained winds are near 130 mph (215 kph) with higher gusts. Matthew is a dangerous category 4 hurricane on the Saffir-Simpson Hurricane Wind Scale. Some fluctuations in intensity are possible during the next couple of days, but Matthew is expected to remain a powerful hurricane through early Wednesday.
Hurricane-force winds extend outward up to 30 miles (45 km) from the center and tropical-storm-force winds extend outward up to 195 miles (315 km). The estimated minimum central pressure is 943 millibars.
At NASA Goddard, the NASA/NOAA GOES Project created an animation of infrared and visible satellite imagery that showed the movement and strengthening of Matthew from Sept. 30 to Oct. 3. Matthew reached Category 5 status late on Oct. 1 and dropped slightly to Category 4 status the next day where it remained on Oct. 3.
NHC said that NOAA buoy 42058, located about 40 miles (70 km) south of the center of Matthew, recently reported a sustained wind of 58 mph (94 km/h) and a wind gust of 74 mph (119 kph).
For updated forecasts, visit: www.nhc.noaa.gov.
Rob Gutro / Hal Pierce
NASA’s Goddard Space Flight Center
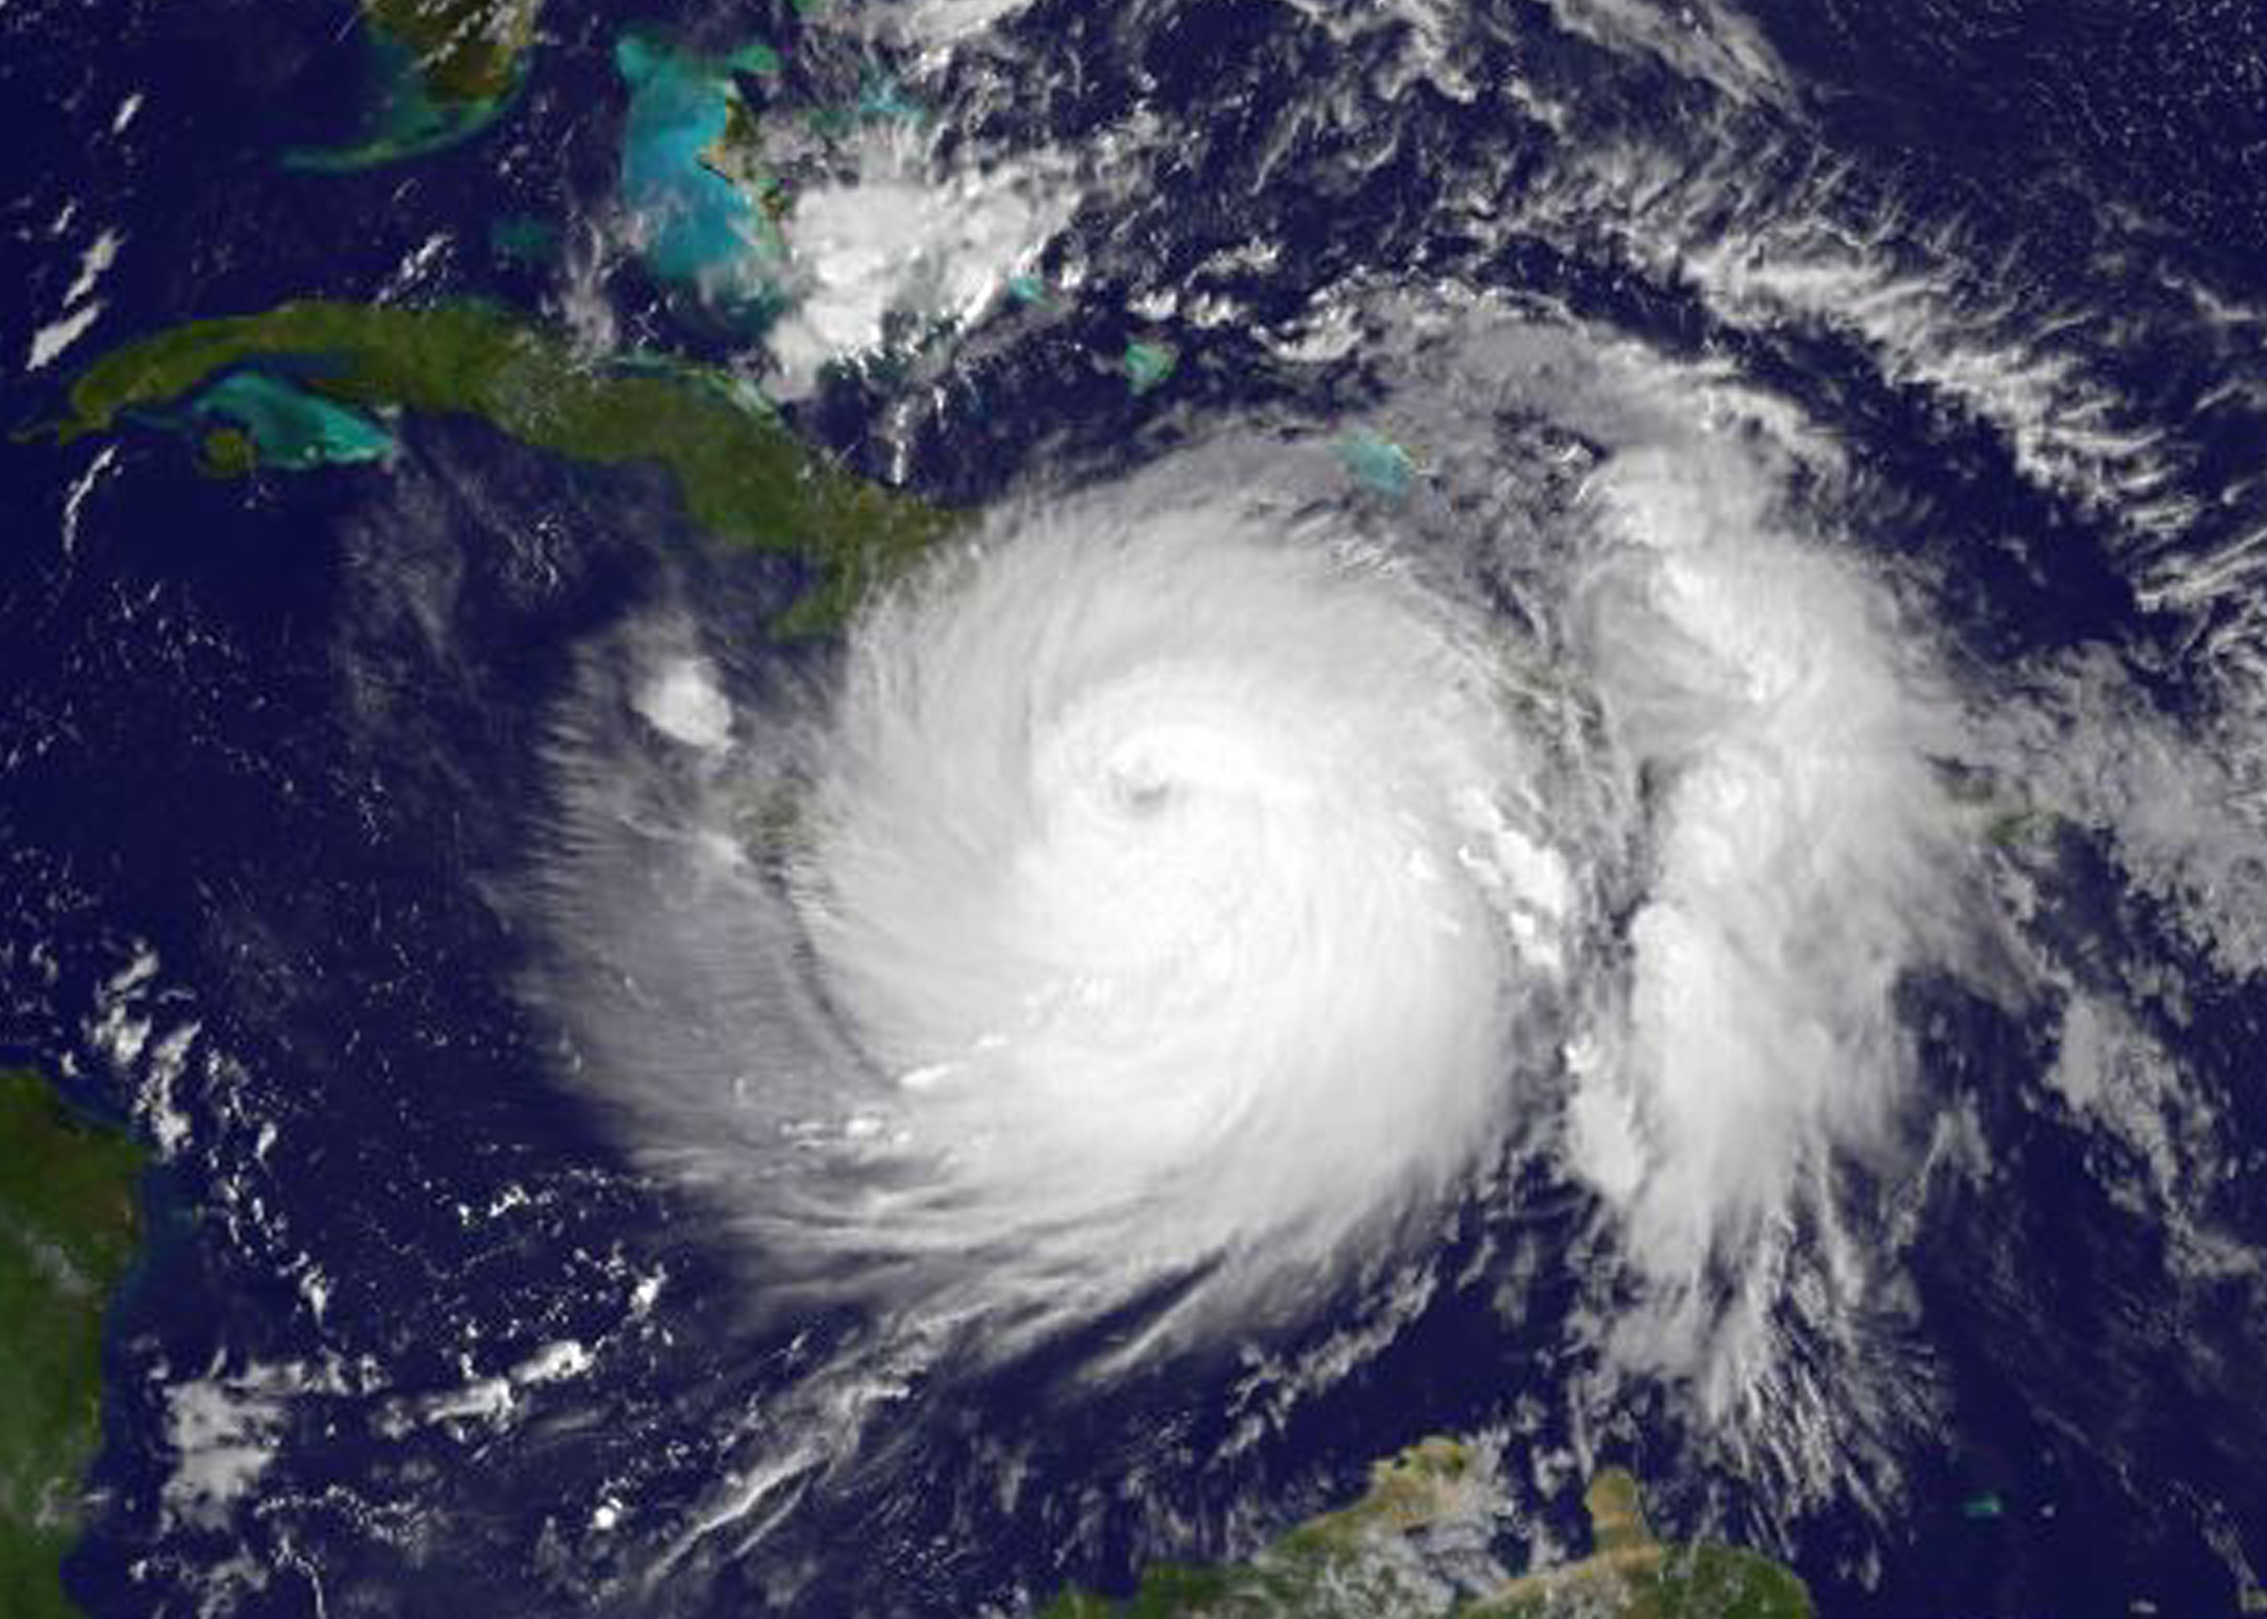
Oct. 02, 2016 – Satellite View of Powerful Hurricane Matthew in Central Caribbean
NOAA’s GOES-East satellite captured an image of Hurricane Matthew in the central Caribbean Sea early on Oct. 2.
On Oct. 2, many watches and warnings were in effect as Matthew moves to the northwest. A Hurricane Warning is in effect for Jamaica, Haiti, the Cuban provinces of Guantanamo, Santiago de Cuba, Holguin, Granma, and Las Tunas. A Hurricane Watch is in effect for Cuban province of Camaguey; Southeastern Bahamas, including the Inaguas, Mayaguana, Acklins, Crooked Island, Long Cay, and Ragged Island and the Turks and Caicos Islands.
A Tropical Storm Warning is in effect for the Dominican Republic from Barahona westward to the border with Haiti. A Tropical Storm Watch is in effect for the Dominican Republic from Puerto Plata westward to the border with Haiti.
The NASA/NOAA GOES Project at NASA’s Goddard Space Flight Center in Greenbelt, Maryland created an image of Hurricane Matthew. The image showed a small eye surrounded by bands of powerful thunderstorms wrapping around it. The image also revealed powerful thunderstorms in fragmented bands on the western and eastern side of the storm.
At 8 a.m. EDT (1200 UTC), the center of Hurricane Matthew was located near latitude 14.1 North, longitude 74.3 West. Matthew is moving toward the northwest near 5 mph (7 kph). This general motion is expected to continue today, followed by a turn toward the north tonight. On the forecast track, the center of Matthew will approach southwestern Haiti and Jamaica on Monday, Oct. 4
NOAA’s National Hurricane Center (NHC) said, Matthew’s maximum sustained winds were near 150 mph (240 kph) with higher gusts. Matthew is a category 4 hurricane on the Saffir-Simpson Hurricane Wind Scale. Some fluctuations in intensity are possible during the next couple of days, but Matthew is expected to remain a powerful hurricane through Monday night.
For updated forecasts, visit the NHC website: www.nhc.noaa.gov.
Rob Gutro
NASA’s Goddard Space Flight Center
Oct. 01, 2016 – NASA’s GPM Analyzes Matthew as it Strengthens Toward a Category 5
Matthew rapidly intensified Thursday evening, Sept. 29 and by Friday Sept. 30 at 11 p.m. EDT it became a Category 5 Hurricane on the Saffir-Simpson Hurricane Wind Scale. The Global Precipitation Measurement mission or GPM core satellite analyzed the major hurricane’s rainfall.
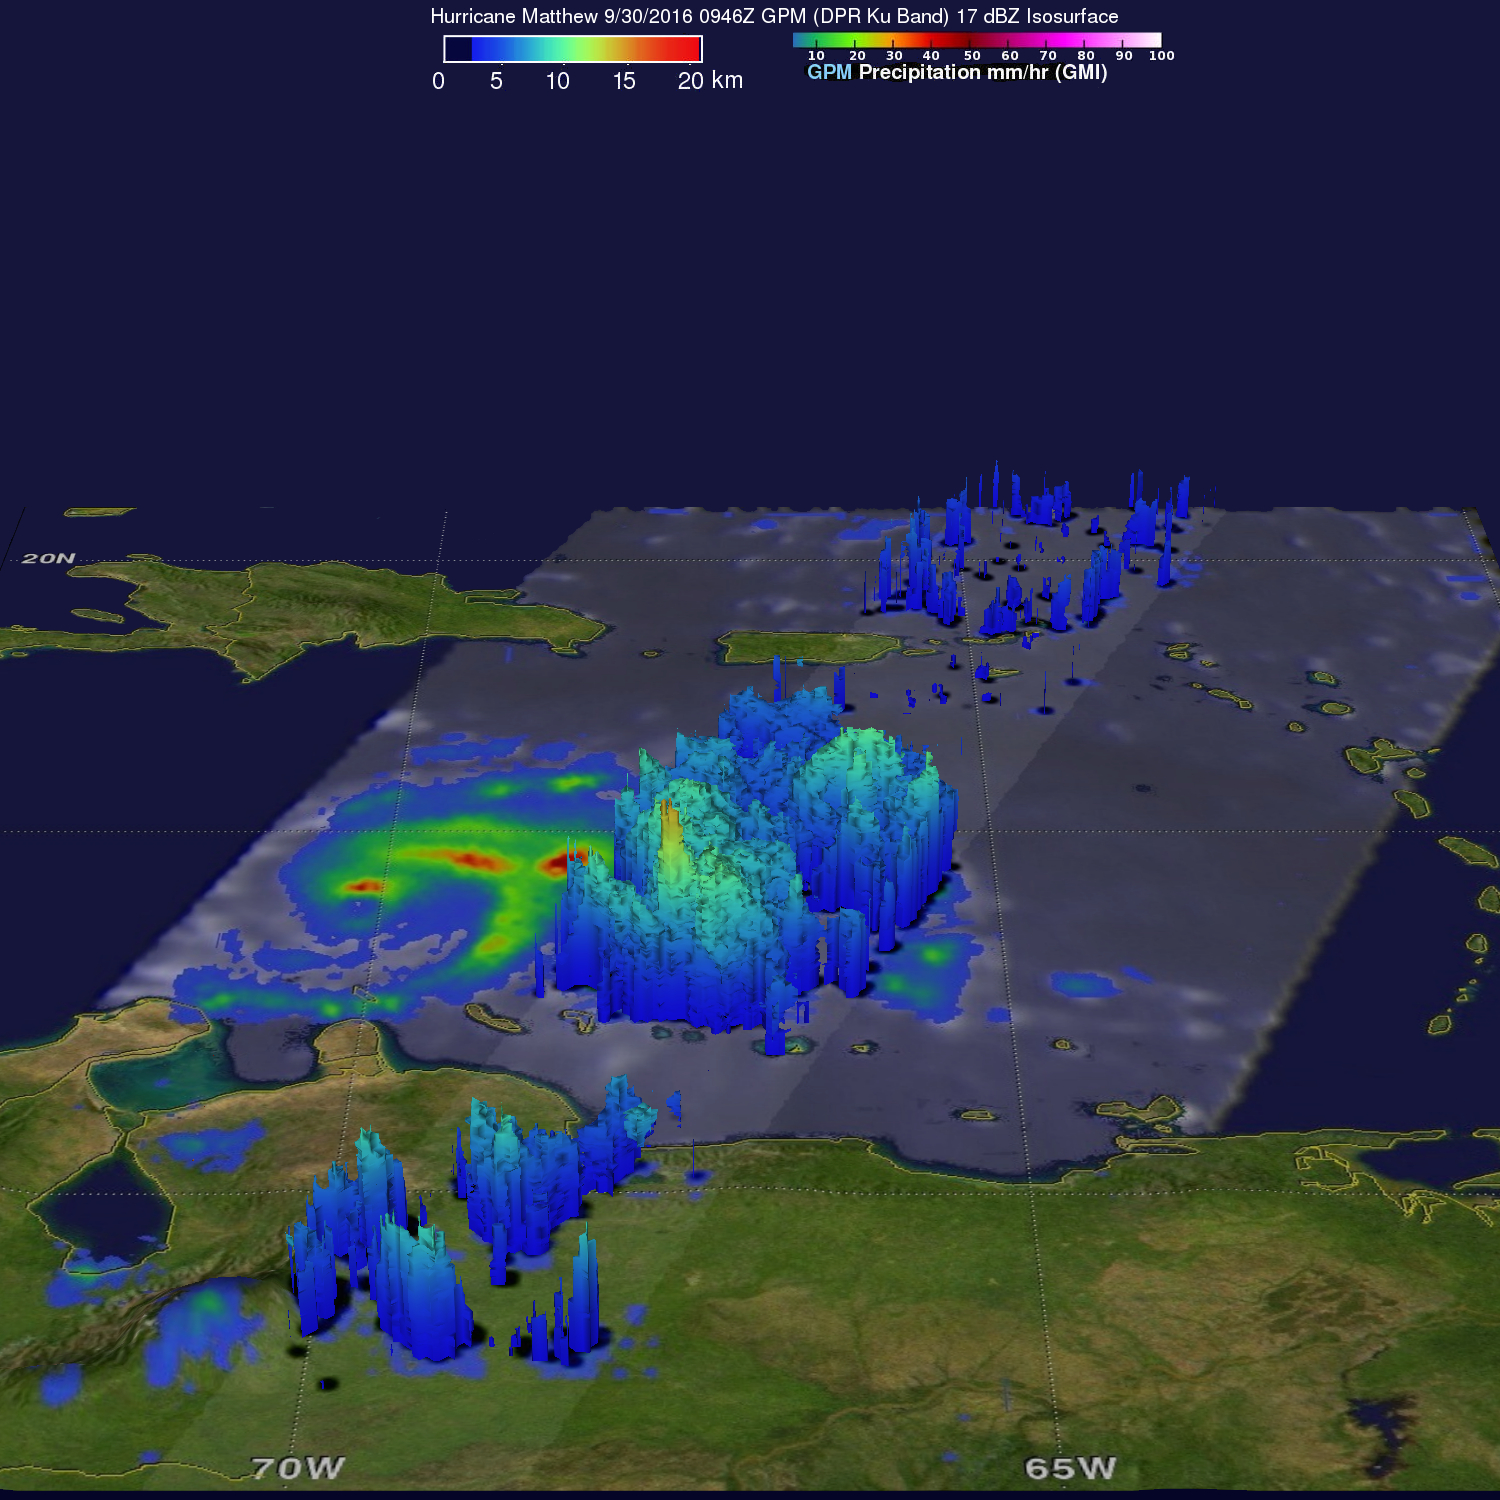
The GPM core observatory satellite flew over Hurricane Matthew on Sept. 30, 2016 at 0946Z (5:46 a.m. EDT). A rainfall analysis from GPM’s Microwave Imager (GMI) and Dual-Frequency Precipitation Radar (DPR) showed that the Matthew had heavy rainfall in the northern side of the newly formed eye wall. G
GPM’s radar area of coverage included a very intense feeder band on the southeastern side of the hurricane. DPR measured rain falling at a rate of greater than 229 (9 inches) per hour in that area. A 3-D radar analysis using data from GPM’s DPR Ku Band showed that storm top heights in the feeder band were reaching heights above 16 km (9.9 miles).
Images of the storm in 3-D were created at NASA’s Goddard Space Flight Center in Greenbelt, Maryland. GPM is a joint mission between NASA and the Japanese space agency JAXA.
Matthew reached Category 5 hurricane status at 11 p.m. EDT on Sept. 30, and by Oct. 1 at 5 a.m. EDT, dropped to a Category 4 hurricane on the Saffir-Simpson Wind Scale. Major hurricanes are Category 3, 4, and 5.
At 11 a.m. EDT on Saturday, Oct. 1, Matthew remained a Category 4, major hurricane as it moved through the Caribbean Sea. A Hurricane Watch is in effect for Jamaica, Haiti from the southern border with the Dominican Republic to Le Mole St. Nicholas.
At 11 a.m. EDT (1500 UTC) on Oct. 1, NOAA’s National Hurricane Center (NHC) said the eye of Hurricane Matthew was located near latitude 13.4 North, longitude 73.4 West. Matthew was moving toward the west near 6 mph (9 kph). A turn toward the west-northwest is forecast later today, followed by a turn toward the north-northwest on Sunday and toward the north on Monday, Oct.3.
On the forecast track, the center of Matthew will move across the central Caribbean Sea today and Sunday, and approach Jamaica and southwestern Haiti Sunday night and Monday.
Data from an Air Force Reserve Hurricane Hunter aircraft indicate that maximum sustained winds are near 145 mph (230 kph) with higher gusts. Matthew is a category 4 hurricane on the Saffir-Simpson Hurricane Wind Scale. Some fluctuations in intensity are possible this weekend, but Matthew is expected to remain a powerful hurricane through Monday. The latest minimum central pressure measured by the aircraft was 947 millibars.
The National Hurricane Center noted the effects expected by Matthew:
Rainfall totals of 2 to 4 inches with isolated higher amounts are expected over Aruba, Bonaire and Curacao through Saturday. Rainfall totals of 2 to 4 inches with isolated higher amounts are expected along the coast of Colombia from the Venezuelan border to Barranquilla. Rainfall totals of 1 to 3 inches with isolated higher amounts are expected along the coast of Venezuela from Coro to the Colombian border.
Rainfall totals of 10 to 15 inches with isolated maximum amounts of 25 inches are expected across Jamaica and southern and southwestern Haiti. This rainfall could produce life-threatening flash floods and mud slides.
SURF: Swells generated by Matthew are expected to affect portions of the coasts of Puerto Rico, Hispaniola, Jamaica, Aruba, Bonaire, Curacao, Venezuela, Colombia, eastern Cuba, and the Caribbean coastline of Central America during the next few days. These swells are likely to cause life-threatening surf and rip current conditions.
For updated forecasts, please visit: www.nhc.noaa.gov
Rob Gutro / Hal Pierce
NASA’s Goddard Space Flight Center
Sept. 30, 2016, update #2 – Matthew Becomes Major Hurricane in Caribbean
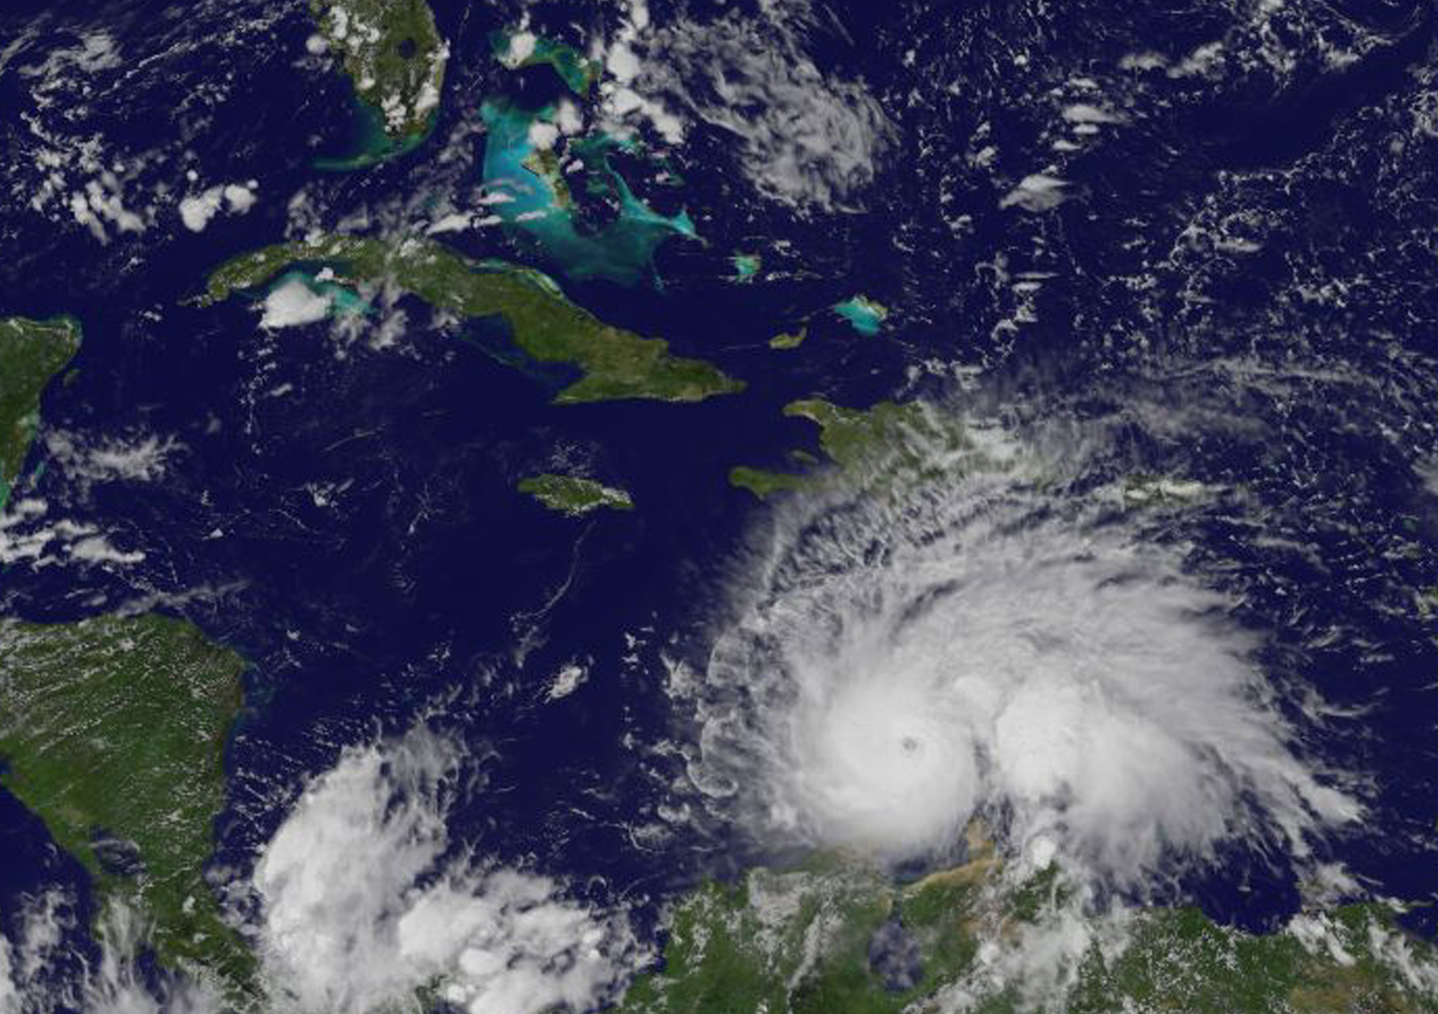
NOAA’s GOES-East satellite captured a visible-light image of Hurricane Matthew on Sept. 30 at 1:45 p.m. EDT as it was strengthening into a major hurricane.
At NASA’s Goddard Space Flight Center in Greenbelt, Maryland, the NASA/NOAA GOES Project used data from NOAA’s GOES-East satellite to create an image of the Caribbean Sea’s major hurricane. The eye was visible in satellite imagery.
At 2 p.m. EDT a tropical storm warning is in effect for the Colombia-Venezuela border to Riohacha.
Data from a NOAA Hurricane Hunter aircraft indicate that maximum sustained winds have increased to near 120 mph (195 kph) with higher gusts. Matthew is a category 3 hurricane on the Saffir-Simpson Hurricane Wind Scale. Little change in strength is forecast during the next 48 hours.
The eye of Hurricane Matthew was located near 13.6 degrees north latitude and 71.3 degrees west longitude. Matthew is moving toward the west-southwest near 12 mph (19 kph). A westward motion at a slower forward speed is expected later today and tonight. A turn toward the west-northwest is forecast by Saturday night, followed by a turn toward the northwest by early Sunday. On the forecast track, the center of Matthew will pass north of the Guajira Peninsula this afternoon and tonight and remain over the central Caribbean Sea through early Sunday.
For forecast updates, visit: www.nhc.noaa.gov.
By Rob Gutro
NASA’s Goddard Space Flight Center, Greenbelt, Md.
Sept. 30, 2016, update 1 – Matthew Becomes a Hurricane in Caribbean
Tropical Storm Matthew moved into the Caribbean Sea and became a hurricane as NASA and NOAA satellites provided imagery and information about the intensifying storm.
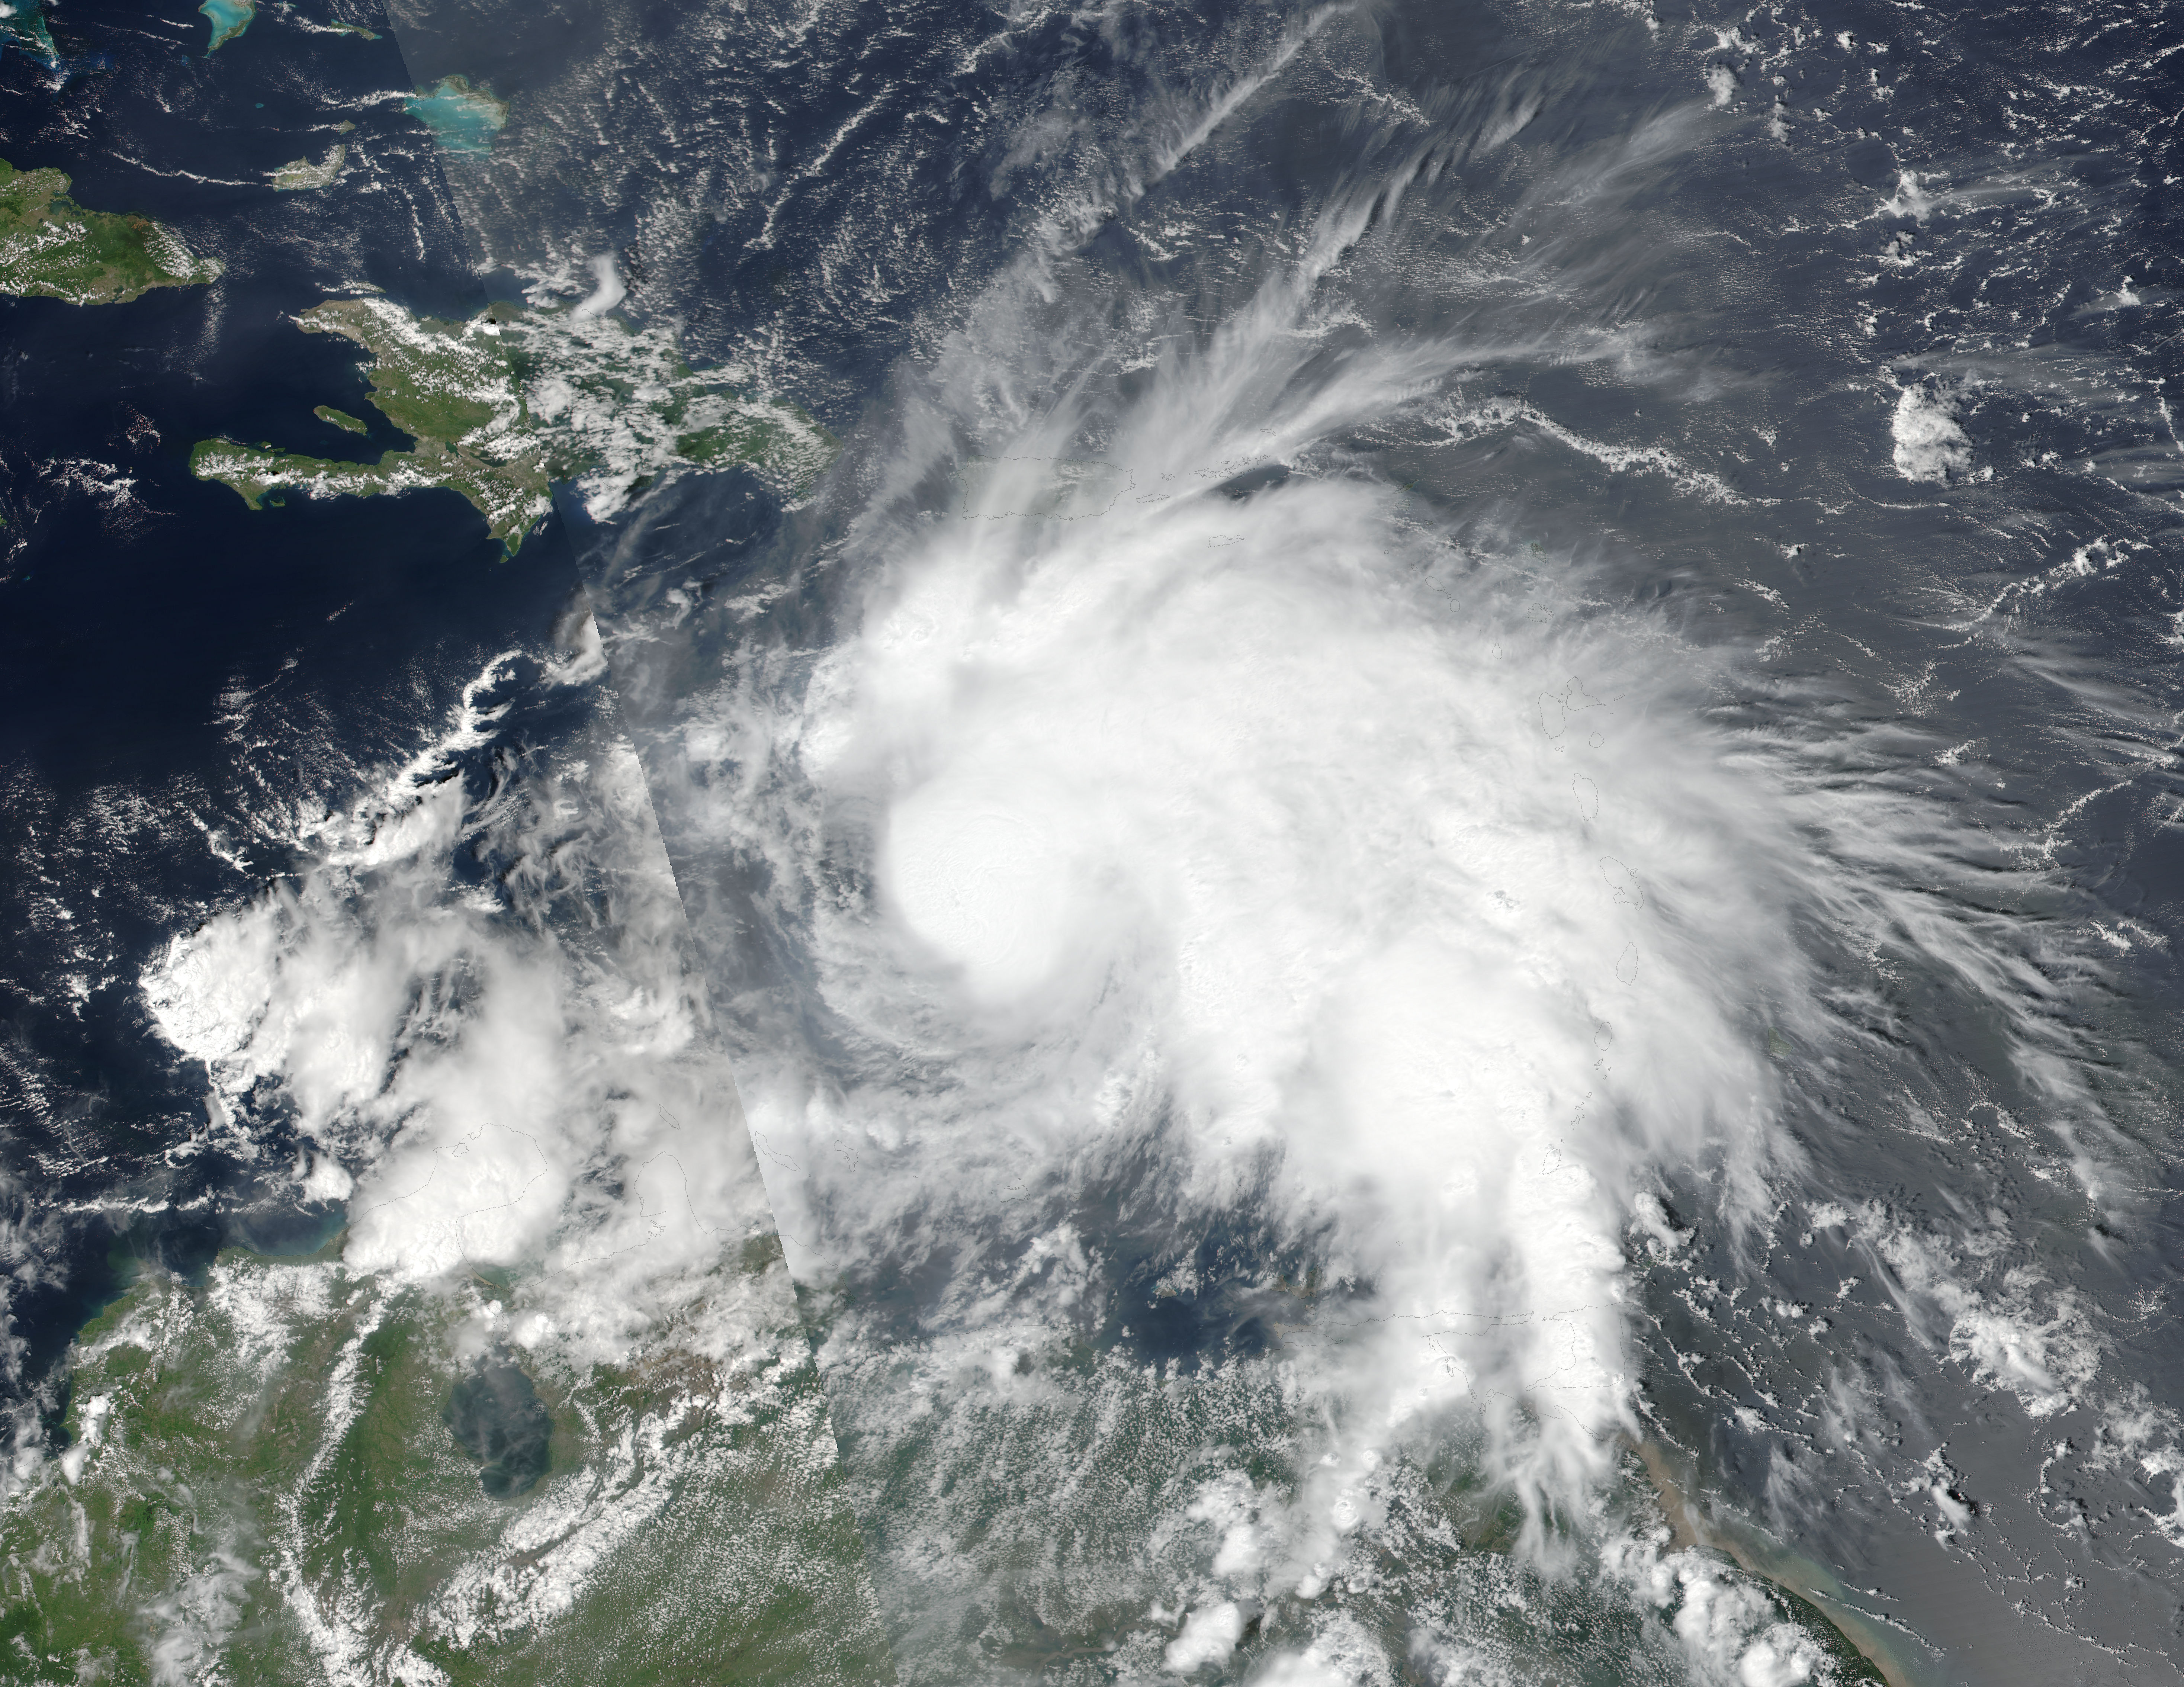
On Sept. 29 at 1 p.m. EDT (17:00 UTC) the Visible Infrared Imaging Radiometer Suite (VIIRS) instrument aboard the NASA-NOAA Suomi NPP satellite captured a visible image of Tropical Storm Matthew south of Puerto Rico, and moving west in the Caribbean Sea.
On Sept. 30 at 8 a.m. EDT, NOAA’s National Hurricane Center (NHC) noted that a tropical storm watch was in effect for Aruba and the Colombia/Venezuela border to Riohacha. A tropical storm watch means that tropical storm conditions are possible within the watch area, in this case within the next 24 to 36 hours.
At NASA’s Goddard Space Flight Center in Greenbelt, Maryland, the NASA/NOAA GOES Project combined infrared and visible imagery from NOAA’s GOES-East satellite into an animation of Matthew. The animation of imagery from Sept. 27 to Sept. 30 shows Tropical Storm Matthew move into the Caribbean Sea, where it became a hurricane.
Credits: NASA/NOAA GOES Project
At 8 a.m. EDT (1200 UTC) on Sept. 30 the center of Hurricane Matthew was located by an Air Force Reserve Hurricane Hunter aircraft near 13.8 degrees north latitude and 70.3 degrees west longitude. That’s about 130 miles (210 km) northeast of Punta Gallinas, Colombia, and about 520 miles (840 km) east-southeast of Kingston, Jamaica.
Matthew was moving toward the west-southwest near 14 mph (22 kph). NHC said a turn toward the west is expected later today, and this westward motion with a decrease in forward speed are forecast through Saturday. A turn toward the northwest is expected Saturday night or Sunday, Oct. 2. The latest minimum central pressure reported by the aircraft was 971 millibars.
NHC noted that data from the aircraft indicate that maximum sustained winds have increased to near 105 mph (165 km/h) with higher gusts. Additional strengthening is forecast during the next 48 hours, and Matthew could become a major hurricane later today or tonight, Sept. 30.
NHC said interests elsewhere along the coasts of Venezuela and Colombia should monitor the progress of Matthew. Interests in Jamaica, Hispaniola, and eastern Cuba should also monitor the progress of Matthew. A hurricane watch may be required for Jamaica later today.
For hurricane effects, visit the NHC website: www.nhc.noaa.gov.
By Rob Gutro
NASA’s Goddard Space Flight Center, Greenbelt, Md.
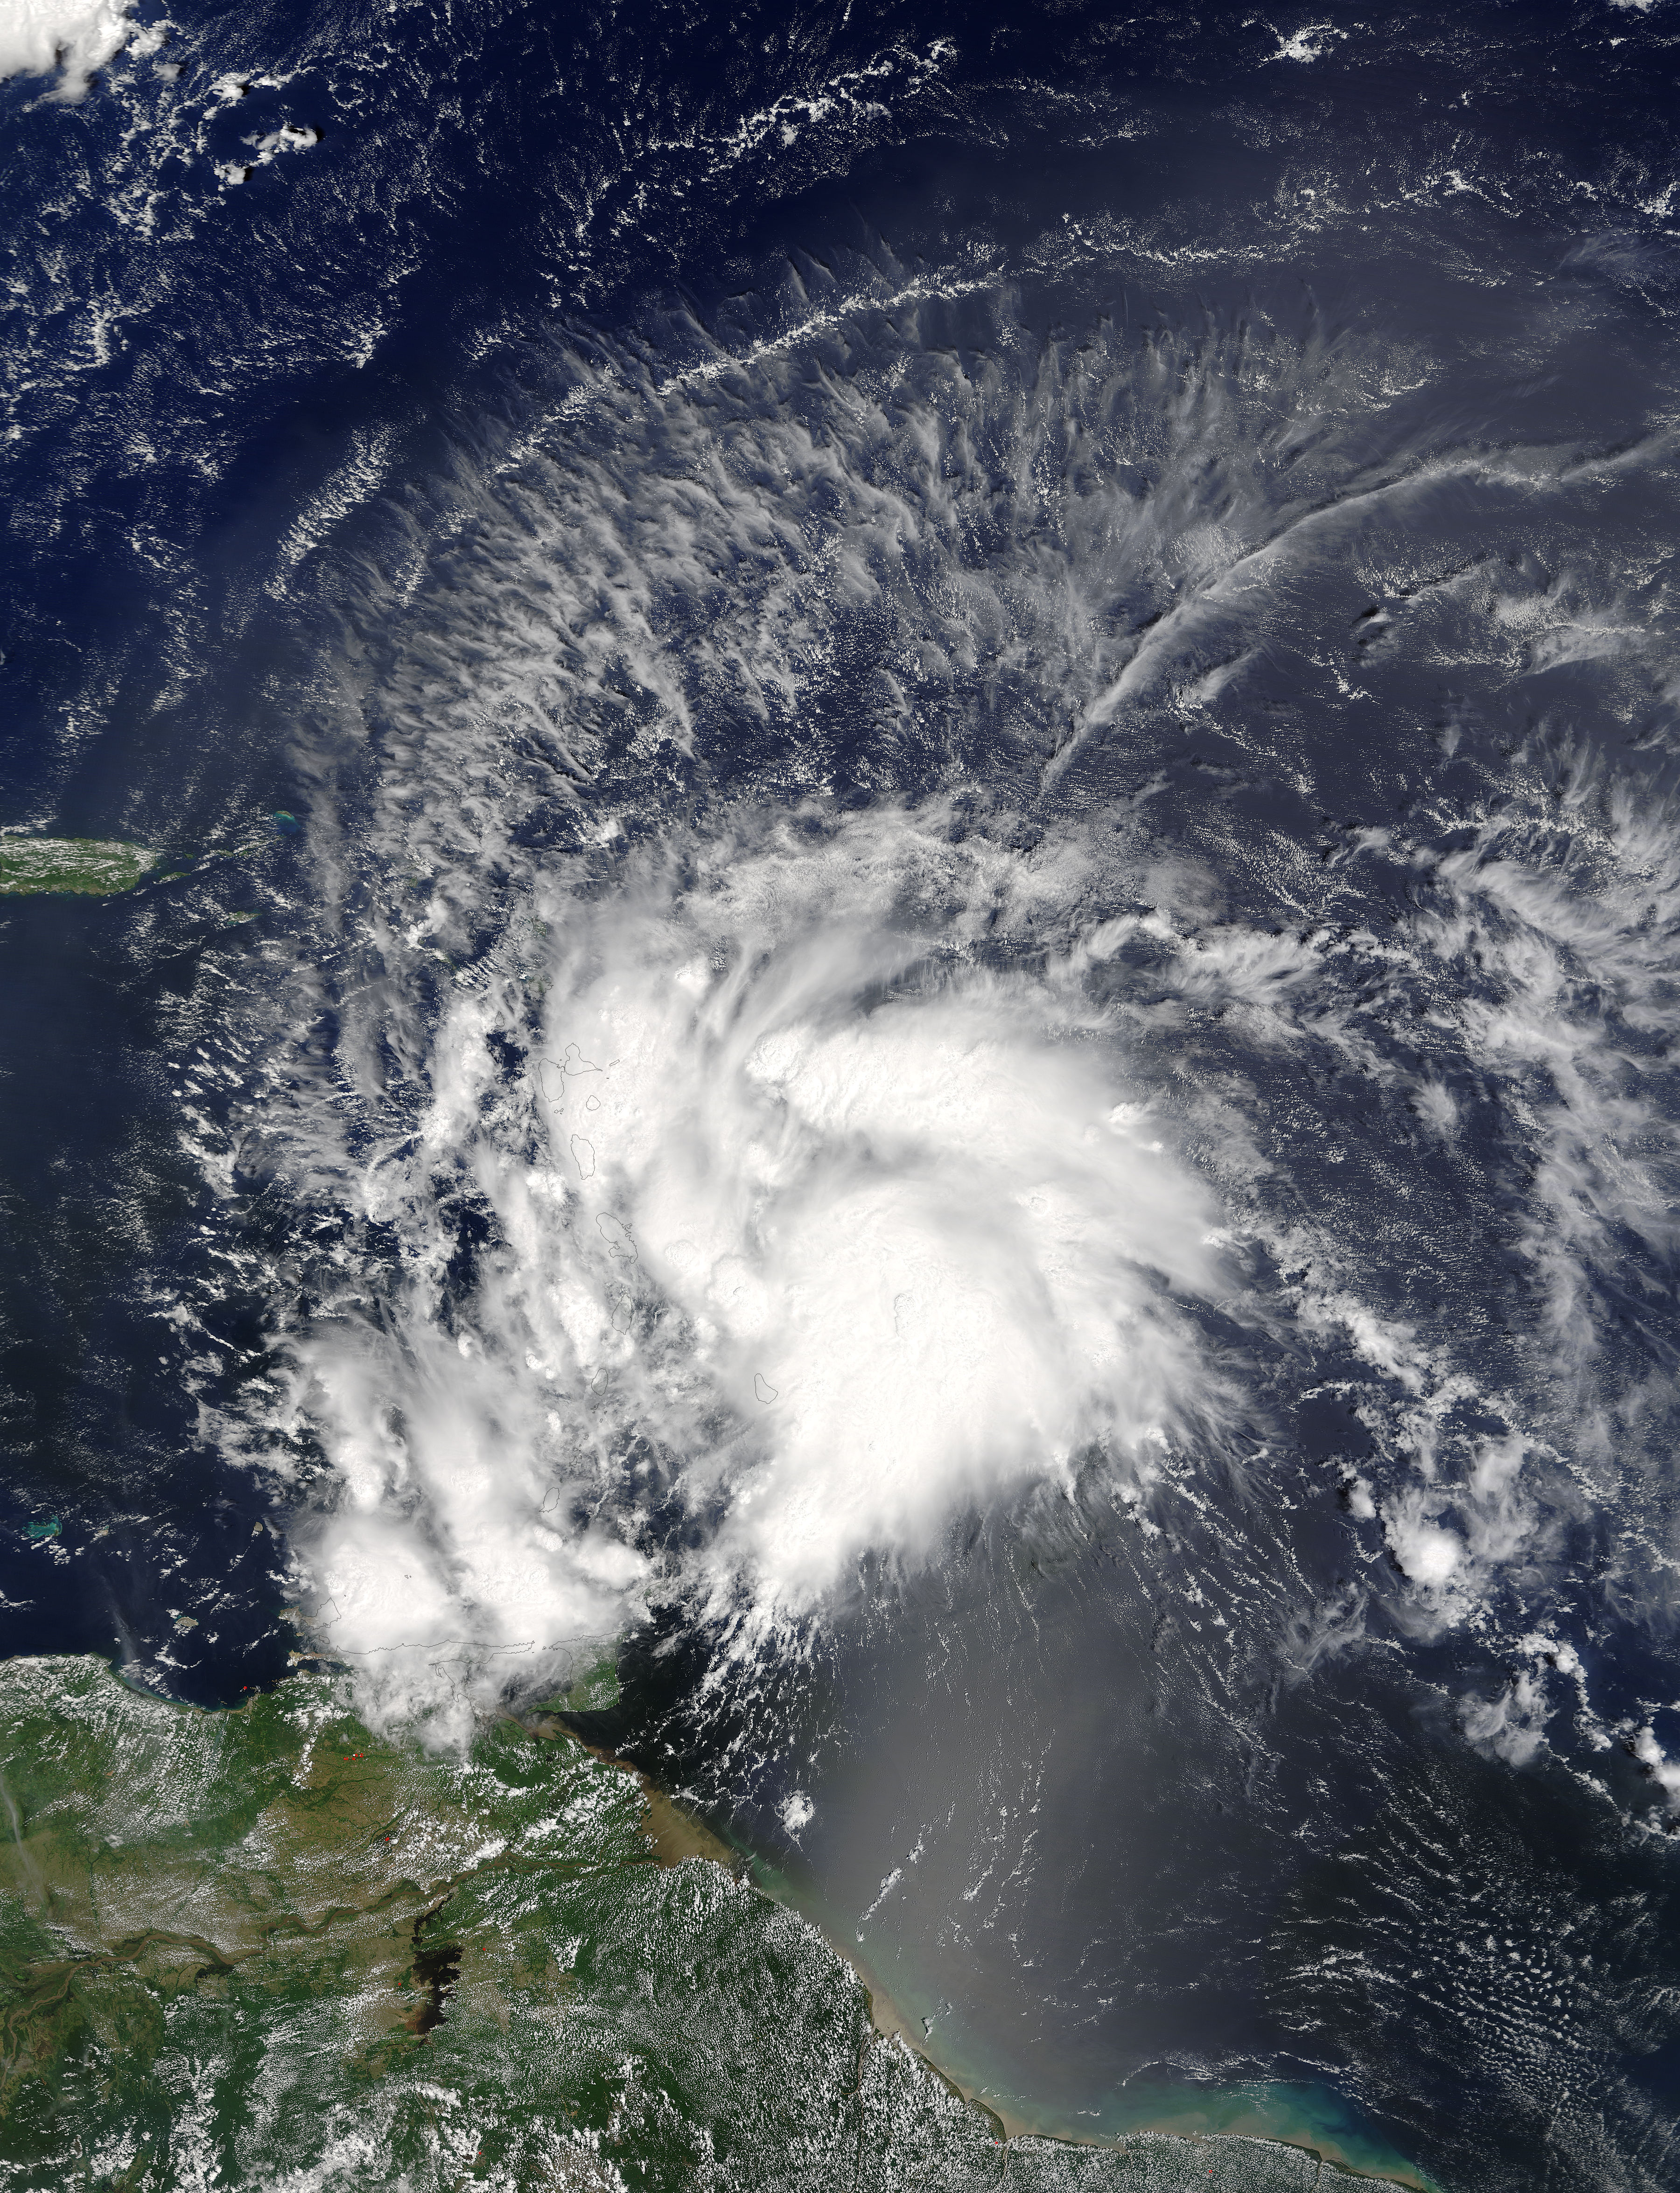
Sept. 29, 2016 – NASA Sees Matthew Moving into the Caribbean Sea
NASA’s Aqua satellite passed over Tropical Storm Matthew as it was moving into the eastern Caribbean Sea.
At 1:25 a.m., EDT (0525 UTC) on Sept. 27, the Moderate Resolution Imaging Spectroradiometer or MODIS instrument aboard NASA’s Aqua satellite captured a visible image of Matthew, when its center of circulation was just east of the Lesser Antilles. Strong thunderstorms surrounded the center and were in a fragmented band north of the center, while clouds associated with the western side of the storm had already entered the Caribbean Sea.
By Sept. 28 at 8 a.m. EDT (1200 UTC) Matthew had moved entirely into the Eastern Caribbean Sea. NOAA’s National Hurricane Center (NHC) posted a Tropical Storm Watch for Bonaire, Curacao, and Aruba. A Tropical Storm Watch means that tropical storm conditions are possible within the watch area.
The Government of Barbados has discontinued the Tropical Storm Warning for St. Vincent and the Grenadine Islands.
At that time, the center of Tropical Storm Matthew was located about 300 miles (480 km) south of San Juan, Puerto Rico. Matthew’s center was located near 14.1 degrees north latitude and 65.5 degrees west longitude.
Matthew is moving toward the west near 16 mph (26 kph), and the NHC expects a general westward motion with some decrease in forward speed during the next couple of days. On the forecast track, the center of Matthew is forecast to pass to the north of Aruba, Bonaire, and Curacao through Friday, Sept. 30.
Reports from an Air Force Reserve Hurricane Hunter aircraft indicate that the maximum sustained winds are near 70 mph (110 kph) with higher gusts. Gradual strengthening is forecast during the next 48 hours, and Matthew is forecast to become a hurricane later on Thursday, Sept. 29.
NHC forecaster Daniel Brown noted in the 8 a.m. EDT Discussion that “Tropical storm conditions are possible in Bonaire, Curacao, and Aruba beginning late today (Sept. 29).”
For updated forecasts, visit the NHC web page: www.nhc.noaa.gov
Rob Gutro
NASA’s Goddard Space Flight Center
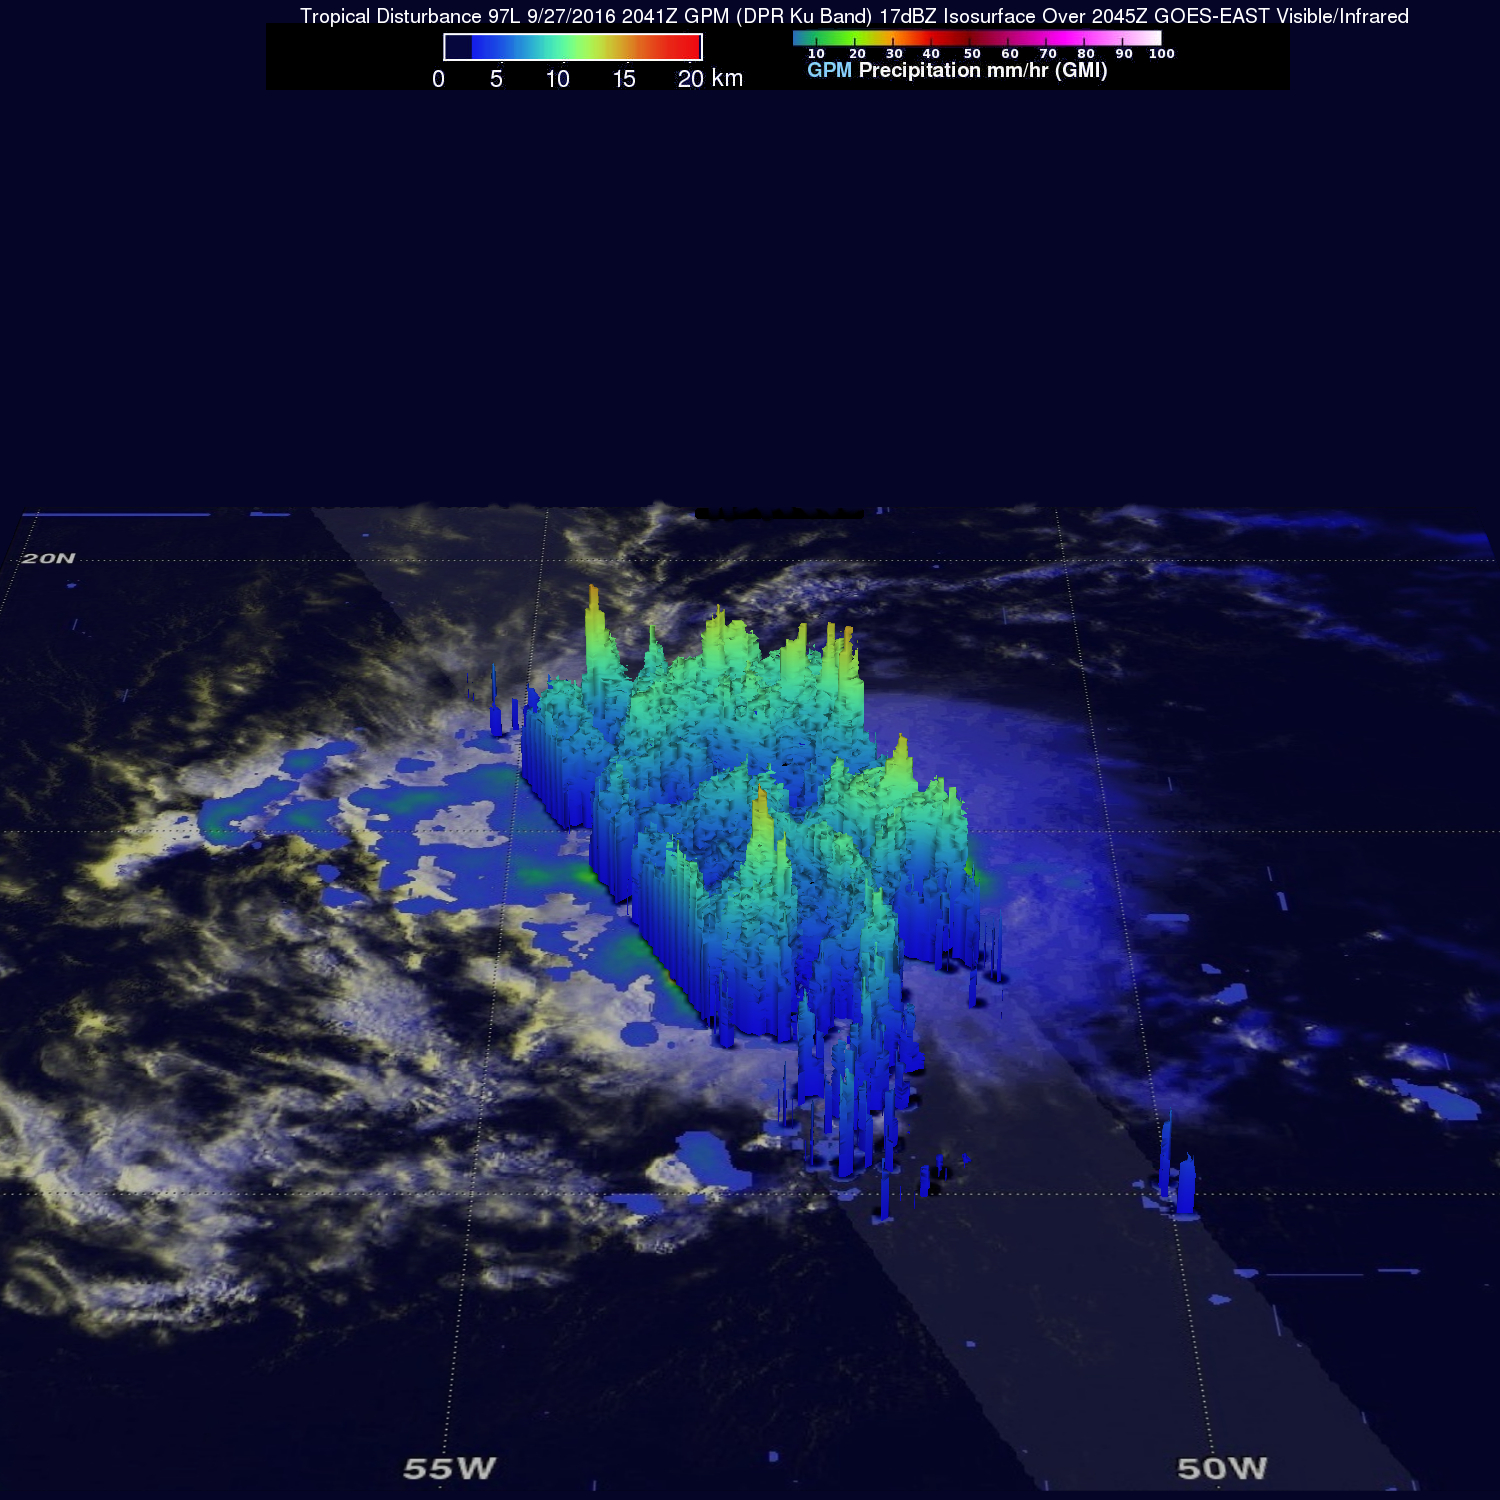
Sept. 28, 2016 – NASA Sees Tropical Storm Matthew Form over the Windward Isles
A fairly strong tropical wave that had been making its way westward across the Central Atlantic over the past several days has now finally organized itself into a tropical storm, Tropical Storm Matthew, the 13th named storm of the season, while passing through the Windward Islands. The Global Precipitation Measurement mission or GPM core satellite provided a look inside the tropical cyclone as it was developing.
A Tropical Storm Warning is in effect for Guadeloupe and Martinique, St. Lucia, Dominica, Barbados, St. Vincent, and the Grenadine Islands. NOAA’s National Hurricane Center (NHC) said interests in Bonaire, Curacao, Aruba, and elsewhere in the Lesser Antilles should monitor the progress of Matthew.
The storm is poised to intensify as it enters the eastern Caribbean. The tropical wave leading to Matthew’s formation emerged off of the coast of Africa back on the 23rd of September. However, despite having a robust level of convective thunderstorm activity, the wave did not acquire a closed low-level circulation until it reached the Windward Islands as the wave’s convection was dispersed over a relatively broad area, impeding its ability to consolidate a center of circulation.
GPM captured an image of the wave on Sept. 27 at 4:41 p.m. EDT (20:41 UTC) as it was approaching the Windward Isles. The rain rates derived from GPM’s GMI microwave imager (outer swath) and dual-frequency precipitation radar or DPR (inner swath) provided an entire picture of rain rates throughout the storm. At NASA’s Goddard Space Flight Center in Greenbelt, Maryland, that data was overlaid on enhanced visible and infrared data from NOAA’s GOES-East satellite to show rain within the entire storm. GPM is a joint mission between NASA and the Japanese space agency JAXA.
Credits: NASA/JAXA, Hal Pierce
The rain distribution showed that the wave contains a broad area of light rain with several embedded bands of moderate rain containing relatively scattered areas of heavier rain. These bands are distributed throughout the system and show only slight evidence of curvature, which indicates that a well-defined cyclonic circulation is still lacking. A 3-D view of the wave from the DPR showed hot towers, some reaching as high as 9.3 miles (15 km) and though loosely organized into bands, are scattered throughout the wave.
A “hot tower” is a tall cumulonimbus cloud that reaches at least to the top of the troposphere, the lowest layer of the atmosphere. It extends approximately 9 miles/14.5 km high in the tropics. These towers are called “hot” because they rise to such altitude due to the large amount of latent heat. Water vapor releases this latent heat as it condenses into liquid. Those towering thunderstorms have the potential for heavy rain. NASA research shows that a tropical cyclone with a hot tower in its eyewall was twice as likely to intensify within six or more hours, than a cyclone that lacked a hot tower.
These towers are coincident with the areas of heavy rain in the previous image and indicate areas of active deep convection (rising air that condenses and forms the thunderstorms that make up a tropical cyclone) that are releasing heat into the system. However, because they are not concentrated together, the wave was slow to organize into a tropical storm.
The heavy rainfall seen by GPM is expected to affect the Windward Islands. NOAA’s NHC said “Matthew is expected to produce total rainfall accumulations of 4 to 8 inches across the Windward Islands and southern portions of the Leeward Islands through Thursday. These rains may produce life-threatening flash floods and mud slides. Rainfall totals of 1 to 2 inches are expected farther to the north into the northern Leeward Islands, including the United States and British Virgin Islands and Puerto Rico.”
At 2 p.m. EDT (1800 UTC) the center of Tropical Storm Matthew was located near 13.6 degrees north latitude and 61.3 degrees west longitude. Matthew is moving toward the west near 20 mph (31 kph). NHC said that a westward motion with some decrease in forward speed is expected during the next couple of days. On the forecast track, the center of Matthew will move away from the Windward Islands through this evening, and be over the eastern and central Caribbean Sea through Friday, Sept. 30.
Maximum sustained winds are near 60 mph (95 kph) with higher gusts. Gradual strengthening is forecast during the next couple of days, and Matthew could become a hurricane by Friday. Tropical-storm-force winds extend outward up to 205 miles (335 km) primarily to the northeast of the center. Winds of 39 mph (63 kph) were recently reported on Barbados, and a weather station on Martinique recently observed sustained winds of 47 mph (75 kph) with gusts to 60 mph (97 kph). The minimum central pressure estimated from recent reconnaissance data is 1008 millibars.
Over the next few days, the National Hurricane Center is forecasting Matthew to intensify into a hurricane, the fifth of the season, and to continue its westward track into the central Caribbean. After which, the storm is expected to take a more northerly track in the direction of Jamaica.
Stephen Lang / Rob Gutro
NASA’s Goddard Space Flight Center