
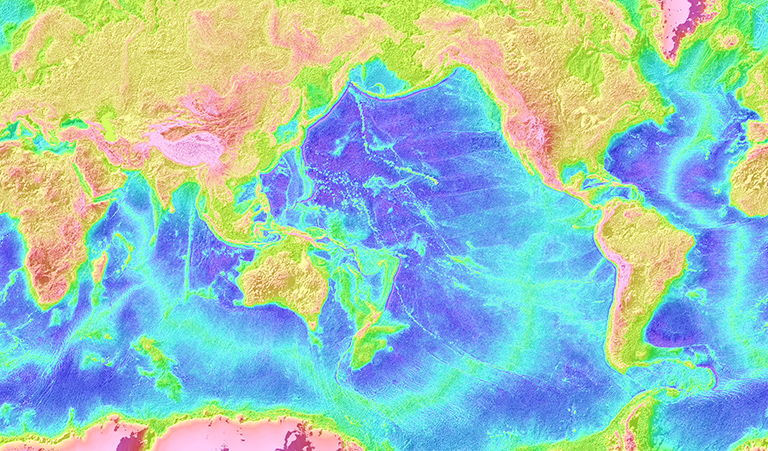


Global Precipitation Measurement mission has produced its first global map of rainfall and snowfall.
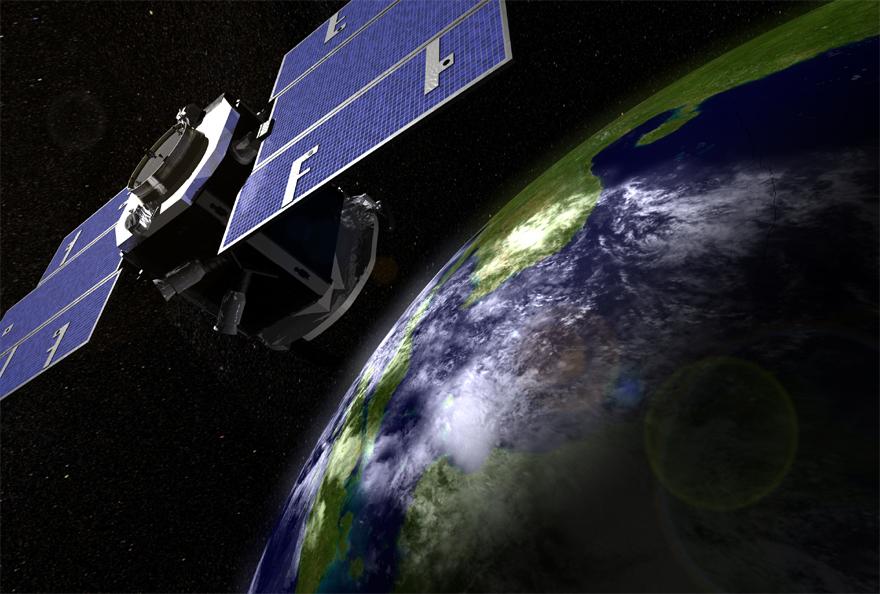
Like a lead violin tuning an orchestra, the GPM Core Observatory – launched one year ago on Feb. 27, 2014, as a collaboration between NASA and the Japan Aerospace Exploration Agency – acts as the standard to unify precipitation measurements from a network of 12 satellites. The result is NASA’s Integrated Multi-satellite Retrievals for GPM data product, called IMERG, which combines all of these data from 12 satellites into a single, seamless map.
The map covers more of the globe than any previous NASA precipitation data set and has repeat coverage every three hours, allowing scientists to see how rain and snow storms move around nearly the entire planet. As scientists work to understand all the elements of Earth’s climate and weather systems, and how they could change in the future, GPM provides a major step forward in providing the scientific community comprehensive and consistent measurements of precipitation.
“With the GPM core observatory acting as an anchor to allow us to cross-calibrate data from a very diverse set of satellite measurements from our international and interagency partners, we can clearly see the big picture in terms of where it’s raining or snowing across the globe,” said Ramesh Kakar, GPM program scientist at NASA Headquarters in Washington.
The GPM mission includes additional satellites from NASA and JAXA, as well as satellites from the U.S. National Oceanic and Atmospheric Administration, U.S. Department of Defense’s Defense Meteorological Satellite Program, European Organisation for the Exploitation of Meteorological Satellites, Indian Space Research Organisation, and France’s Centre National d’Études Spatiales.
This first IMERG data set spans the initial months of GPM data collection from April to September 2014. The precipitation data collected covers the 87 percent of the globe that falls between 60 degrees north and 60 degrees south latitude, updated every half hour.
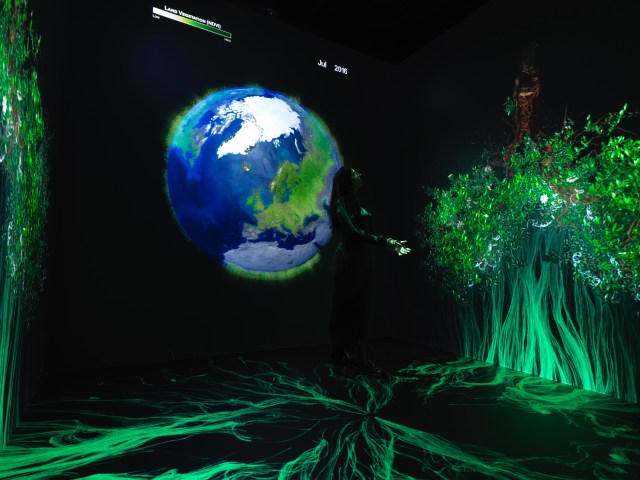
A visualization of the data from this April to September time frame offers a glimpse at what the new data set will provide to scientists.
“What this visualization shows so clearly is that all precipitation is interrelated all around the globe,” said GPM Project Scientist Gail Skofronick-Jackson at NASA’s Goddard Space Flight Center in Greenbelt, Maryland. “What people sometimes don’t realize is how rain over their backyard in the U.S. then goes on to affect the people in Europe once the storms go across the Atlantic.”
Falling rain and snow are essential parts of Earth’s water cycle, which moves water and heat energy around Earth. Near the equator where the sun’s heat drives evaporation that keeps the air moist, rain systems move westward in a steady stream. At higher latitudes, which have not previously been observed in 3-D with high-resolution precipitation sensors, enormous storm fronts march eastward across North America and Europe in the Northern Hemisphere, and across the Southern Ocean that surrounds Antarctica.
For the first time with this near-global map, light rain and snow are being tracked consistently through these high latitudes and across oceans. Measuring falling snow from space has been a difficult challenge because the light icy flakes behave very differently from raindrops, said Skofronick-Jackson. Being able to study it from GPM observations now will go a long way toward improving scientists’ understanding of the physics of snowfall, which in turn may improve climate and weather forecast models that don’t currently represent falling snow very well.
“Being able to observe falling snow from satellites is very important for all of society and science too,” Skofronick-Jackson said. “For example, snow is a vital contributor to water resources in many parts of the world, including the western United States. Snow packs that accumulate over the winter melt during the spring to supply water for drinking and agriculture.”
GPM’s global precipitation maps expand upon and continue the precipitation data record collected by its predecessor, the Tropical Rainfall Measuring Mission, which was launched in 1997.
Continuing this decades-long record of precipitation data is important for understanding Earth’s changing climate. According to the United Nations Intergovernmental Panel on Climate Change Fifth Assessment Report, how precipitation patterns will change in the future is still largely uncertain. Rain and snowfall data collected now will contribute to climate models that provide the long-term outlook.
Data like that provided in IMERG will also inform short-term weather forecast models. Because of its global coverage, satellite data are sometimes the only precipitation data available in parts of the world that do not have ground radar, including remote locations and over the oceans. Currently in development are an IMERG data set that will be produced and made available in near-real time, four hours after observations, and an IMERG data set that is fully global.
“We get data requests from all over the world,” said GPM Deputy Project Scientist George Huffman, who leads the IMERG team at Goddard. “People living in India are trying to understand the monsoon and what it means for the risk of landslides and flooding. People in Africa are working with famine relief programs that need rainfall data to forecast the growing season. Even here in the United States where we have a good weather radar network system, we need satellite data over the oceans to see what’s coming.”
The IMERG precipitation data as well as the entire catalogue of GPM data are freely available to registered users from Goddard’s Precipitation Processing System.
Related Links
- NASA press release: “New NASA Earth Science Missions Expand View of Our Home Planet” (Feb. 26, 2015)
- Access the precipitation data
- NASA’s GPM website
- NASA’s “Earth Right Now” website
Rani Gran
NASA’s Goddard Space Flight Center, Greenbelt, Maryland
301-286-2483
rani.c.gran@nasa.gov
Ellen Gray
NASA’s Goddard Space Flight Center, Greenbelt, Maryland
301-286-1950
ellent.t.gray@nasa.gov