


Download related briefing material from Dec. 10’s press conference at the 2019 American Geophysical Union meeting.
In a Dec. 10 press event at the fall meeting of the American Geophysical Union in San Francisco, three scientists presented new images of the ionosphere, the dynamic region where Earth’s atmosphere meets space. Home to astronauts and everyday technology like radio and GPS, the ionosphere constantly responds to changes from space above and Earth below.
The collection of images presented include the first images from NASA’s ICON, new science results from NASA’s GOLD, and observations of a fleeting, never-before-studied aurora. Together, they bring color to invisible processes that have widespread implications for the part of space that is closest to home.
Earth’s ionosphere stretches from 50 to 400 miles above the ground and overlaps the top of the atmosphere and the very beginning of space. Radiation from the Sun cooks a small portion of gases in the upper atmosphere until they lose an electron or two. The result: a sea of electrically charged particles intermingled with the neutral upper atmosphere.
Besides energy streaming in from the Sun and near-Earth space, the ionosphere also responds to weather patterns that ripple up from the lower atmosphere below. These changes — which can impact astronauts and key communications systems — are complex and unpredictable. A range of specialized instruments is key to studying and understanding them.
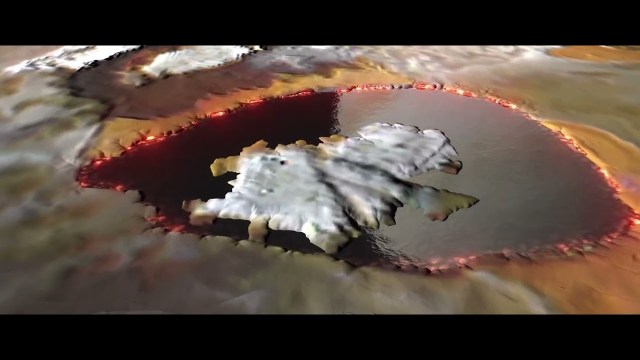
Auroral seashell in the sky
The most dramatic changes in the ionosphere are visible with our own eyes, when auroras dance over the poles. Often, the vivid light displays result from intense solar eruptions that send energy surging into the ionosphere. But Jennifer Briggs, a physics student at Pepperdine University in Malibu, California, found an unusual, twisting aurora that appeared during quiet solar conditions.
By studying auroras, scientists can probe what’s happening in the ionosphere, and even farther out into the magnetosphere, the magnetic bubble surrounding Earth that is created by our planet’s magnetic field.
During an internship at NASA’s Goddard Space Flight Center in Greenbelt, Maryland, Briggs stumbled upon the aurora in images from ground-based, all-sky cameras located in Svalbard, Norway, near the Arctic Circle. The short-lived aurora had an unusual spiral that caught her attention; it made Briggs think of a seashell. Its twisting motions indicated the magnetosphere had experienced a significant disturbance. Indeed, data from NASA’s Magnetospheric Multiscale mission, or MMS, showed a dramatic compression of the magnetosphere.
That meant something had pummeled the magnetosphere, pushing its outer boundary — the magnetopause — toward Earth. In just 1 minute and 45 seconds, the magnetopause retreated a distance that would take a commercial jet 27 hours to fly across. While such a disturbance hasn’t been documented before, scientists expect they would be associated with the most intense solar eruptions. But Briggs checked the Sun for activity, and no such eruptions preceded the aurora.
Using multiple sets of observations — from the all-sky cameras, MMS and radars on the ground — Briggs and her collaborators determined the disruption was very different from those that impact our power or communications systems. “You can imagine someone punching Earth’s magnetic field,” Briggs said. “There was a massive, but localized compression.”
Rather than a solar eruption, the researchers think the aurora originated from the foreshock. That’s the turbulent region just outside the magnetosphere where Earth’s magnetic field deflects incoming high-energy particles from the Sun. This is the first time scientists have documented such an intense storm from the foreshock.
“There’s no way we can have satellites everywhere between the Sun and Earth,” Briggs said. In this case, the spiraling aurora caught her attention, indicating stormy conditions in the magnetosphere. “The all-sky camera acted like a peephole, allowing us to peer into the state of the magnetic field.” Luckily, the MMS spacecraft were in the right place at the right time to view the compression. But the lack of satellites around MMS made it impossible to understand the event without data from the ground.
New GOLD results
While all-sky cameras provide views of the ionosphere from the ground, GOLD surveys the region from geostationary orbit, 22,000 miles above Earth. GOLD Principal Investigator Richard Eastes, from the University of Colorado, Boulder, presented new results from the mission: observations that show the region is far more variable than scientists ever expected.
Short for Global-scale Observations of the Limb and Disk, GOLD is an instrument that images the ionosphere in far ultraviolet light. This particular wavelength of light is invisible to our eyes, but useful for tracking changes in the ionosphere’s temperature, density and composition.
Since GOLD can see the entire Western Hemisphere at once, it can observe ionospheric changes and patterns across the globe. In the past year, GOLD has helped scientists pin down how the ionosphere responds to geomagnetic storms: Atomic oxygen increases at low latitudes and decreases at high latitudes, while molecular nitrogen does the opposite.
Credits: NASA’s Scientific Visualization Studio/GOLD/Thomas Bridgman/Saurav Aryal
Download this video in HD formats from NASA Goddard’s Scientific Visualization Studio
GOLD’s unique vantage point also enabled observations of the July 2 total solar eclipse in South America. In typical day-night cycles, the pool of electrically charged atmospheric gases waxes and wanes with the Sun. During the day, the ionosphere is dense. At night, when the Sun is no longer energizing the atmosphere, the atmosphere cools. Charged particles gradually recombine. The ionosphere thins. In a total eclipse, the same thing happens over a much shorter amount of time. As the July 2 eclipse crossed over the bottom of South America, scientists were, for the first time, able to watch this thinning evolve across the Southern Hemisphere, from space.
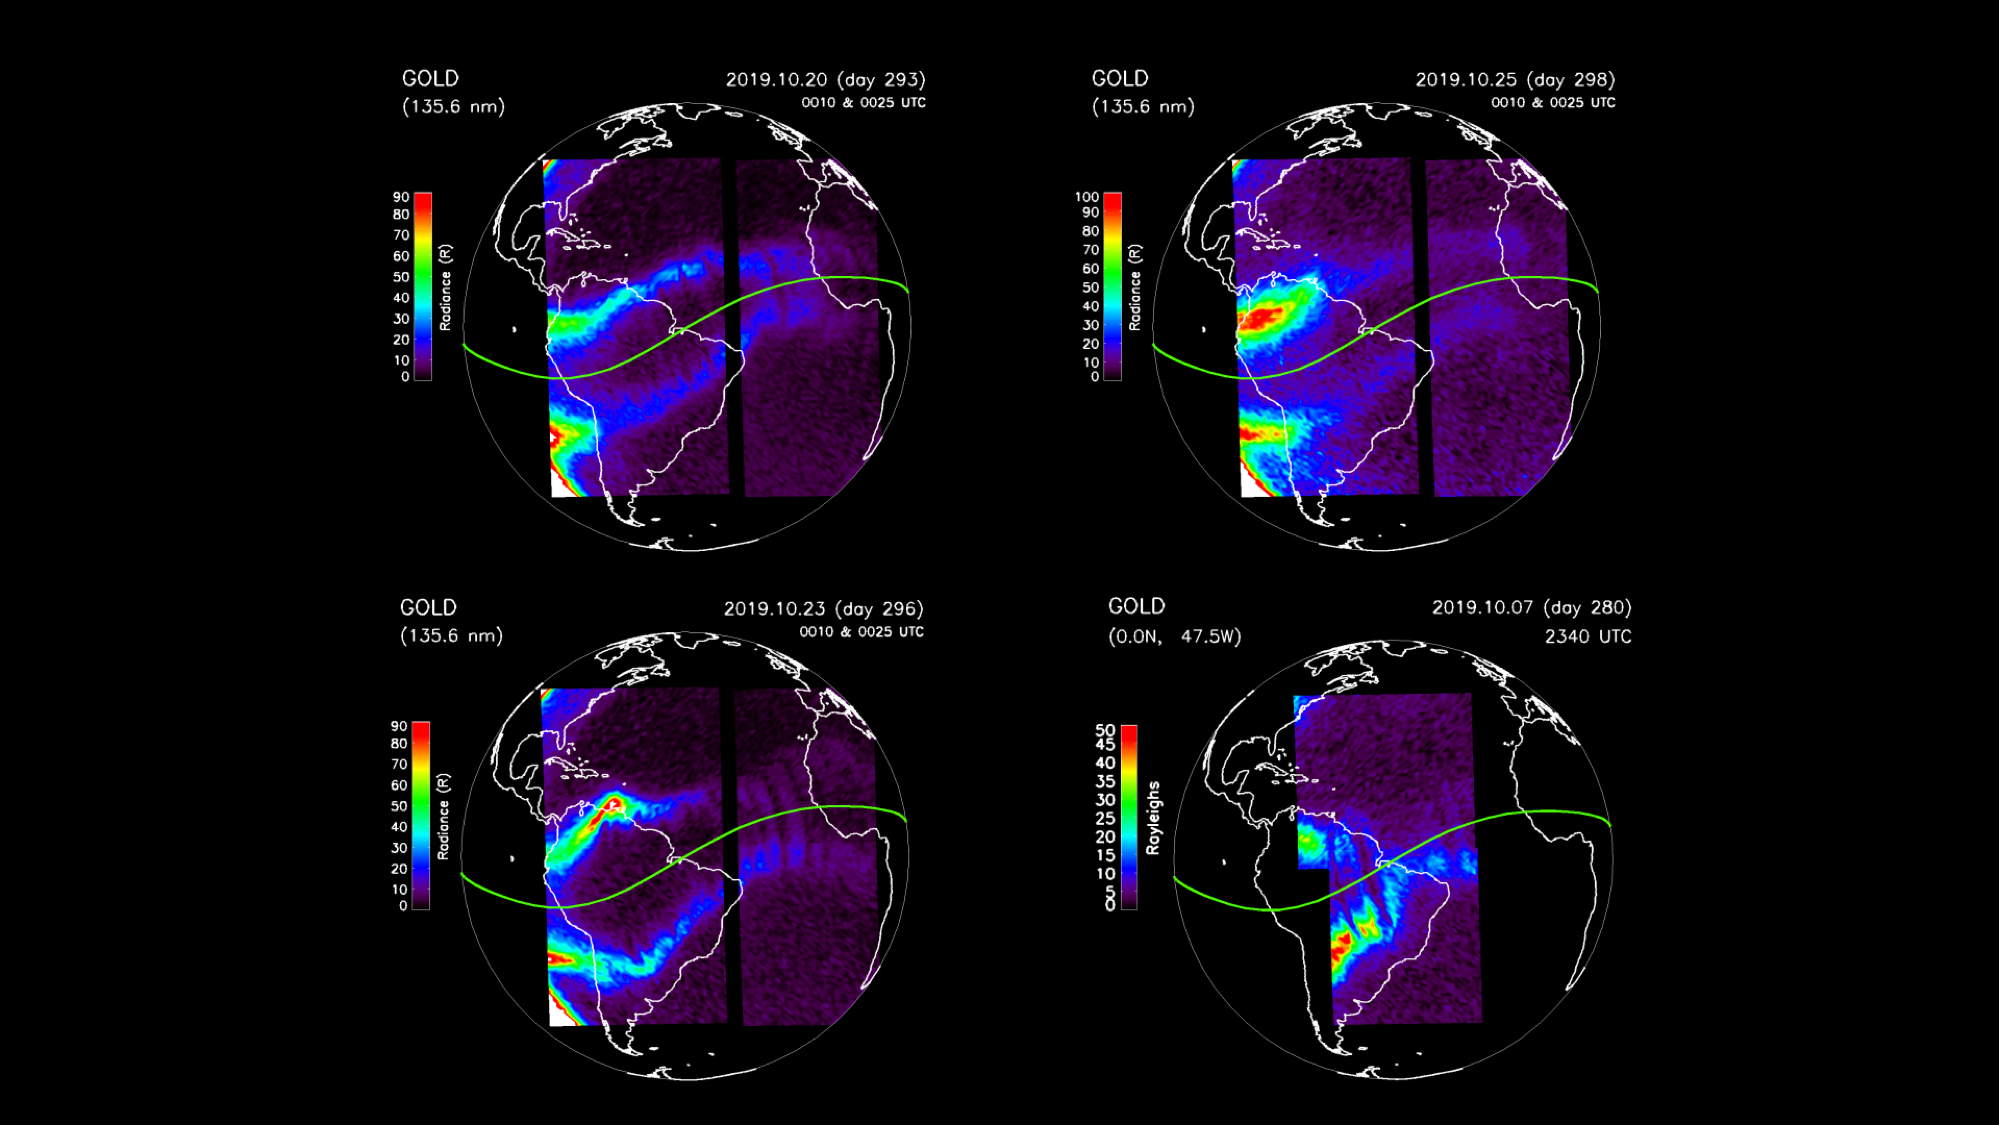
The GOLD scientists were also surprised by how much the nighttime ionosphere varies night to night. The paths that radio frequency waves take, such as those used by GPS, depend on the density of the ionosphere. Sometimes, changes in the density can interfere with these signals.
At night, charged particles tend to settle in crests beside Earth’s magnetic equator. Eastes likened the images to a T-rex’s toothy grin. On one night, the crests are evenly spaced over the equator, as if the T-rex is baring its teeth. The next night, the crests are far apart like the T-rex’s mouth is open wide, and the night after that, in a different position entirely. Why the nighttime ionosphere varies so much is still unclear.
“These were very surprising findings to me, and to the rest of the team who’s been looking at this stuff for many years,” Eastes said. “It’s not something we anticipated at all.”
First light ICON images
ICON — short for Ionospheric Connection Explorer — is well-positioned to investigate the variability GOLD has uncovered.
“We have a mission to explore day-to-day variability just like GOLD is showing,” said Thomas Immel, ICON principal investigator at University of California, Berkeley. “ICON is built to explore this region of space and try to capture all that could be influencing the ionosphere this way.”
The relationship between NASA’s two ionospheric missions could be likened to photography: If GOLD captures landscapes from 22,000 miles above Earth, ICON — at just 360 miles — specializes in detailed close-ups. During certain parts of its orbit, ICON passes through GOLD’s field of view and each mission can get a snapshot of the same region, from their own unique perspectives. This overlap makes it easier to identify what caused a certain change to the upper atmosphere at a given time.
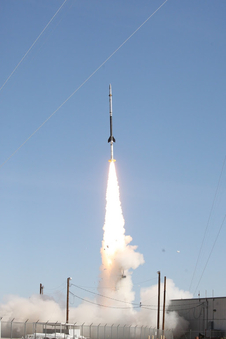
ICON launched on Oct. 10, 2019, and began science mode on Dec. 1. Immel presented the first images the spacecraft took during its commissioning and calibration period, demonstrating the capabilities of ICON’s instruments and presenting a taste of what the scientists hope to observe.
ICON carries three imagers that survey airglow, the natural glow of Earth’s atmosphere caused by solar radiation. Each atmospheric gas has its own favored airglow color depending on the gas, altitude region and excitation process, so scientists can use airglow to study where these gases are and how they behave.
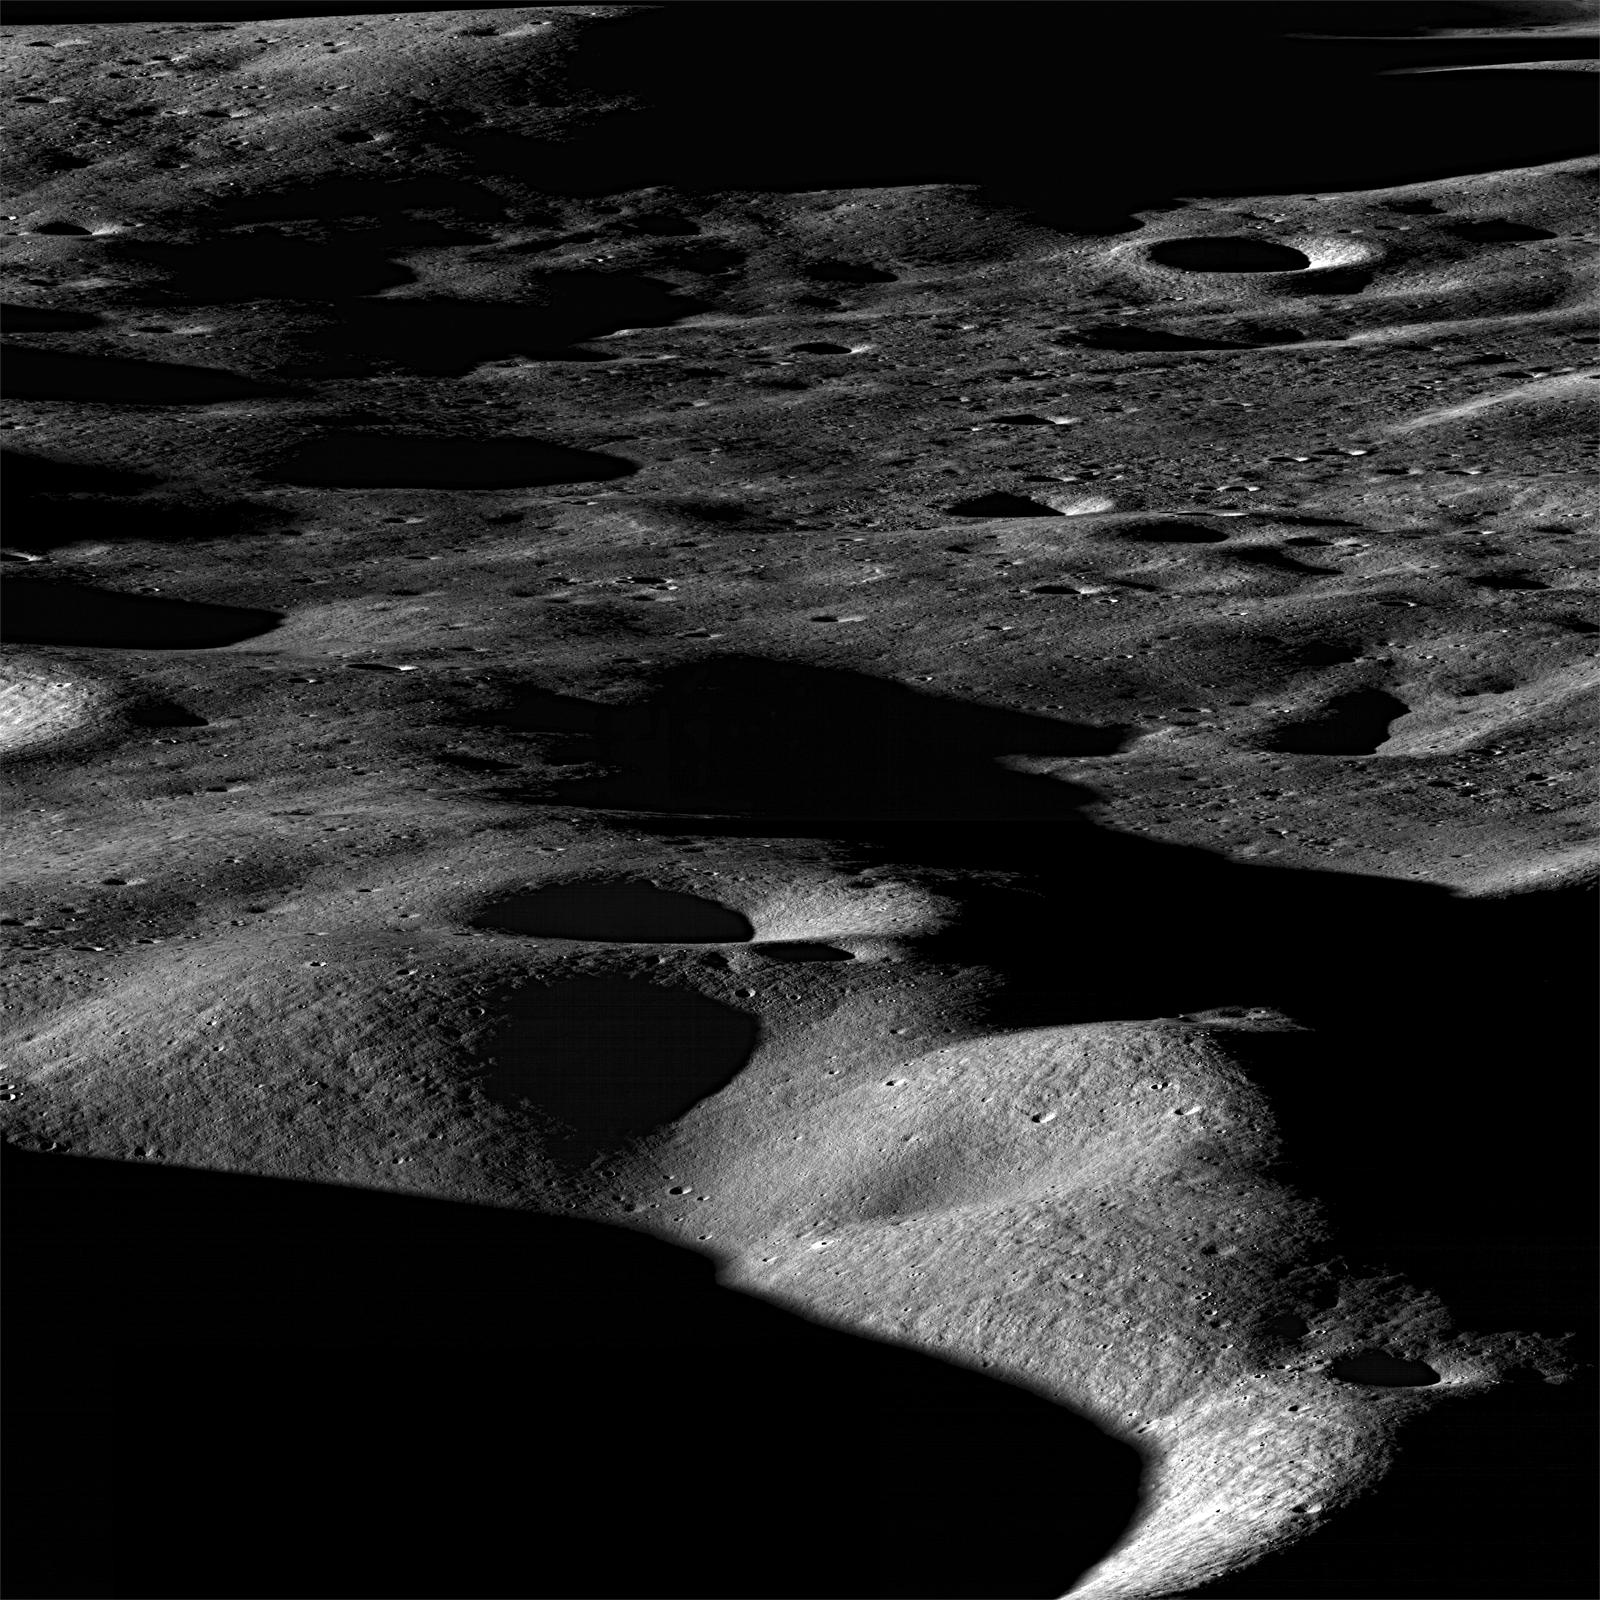
Two instruments view airglow in ultraviolet. The Extreme Ultraviolet Instrument depends upon accurately measuring the light from glowing oxygen in order to track the height and density of the daytime ionosphere. Because the team had never made these measurements in orbit before, they calibrated their instrument on a known source: the Moon.
The Far Ultraviolet Instrument takes images in the same wavelength as GOLD. At night, it measures the density of the ionosphere, and during the day, composition. Immel said the images remind him of the window view from an airplane — 360 miles above the surface and in ultraviolet light.
“The first thing we see is a bit boring, but I’m excited nevertheless,” Immel said. “It’s exactly what you would expect if the instrument were working perfectly.” Now that ICON has undergone its extensive instrument checks, the scientists can begin looking for the ionosphere’s more interesting quirks.

ICON’s last imager is MIGHTI, short for the Michelson Interferometer for Global High-resolution Thermospheric Imaging. MIGHTI tracks red and green oxygen airglow to measure how the neutral atmosphere moves, which scientists think plays a role in the ionosphere’s daily changes. There is a black fringe pattern laid over the MIGHTI images; the magic, Immel said, happens between the lines. By measuring how airglow moves against the black lines, scientists can read the motions, or the winds, of the upper atmosphere.
“With all these different data products, we’re going to make great strides in answering the questions GOLD has raised for us,” Immel said.
Credits: NASA/ICON/Christoph Englert/Joy Ng
Download this video in HD formats from NASA Goddard’s Scientific Visualization Studio
By Lina Tran
NASA’s Goddard Space Flight Center, Greenbelt, Md.