Environmental Data for Spaceflight Experiments
Any and all data regarding the conditions under which an experiment is conducted may have bearing on how the data produced during the experiment are interpreted; these conditions, explicitly documented or not, are a part of the experiment design. Therefore, GeneLab is taking actions, where possible and policies and available resources permit, to collect and publish data on these conditions. We have grouped these conditions into the areas listed below.
Space Radiation Dosimetry
Dosimetry techniques vary depending on the particular experiment environment. To date, most flight experiments have not employed “dedicated” dosimeters (i.e. dosimeters integrated into experiment platform housing). Therefore, doses to which study samples are exposed frequently must be interpolated and/or extrapolated from nearby dosimeters. Two qualities of radiation were considered: low-LET (photons and electrons) and high-LET (charged nuclei). Both passive (thermoluminescent dosimeters: TLD, or plastic nuclear track detectors: PNTD) and active (solid state, tissue equivalent proportional counters) have been used. For passive dosimeters, TLD are sensitive to low-LET charged particles (< 10 keV/μm) and PNTD to high-LET (> 10 keV/μm). Active dosimeters are sensitive to a wider range in LET and, depending on the detector, can provide time resolution, LET spectra and some particle identification. By integrating the dose from the time-resolved data over the duration of the experiment, the total absorbed dose can be calculated. Depending on the configuration of dosimeters in the vicinity of the samples, absorbed dose may be reported as averaged with other detectors, or individually.
Datasets in the GeneLab repository with samples flown in space have corresponding metadata which includes the exposure duration, and the average, minimum and maximum absorbed dose received, broken out into low LET and high LET charged particles (when LET resolution is available). The duration of the exposure is defined as the time a sample was in space and biologically active, i.e. when the sample has returned to Earth or when it is chemically fixed or frozen in space. It is important to note that the absorbed doses we provide in these metadata are an approximation, due to several factors. First, the sensitivity in charge and LET for each detector being used. For example, even though TLDs detect low-LET radiation, the detected dose also includes some contribution from charged nuclei depending on the charge and speed of the nuclei traversing the detector. Similarly, active detectors even if sensitive to specific energies and charges, can still have contributions to dose from low-LET particles and neutrons. Second, reported dosimetry does not take into account the shielding provided by the sample enclosure. For low energy or low-LET particles this material could have effects unique to each mission and experiment, modifying both the dose and radiation quality.
Abbreviations: LET = Linear Energy Transfer, TLD = Thermoluminescent Dosimeters, PNTD = Plastic Nuclear Track Detectors.
STS (Space Shuttle) Radiation Dosimetry
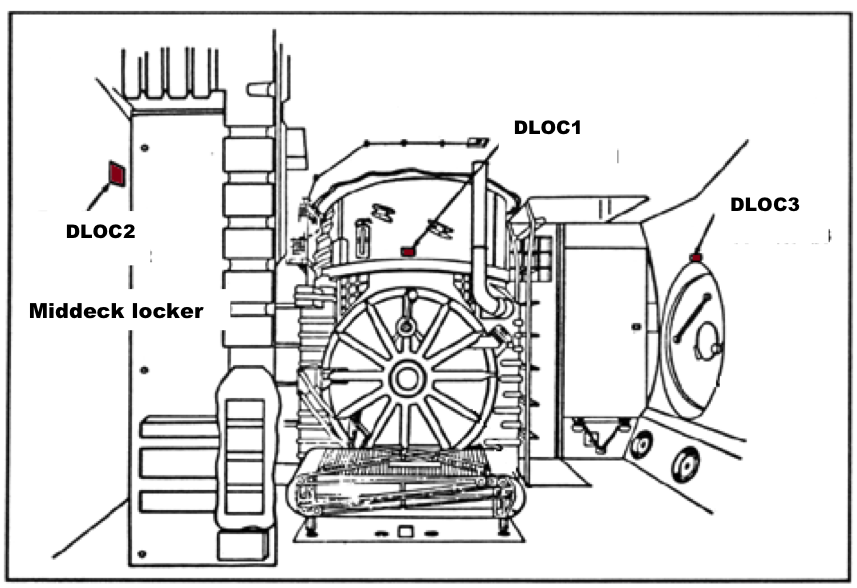
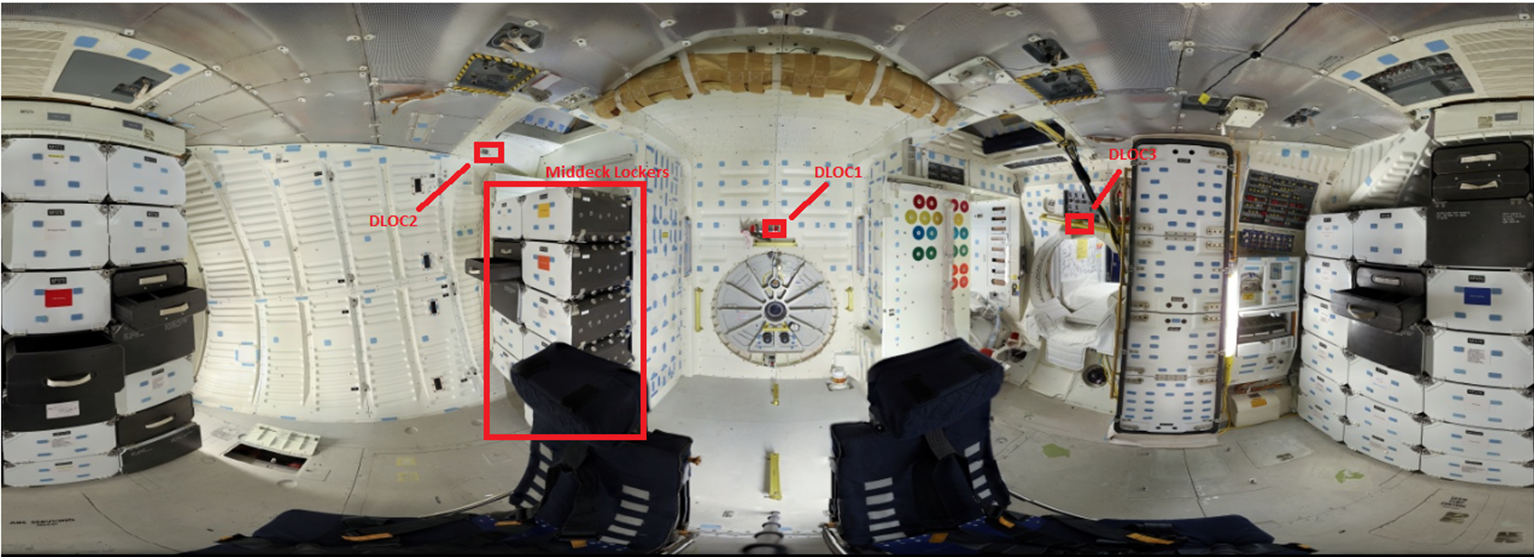
For STS (Space Shuttle) experiments, three passive dosimeter packages were fixed in locations on the shuttle middeck, where biological samples were located.
BION-M1 Radiation Dosimetry
Both passive and active dosimeters were used.
Foton-M4 Radiation Dosimetry
Passive dosimeters were used.
ISS Radiation Dosimetry
Both passive and active dosimeters were used.
Environmental Data Application
The Environmental Data Application provides the capability to visualize telemetry and radiation data collected on the International Space Station and corresponding ground platforms during the Rodent Research missions. Telemetry data includes temperature, relative humidity, and CO2 levels. Radiation data includes galactic cosmic rays, South Atlantic Anomaly, accumulated radiation dose, and total radiation dose. The application allows users to view single missions, compare two missions, and view and download summary or full data tables. So, come check out the new Environmental Data Application now!
RadLab Portal and RadLab Data API
The RadLab Portal provides access to radiation telemetry data from multiple databases maintained by multiple space agencies. The Web interface provides the ability to query, visualize, inspect, and download data; for example, time series plots of readings from multiple radiation detectors, pairwise comparisons of detector readings, and geospatial visualizations of radiation dose and flux registered by the detectors. The demo version of RadLab contains the data obtained from four detectors included in the DORELI project (DOSTEL1, DOSTEL2, Lidal, REM, Italian Space Agency) and the data from three Liulin-5 detectors (Bulgarian Academy of Sciences). All seven detectors are/were located on the International Space Station (ISS). The RadLab Data API enables data selection and retrieval at a programmatic level. Take a moment to explore the RadLab Portal and Data API now!
STS (Space Shuttle) Radiation Dosimetry
Radiation Metadata for GLDS Studies
The downloadable excel file contains information used to calculate the absorbed dose of radiation for STS (“space shuttle”) experiments. The absorbed dose from ionizing radiation received by the specimens (animals, plants, cells) was estimated from data recorded by three passive radiation dosimeter (PRD) packages, designated DLOC1, DLOC2, and DLOC3, in the middeck of the space shuttle, where biological payloads were located. Each package contains a number of TLD-100 thermoluminescent detectors. The TLDs are passive detectors: they integrate dose and must be processed–in the case of TLDs, by heating. (As opposed to active detectors which are powered and can be read out continuously, in real-time.) The detectors are returned post-flight and the data analysed by the Space Radiation Analysis Group at NASA-Johnson Space Center. The reported dose for each PRD is the average over all the TLDs +/- the standard deviation, with appropriate background subtraction and error propagation. Correction for dose accumulated on the ground pre- and post-flight is done by subtracting the dose in identical detectors that remain on the ground, and a calibration factor is applied to convert dose in the TLDs to dose in water.
Radiation Metadata
- Download table: STS_radiation_data_5-5-23.xlsx
- All dates are in Eastern Standard Time (EST)
- Note: Radiation dosimetry data for International Space Station (ISS) experiments is currently being compiled. It will be released at a future date when the compilation is complete.
- Note: High LET GCR contributes about 10% of the dose on ISS (up to 5% for LET>100 keV/μm) so reliance on TLDs for the Shuttle data means values could be under-reported by up to 5%.
- Radiation exposure per experiment/study may be different from total mission radiation exposure. See each linked study record for per-study radiation exposure data.
- Note: The absorbed doses are typically measured with a high degree of precision. However due to confounding factors, in particular the differences in local shielding around the payload and around the instrument, unless otherwise noted the doses to the payload should be considered to be accurate to within ~10%, based on known variations to the radiation dose across ISS modules.
Metadata include:
- mission dates and elapsed mission time in days, launch to touchdown
- sample location during the mission
- dose rate in the PRD that recorded the lowest total dose, defined as the total absorbed dose in the detector (“dose” is synonymous with “absorbed dose in water”)
- dose rate in the PRD that recorded the highest total dose, defined as the total absorbed dose in the detector
- average dose rate over DLOC1, 2 and 3
- Minimum, maximum and average dose, calculated by multiplying the respective dose rates by duration of exposure to space radiation, based on experimenters’ descriptions of experimental methods.
Differences between the doses recorded in the PRDs are due principally to differences in the amount of material shielding the detectors from the space radiation environment, and the doses do not take into account any shielding effects from the specimen containers or any movement of the samples around the middeck. Only Table 1 includes the individual measurements taken by all three PRDs.
Radiation metadata shown for each data set in the GeneLab Data System include:
- Minimum, maximum and average dose for the duration of the experiment, calculated by multiplying the respective dose rates from Table 1 by the duration of the experiment, defined as the time in space during which the specimen was “living” (once the specimen was frozen or fixed, the exposure was considered stopped).
Schematic of Space Shuttle middeck showing locations of passive radiation detectors (PRDs) DLOC1-3
PRDs were TLD-100 thermoluminescent detectors
Doses are corrected for background radiation accumulated on the ground prior to launch and between return and processing
Photo of Space Shuttle middeck showing locations of passive radiation detectors (PRDs) DLOC1-3
Data are from preliminary analysis of results from instruments on the Space Transportation Shuttle, analyzed by subject matter experts from the Space Radiation Analysis Group (SRAG), NASA-JSC. Use of the data are subject to the following rules:
- Data shall not be redistributed internally within NASA without prior consultation with SRAG and review for export control.
- Data shall not be distributed publicly without prior consultation with SRAG and export control of the data.
- Publication of data shall require:
- Consultation with SRAG for data integrity and interpretation.
- The addition of one or several subject matter experts from SRAG
- https://srag.jsc.nasa.gov/
- Dr. Ramona Gaza, SRAG: ramona.gaza-1@nasa.gov
BION-M1 Radiation Dosimetry
GLDS Studies from BION-M1 experiments
BION-M1 Radiation Dosimetry
Launch: 1000 UT 4/19/2013 (Baikonur, Kazakhstan)
Landing: 0312 UT 5/19/2013 (Orenburg region, Russia)
Orbit: apogee 585 km; perigee 555 km; inclination 65 deg
Detectors:
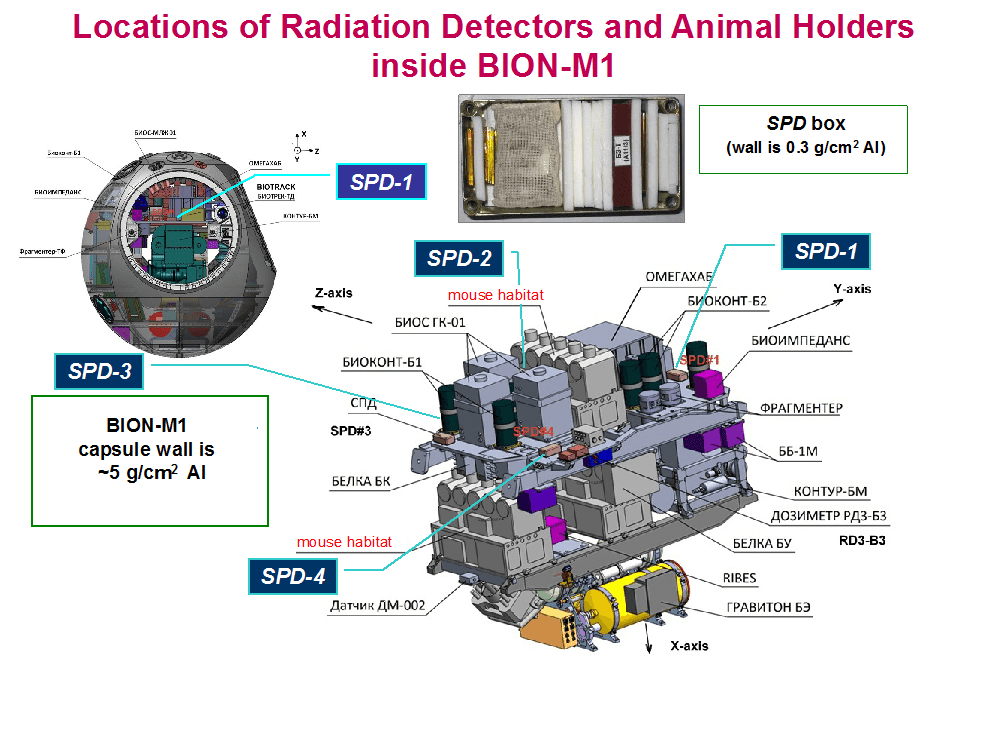
SPD1-41 Passive (thermoluminescent dosimeters, plastic nuclear track detectors) — charged particles
RD3-B32 Active (solid state, Liulin-type) — charged particles
(Operated 4/19-5/13)
Note: Tissues were obtained from surviving mice from the three animal habitats. Advise that data be used as averages and upper and lower bounds for radiation exposure.Note: The absorbed doses are typically measured with a high degree of precision. However due to confounding factors, in particular the differences in local shielding around the payload and around the instrument, unless otherwise noted the doses to the payload should be considered to be accurate to within ~10%, based on known variations to the radiation dose across ISS modules.
SPD data1
| Avg. Abs. Dose D (μGy/day |
Abs. Dose (mGy)2 |
|||||
|---|---|---|---|---|---|---|
| SPD | Low LET | High LET | Total | Low LET | High LET | Total |
| 1 | 1267 | 151 | 1418 | 37.82 | 4.507 | 42.33 |
| 2 | 546 | 84 | 630 | 16.30 | 2.507 | 18.81 |
| 3 | 713 | 112 | 825 | 21.28 | 3.343 | 24.63 |
| 4 | 1008 | 141 | 1149 | 30.09 | 4.209 | 34.30 |
1 From I. Ambrožová et al., Radiat. Meas. 106 (2017) 262-266.
2 Exposure duration was 29.85 days.
Notes:
- Low LET D measured with TLD
- High LET D and H measured with PNTD
RD3-B3 data3
| Avg. Abs. Dose D (μGy/day) |
|||
|---|---|---|---|
| Total | GCR | IRB (SAA) | ORB |
| 985 | 102.8 | 908 | 4.2 |
3 From T. Dachev et al., J. Atmos. Solar Terr. Phys. 123 (2015) 82-91.
Notes:
- GCR = galactic cosmic ray charged nuclei
- IRB (SAA) = inner radiation belt (South Atlantic Anomaly)
- ORB = outer radiation belt
- Total (GCR+IRB+ORB) is somewhat greater than total, due to overlap in selection criteria (as defined in Dachev et al.)
Foton-M4 Radiation Dosimetry
Launch: 2050 UT 7/19/2014 (Baikonur, Kazakhstan)
Landing: 0918 UT 9/1/2014 (Orenburg region, Russia)
Duration: 44 days
Orbit: apogee 571 km; perigee 258 km; inclination 64.9 degree
Detectors:
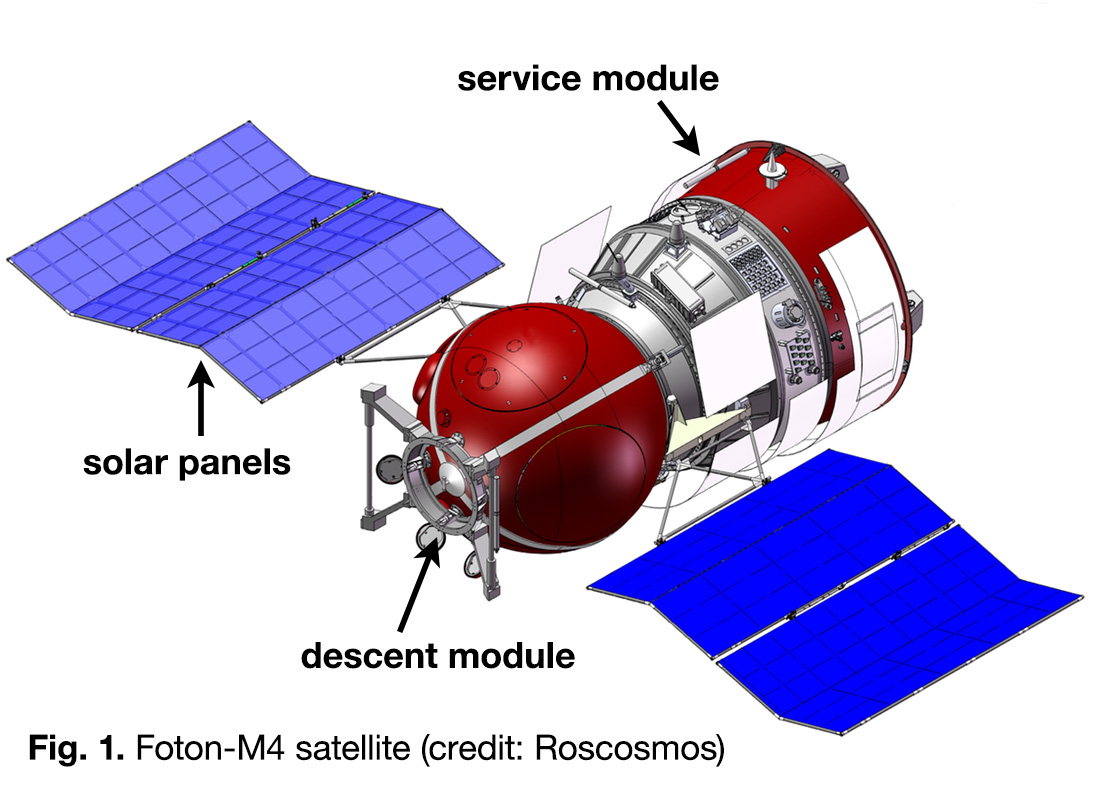
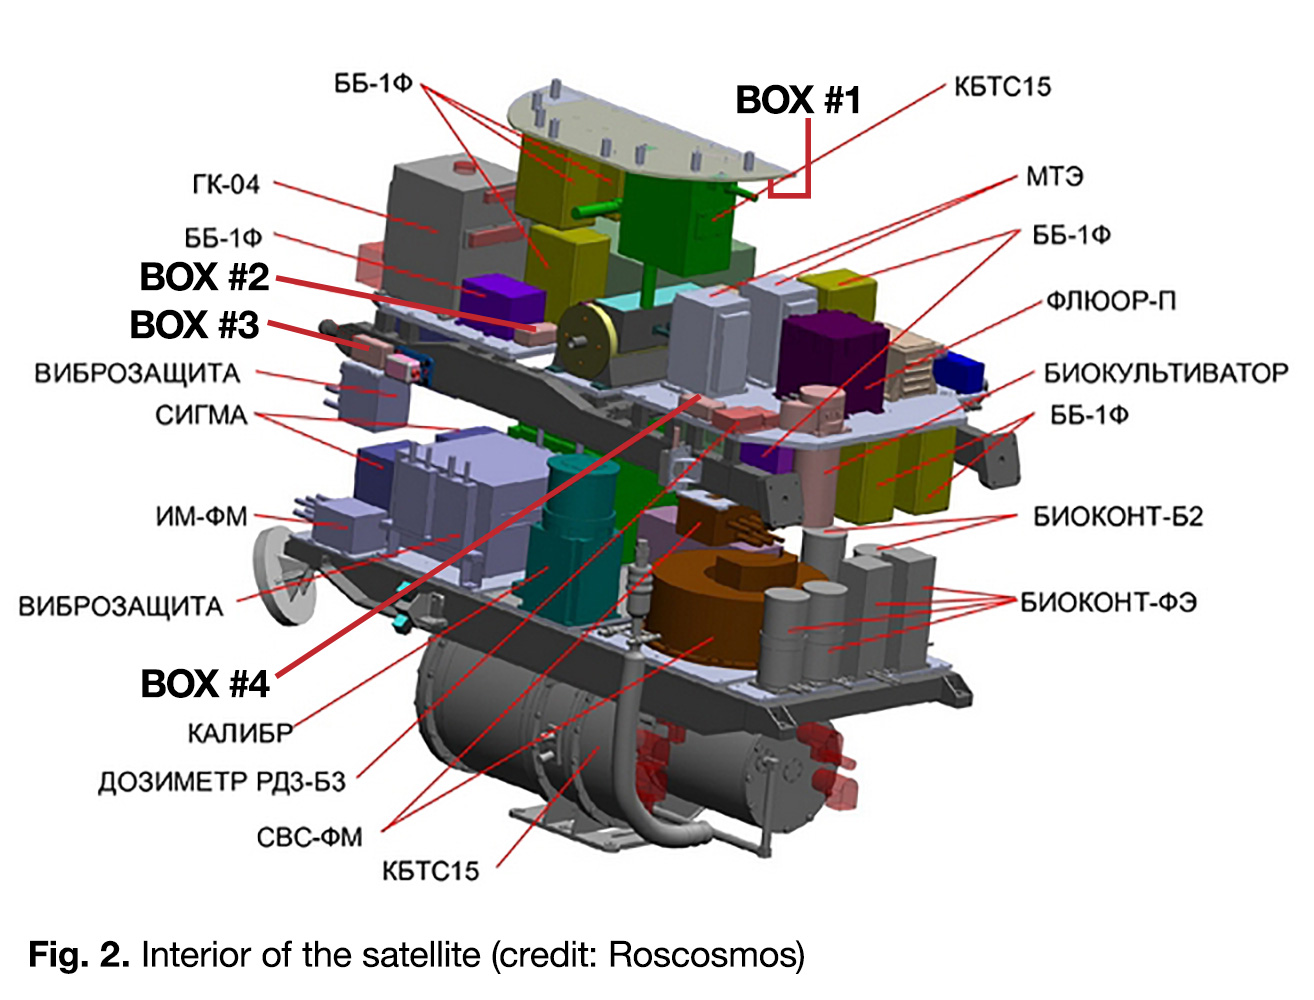
The passive dosimetry packages were housed in four identical boxes (“BOX #1-4”) distributed around the descent module (Fig. 1) at locations as indicated in Fig. 2. Each package consisted of six thermoluminescent detectors (TLD) and two layers of solid state nuclear track-etch detectors (SSNTD). The TLD were sensitive to the low LET components of the radiation field inside the module and the SSNTD were sensitive to the high LET components. An additional box, Box #5, was mounted outside the module.
For details of the measurements see:
A. Strádi et al., Cosmic radiation measurements on the Foton-M4 satellite by passive detectors. Acta Astronautica 131 110-112 (2017).
Note: The absorbed doses are typically measured with a high degree of precision. However due to confounding factors, in particular the differences in local shielding around the payload and around the instrument, unless otherwise noted the doses to the payload should be considered to be accurate to within ~10%, based on known variations to the radiation dose across ISS modules.
SSNTD data: Dosimetric quantities obtained from the LET spectra (above 10 keV μm−1)
| Box | #1 | #2 | #3 | #4 | #5 |
|---|---|---|---|---|---|
| D (μGy/day) | 41 | 51 | 49 | 52 | 75 |
| H (μSv/day) | 520 | 617 | 532 | 626 | 437 |
| Q | 12.7 | 12.2 | 10.9 | 12.0 | 5.8 |
TLD data: Absorbed dose rates measured in the low LET (≤10 keV μm−1) region of space radiation
| Box | #1 | #2 | #3 | #4 | #5 |
|---|---|---|---|---|---|
| D (μGy/day) | 374 | 408 | 532 | 563 | 1078 |
| SD (%) | 7 | 7 | 7 | 3 | 8 |
Convolved data of SSNTD and TLD measurements:
| Box | #1 | #2 | #3 | #4 | #5 |
|---|---|---|---|---|---|
| D corr. (μGy/day) | 366 | 398 | 525 | 551 | 105 |
| D total (μGy/day) | 407 | 448 | 574 | 603 | 1129 |
| H total (μSv/day) | 887 | 1014 | 1057 | 1177 | 1412 |
| Q | 2.2 | 2.3 | 1.8 | 2.0 | 1.3 |
Notes:
- D = the absorbed dose rates
- H = dose equivalent rates
- Q = quality factors
- D corr. = the corrected absorbed dose rate
Reference: A. Strádi et al., Cosmic radiation measurements on the Foton-M4 satellite by passive detectors. Acta Astronautica 131 (2017) 110-112.
GLDS Studies from Shenzhou-8 experiments
| OSD | Description | Sample No. | Dose (mGy) |
|---|---|---|---|
| OSD-165 | N2 Spaceflight Static con (0G) | GSM2414644 | 1.92 |
| OSD-165 | LS292 Spaceflight Static con (0G) | GSM2414645 | 1.92 |
| OSD-165 | N2 Spaceflight 1g -centrifugal con | GSM2414646 | 2.27 |
| OSD-165 | LS292 Spaceflight 1g-centrifugal con | GSM2414647 | 2.27 |
| OSD-166 | N2 Spaceflight Static 1A (0G) | GSM2416821 | 1.92 |
| OSD-166 | LS292 Spaceflight Static 1C (0G) | GSM2416822 | 1.92 |
| OSD-166 | N2 Spaceflight 1g -centrifugal 2A | GSM2416823 | 2.27 |
| OSD-166 | LS292 Spaceflight 1g-centrifugal 2C | GSM2416824 | 2.27 |
| OSD-167 | N2 Spaceflight Static con (0G) | GSM2412681 | 1.92 |
| OSD-167 | LS292 Spaceflight Static con (0G) | GSM2412682 | 1.92 |
| OSD-167 | MT4930 Spaceflight Static con (0G) | GSM2412683 | 1.92 |
| OSD-167 | N2 Spaceflight 1g -centrifugal | GSM2412684 | 2.27 |
| OSD-167 | LS292 Spaceflight 1g-centrifugal | GSM2412685 | 2.27 |
| OSD-167 | MT4930 Spaceflight 1g-centrifugal | GSM2412686 | 2.27 |
| OSD-213 | Atha_Col-0_clsCC_FLT_uG_Rep1 | FM16002_1 | 0.58 |
| OSD-213 | Atha_Col-0_clsCC_FLT_uG_Rep2 | FM16002_2 | 0.58 |
| OSD-213 | Atha_Col-0_clsCC_FLT_1G_Rep1 | FM16001_1 | 0.69 |
| OSD-213 | Atha_Col-0_clsCC_FLT_1G_Rep2 | FM16001_2 | 0.69 |
| OSD-284 | Not Available |
Shenzhou-8 Radiation Dosimetry
GLDS Studies from Shenzhou-8 experiments
Launch: 2158 UT 10/31/2011 (Jiuquan Satellite Launch Center, China)
Landing: 1132 UT 11/17/2011 (Siziwang Banner, Inner Mongolia)
Orbit: average 340 km; inclination 51.4 deg
Detectors: LiF TLD
Samples were located in the DLR SIMBOX experimental facility (https://doi.org/10.1016/j.actaastro.2013.08.022) located in the spacecraft reentry module.
Note: The absorbed doses are typically measured with a high degree of precision. However due to confounding factors, in particular the differences in local shielding around the payload and around the instrument, unless otherwise noted the doses to the payload should be considered to be accurate to within ~10%, based on known variations to the radiation dose across ISS modules.
The TLDs were located on the outer wall of the sample container: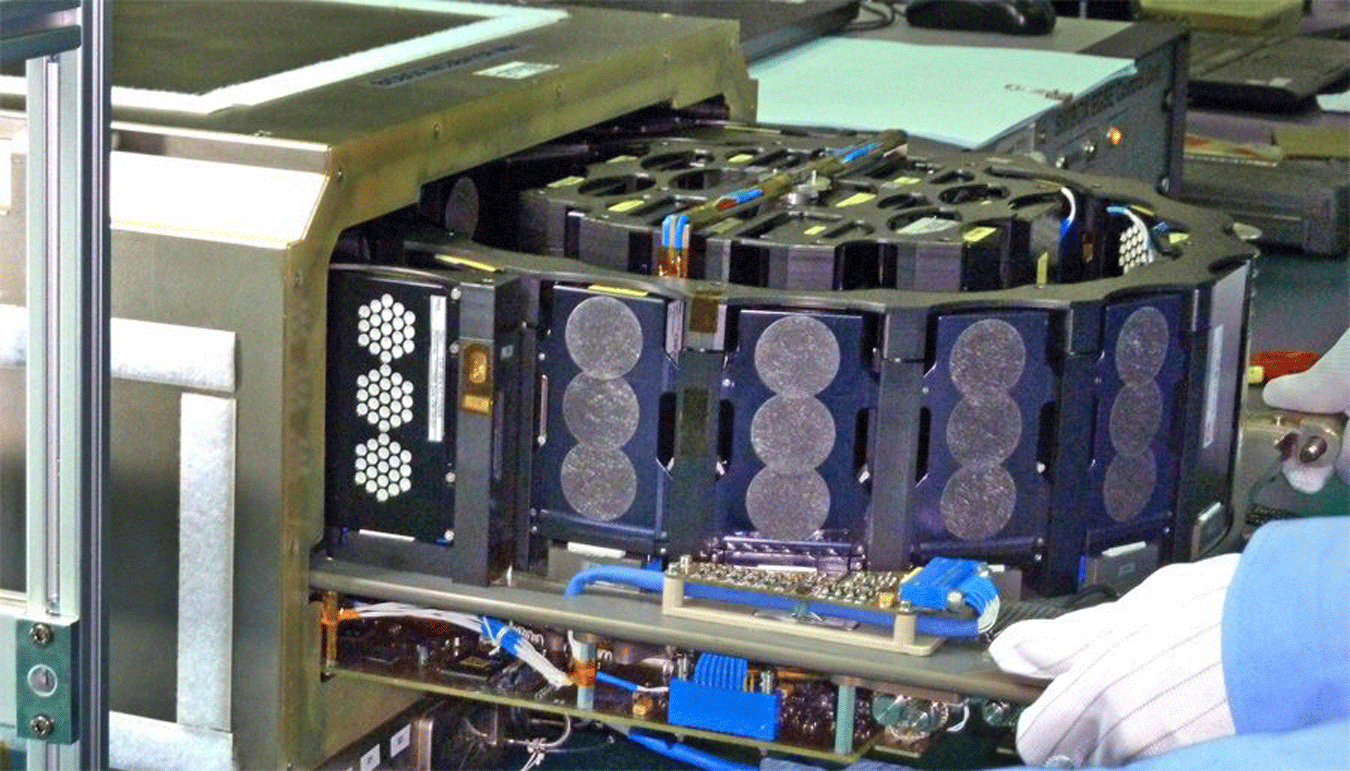
immediately adjacent to the samples, so the principal uncertainty in the sample dose is due to the sensitivity and processing uncertainty of the TLDs. Two doses were recorded, one for animals at 0G and one for animals held at 1G in a centrifuge.
The slightly higher dose to the 1G samples is consistent with the slightly greater shielding of the centrifuge apparatus, and as previously discussed, the total dose of approximately 2 mGy for the 16 day flight is consistent with what would be expected given the orbital inclination of the Shenzhou-8.
ISS Radiation Dosimetry Data
Radiation Data for GLDS Studies on the International Space Station
The absorbed dose to biological payloads on the International Space Station (ISS) depends on a number of factors, including date and duration of exposure and location of the payload on the ISS.
Some of the specific factors that lead to variations in the absorbed dose rate in orbit are:
- altitude (205-270 mi (330-435 km))
- when in the 11 year solar cycle the sample was exposed
- local shielding distribution around the biological sample, which in turn depends on the module in which the sample resides and the location within that module
Of these factors, the local shielding distribution is the most important.
In addition, the measured absorbed dose can vary based on the dosimetry instrument(s) used. Radiation monitoring on the ISS is not standardized across modules; each international partner has its own suite of instruments, with differing technologies, sensitivities and analysis methodologies, including criteria for distinguishing between lightly ionizing particles (mainly protons) and highly ionizing particles (mainly galactic cosmic ray nuclei).
Accuracy and precision of the measurements also varies among instruments, and this is reflected in the precision and, where available, errors in the tabulated data. For details of how the quoted doses were obtained, consult the cited literature for each payload and dosimeter.
The dose in the metadata is the dose recorded by the radiation detector closest to the sample. In most cases that detector will be in the same ISS module; in cases where data from a detector in the same module are not available, the dose is extrapolated using data from periods where data are available from detectors in multiple modules, including the module containing the payload.
ISS Modules
COL – “Columbus”, European Space Agency (ESA)
JPM – Japanese Pressurized Module, Japanese Aerospace Exploration Agency (JAXA); one of three segments in the Japanese Experiment Module “Kibo”
LAB – US Lab “Destiny”, NASA
NOD1, NOD2, NOD3 – nodes connecting ISS modules
Node 1 (“Unity”) connects the U.S. and Russian segments
Node 2 (“Harmony”) connects the U.S., ESA, and Japanese segments
Node 3 (“Tranquility”) is attached to the port side of Node 1
SMP – Russian Service Module “Zvezda”, Roscosmos
Dosimeters
Active (powered; data read out and stored and/or telemetered to ground)
DOSTEL (DOSimetry TELescope) – solid state detector
(Berger et al., https://doi.org/10.1051/swsc/2017005)
RAD (Radiation Assessment Detector) – solid state and plastic scintillator
(R. Rios, https://ntrs.nasa.gov/archive/nasa/casi.ntrs.nasa.gov/20150016969.pdf)
REM (Radiation Environment Monitor) – solid state detector
(Stoffle et al., https://doi.org/10.1016/j.nima.2015.02.016)
R-16 Radiometer – ionization chamber
(https://www.sciencedirect.com/science/article/pii/S1350448702000847)
TEPC (Tissue Equivalent Proportion Counter)
(https://www.nasa.gov/mission_pages/station/research/experiments/explorer/Investigation.html? – id=620)
Passive (unpowered; record constantly; read out upon return to ground)
OSLD – optically stimulated luminescence detector
(Goossens et al., https://doi.org/10.1093/rpd/nci652,
Vanhavere et al., https://doi.org/10.1016/j.radmeas.2007.12.002)
PADLES (PAssive Dosimeters for Lifescience Experiments in Space) – thermoluminescence detectors, track etch detectors
(Nagamatsu et al. https://doi.org/10.1016/j.radmeas.2013.05.008)
TLD – thermoluminescence detector
(Goossens et al., https://doi.org/10.1093/rpd/nci652,
Vanhavere et al., https://doi.org/10.1016/j.radmeas.2007.12.002)
track etch detectors
(Benton and Richmond, https://doi.org/10.1016/1359-0189(86)90639-4)
• Rodent Research
In space, astronauts experience a number of changes that could affect their health. Understanding these effects of weightlessness, as well as how to treat them, will be vital to a successful future for humans in space. Since the environment of space alters multiple, interacting biological systems – including bones, muscles, the heart, blood flow, and the immune system – sometimes it is better to study everything at once in the entire organism. This can be achieved by working with research model organisms, such as mice and other rodents. Given their genetic similarity to humans, studying mice allows scientists to gain insight into the workings of the human body. The rodents’ faster development and shorter life span reveal effects of microgravity on a shorter timescale, and the chance to fly dozens of small rodents on each mission yields much more data from which to draw scientific conclusions. Below, is a downloadable excel file containing relevant radiation dosimetry for rodent research.
Downloadable table: RR_Radiation_Data_5-5-23.xlsx
- Note: The absorbed doses are typically measured with a high degree of precision. However due to confounding factors, in particular the differences in local shielding around the payload and around the instrument, unless otherwise noted the doses to the payload should be considered to be accurate to within ~10%, based on known variations to the radiation dose across ISS modules.
- Times are UTC
- Doses are in water based on standard conversion from dose in silicon.
- Doses include approximate dose received on launch vehicle before transfer to the ISS. Since there was no dosimetry on the launch vehicle, dose is approximated based on average values in the US Lab.
- Data are cumulative absorbed doses from preliminary analysis of results from instruments on the International Space Station, analyzed by subject matter experts from the Space Radiation Analysis Group (SRAG), NASA-JSC. (https://srag.jsc.nasa.gov/)
For more detailed data, contact SRAG, through OSDR: https://www.nasa.gov/osdr-help-contact-us/
Use of the data are subject to the following rules:
- Data for internal NASA use or for use by NASA-funded or outside investigators are to be obtained directly from the OSDR (https://www.nasa.gov/reference/osdr-environmental-data/)
- Use of the data in publications or presentations shall require:
- Consultation with SRAG for data integrity and interpretation.
- Acknowledgement of one or more subject matter experts from SRAG.
• US Lab
Downloadable table: Dose_data_(US_Lab)_3-20-23.xlsx
Note: The absorbed doses are typically measured with a high degree of precision. However due to confounding factors, in particular the differences in local shielding around the payload and around the instrument, unless otherwise noted the doses to the payload should be considered to be accurate to within ~10%, based on known variations to the radiation dose across ISS modules.
1Habitats
- ABRS – Advanced Biological Research System
(https://www.nasa.gov/mission_pages/station/research/experiments/explorer/Investigation.html?#id=635) - BRIC – Biological Research in Canisters
(https://www.nasa.gov/mission_pages/station/research/experiments/explorer/Investigation.html?#id=697) - PDFU – Petri Dish Fixation Unit
- CGBA – Commercial Generic Bioprocessing Apparatus
(https://www.nasa.gov/mission_pages/station/research/experiments/explorer/Investigation.html?#id=329) - CHab – Caenorhabditis elegans Habitat
(https://www.nasa.gov/mission_pages/station/research/experiments/explorer/Investigation.html?#id=970) - EXPRESS – EXpedite the PRocessing of Experiments to Space Station
(https://ntrs.nasa.gov/archive/nasa/casi.ntrs.nasa.gov/20140016876.pdf)
2Dosimeters
- RAD – Radiation Assessment Detector
(https://ntrs.nasa.gov/archive/nasa/casi.ntrs.nasa.gov/20150016969.pdf) - REM – Radiation Environment Monitor
(https://www.sciencedirect.com/science/article/pii/S0168900215001977) - TEPC – Tissue Equivalent Proportional Counter
(https://www.nasa.gov/mission_pages/station/research/experiments/explorer/Investigation.html?#id=620)
3Modules
- COL – ESA Module (“Columbus”)
- JPM – Japanese Pressurized Module (part of “Kibo”)
- LAB – US Lab (“Destiny”)
- NOD1, NOD2, NOD3 = Nodes, which connect the elements of the ISS.
- Node 1 (“Unity”) connects the U.S. and Russian segments.
- Node 2 (“Harmony”) connects the U.S., European, and Japanese laboratories, as well as PMA-2.
- Node 3 (“Tranquility”) is attached to the port side of Node 1 and provides accommodation for life-support equipment.
- SMP = Russian Service Module (“Zvezda”)
4Absorbed dose is broken out into SAA and GCR contributions, estimated based on the ISS trajectory and a geomagnetic field model
Data are cumulative absorbed doses from preliminary analysis of results from instruments on the International Space Station, analyzed by subject matter experts from the Space Radiation Analysis Group (SRAG), NASA-JSC. (https://srag.jsc.nasa.gov/)
For more detailed data, contact SRAG, through OSDR: https://www.nasa.gov/osdr-help-contact-us/
Use of the data are subject to the following rules:
- Data for internal NASA use or for use by NASA-funded or outside investigators are to be obtained directly from the OSDR (https://genelab.nasa.gov/environmental/radiation)
- Use of the data in publications or presentations shall require:
- Consultation with SRAG for data integrity and interpretation.
- Acknowledgement of one or more subject matter experts from SRAG.
• International Labs
Downloadable table: Dose_data_(Int’l. labs)+LET threshold_3-20-23.xlsx
Note: The absorbed doses are typically measured with a high degree of precision. However due to confounding factors, in particular the differences in local shielding around the payload and around the instrument, unless otherwise noted the doses to the payload should be considered to be accurate to within ~10%, based on known variations to the radiation dose across ISS modules.
1Habitat
- Aquarius – Incubator
- AQH – Aquatic Habitat (http://iss.jaxa.jp/en/kiboexp/pm/aqh/)
- Biolab – http://www.esa.int/Our_Activities/Human_and_Robotic_Exploration/Columbus/Biolab
- CBEF – Cell Biology Experimental Facility
(https://www.nasa.gov/mission_pages/station/research/experiments/explorer/Investigation.html?#id=333) - EXPRESS – EXpedite the PRocessing of Experiments to Space Station
(https://ntrs.nasa.gov/archive/nasa/casi.ntrs.nasa.gov/20140016876.pdf) - Kubik – Incubator
(http://wsn.spaceflight.esa.int/docs/Factsheets/25%20Kubik%20HR_WEB.pdf) - Lada – (https://www.researchgate.net/publication/246637532_Lada_The_ISS_Plant_Substrate_Microgravity_Testbed)
- MDS – Mouse Drawer System
(https://journals.plos.org/plosone/article?id=10.1371/journal.pone.0032243)
2Dosimeter
Active
- DOSTEL – DOSimetry TELescope (https://doi.org/10.1051/swsc/2017005)
- REM – Radiation Environment Monitor (https://www.sciencedirect.com/science/article/pii/S0168900215001977)
- R-16 Radiometer – (https://www.sciencedirect.com/science/article/pii/S1350448702000847)
- TEPC – Tissue Equivalent Proportional Counter
(https://www.nasa.gov/mission_pages/station/research/experiments/explorer/Investigation.html?#id=620)
Passive
- OSLD – optically stimulated luminescence detector
(https://doi.org/10.1093/rpd/nci652, https://doi.org/10.1016/j.radmeas.2007.12.002) - PADLES – PAssive Dosimeters for Lifescience Experiments in Space
(https://www.sciencedirect.com/science/article/pii/S1350448713002448?via%3Dihub) - TLD – thermoluminescence detector
(https://doi.org/10.1093/rpd/nci652, https://doi.org/10.1016/j.radmeas.2007.12.002) - track etch – (https://www.sciencedirect.com/science/article/pii/1359018986906394)
3Absorbed dose is broken out into components depending on the detector.
- for SRAG data, “SAA” and “GCR” contributions are estimated based on the ISS trajectory and a geomagnetic field model
- for DOSTEL, GCR and SAA are estimated based on count rate
- for passive detectors (TLD, OSLD, track-etch) High- and Low-LET are determined by detector thresholds
- (in general, TLD and OSLD are sensitive to LET ≤ 10 keV/un; track etch (CR-39, PADC) are sensitive to LET ≥ 10 keV/um))


