


Inlets and Nozzles
Physics Modeling and Validation
Improvements in physical modeling and the validation of these methods are critical to advancing numerical simulation capabilities.
Boundary Layer Bleed Modeling

The modeling of porous bleed boundary conditions was improved by scaling sonic flow coefficient data for 90-degree bleed holes. The updated bleed model showed good agreement with experimental data and three-dimensional computational fluid dynamics (CFD) simulations.
- Slater, J.W., “Improvements in Modeling 90-degree Bleed Holes for Supersonic Inlets,” NASA TM 2009-215597, Jun 2009. Also AIAA-2009-710.
- Slater, J.W., and Saunders, J.D., “Modeling of Fixed-Exit Porous Bleed Systems,” NASA TM 2008-215178, May 2008. Also AIAA-2008-0094.
| Area of Expertise | Researcher Name | |
|---|---|---|
| Bleed Modeling | John Slater | john.w.slater@nasa.gov |
| Bleed Modeling | Christine Pastor-Barsi | christine.m.pastor@nasa.gov |
Vortex Generator Modeling
Including small-scale geometric features, such as vortex generators, in numerical simulations can be tedious and computationally expensive. Replacing these physical elements with modeled source terms can significantly streamline preliminary design studies.
- Dudek, Julianne C., “Modeling Vortex Generators in a Navier-Stokes Code,” AIAA Journal, Vol. 40, No. 4, Apr. 2011.
- Dudek, Julianne C., “Empirical Model for Vane-Type Vortex Generators in a Navier–Stokes Code,” AIAA Journal, Vol. 44, No. 8, Aug. 2006.
| Area of Expertise | Researcher Name | |
|---|---|---|
| Vortex Generator Modeling in Structured Reynold’s-Averaged Navier-Stokes Solvers | Julianne Dudek | jdudek@nasa.gov |
Large Eddy Simulation (LES)
Scale-resolving simulations are increasingly used to improve the understanding and prediction of complex flow physics.
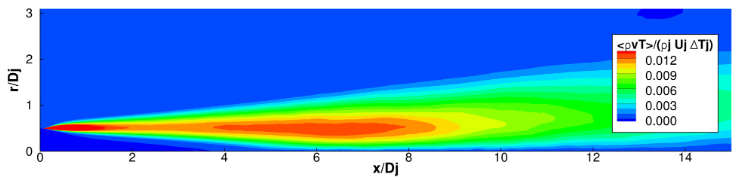
LES of a Hot Subsonic Jet
One example of how LES can inform turbulence modeling is in the prediction of hot jets. In this study, the WRLES solution was validated using individual velocity (v) and temperature (T) data. LES was then employed to compute the turbulent heat flux correlation (vT), as simultaneous measurement of velocity and temperature at a single point is not practical.
The results revealed the limitations of the thermal gradient diffusion approximation commonly used in most RANS turbulence models.
- DeBonis, J.R., “Prediction of Turbulent Temperature Fluctuations in Hot Jets,” AIAA Journal, Vol. 56, No. 8, pp. 3097-3111, Aug. 2018.
Wall Resolved LES of a Backward Facing Step
Accurately predicting flow separation remains one of the most significant challenges in computational fluid dynamics. Separation can occur in inlets and diffusers, where it adversely affects propulsion system efficiency and operability. Reynolds-averaged Navier-Stokes (RANS) methods typically perform poorly in regions with separated flow. Scale-resolving simulation (SRS) approaches have demonstrated the ability to capture such phenomena, albeit at significantly higher computational cost.
The backward-facing step is a canonical case used to isolate the effects of separation and reattachment by removing the separation point. NASA’s Wave Resolving Large-Eddy Simulation (WRLES) code was applied to this configuration and produced flow separation predictions that outperformed those generated by RANS models.
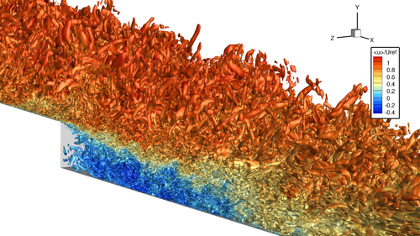
- DeBonis, J.R., “A Large-Eddy Simulation of Turbulent Flow Over a Backward Facing Step,” AIAA Paper 2022-0337, Jan. 2022.
Scale Resolving Simulations of the Taylor-Green Vortex Flow
The Taylor-Green vortex (TGV) is a canonical fluid dynamics problem developed to study vortex dynamics, transition to turbulence, turbulent decay, and energy dissipation. It captures several fundamental physical processes of turbulence within a simplified construct, making it an ideal case for evaluating turbulent flow simulation methodologies.
The problem consists of a cubic fluid domain with a smooth initial vorticity distribution. As the flow evolves, the vortices roll up, stretch, and interact—ultimately breaking down into turbulence. NASA’s Wave Resolving Large-Eddy Simulation (WRLES) high-order-accuracy solver was applied to this case to assess its capability to predict the underlying physical processes. The results demonstrated strong agreement with reference data, and the effects of solver order, grid resolution, and subgrid-scale modeling were systematically examined.
- DeBonis, J.R., “Solutions of the Taylor-Green Vortex Problem Using High-Resolution Explicit Finite Difference Methods,” AIAA Paper 2013-0382, Jan. 2013.
| Area of Expertise | Researcher Name | |
|---|---|---|
| Large Eddy Simulations of Propulsion Flows | James DeBonis | james.r.debonis@nasa.gov |
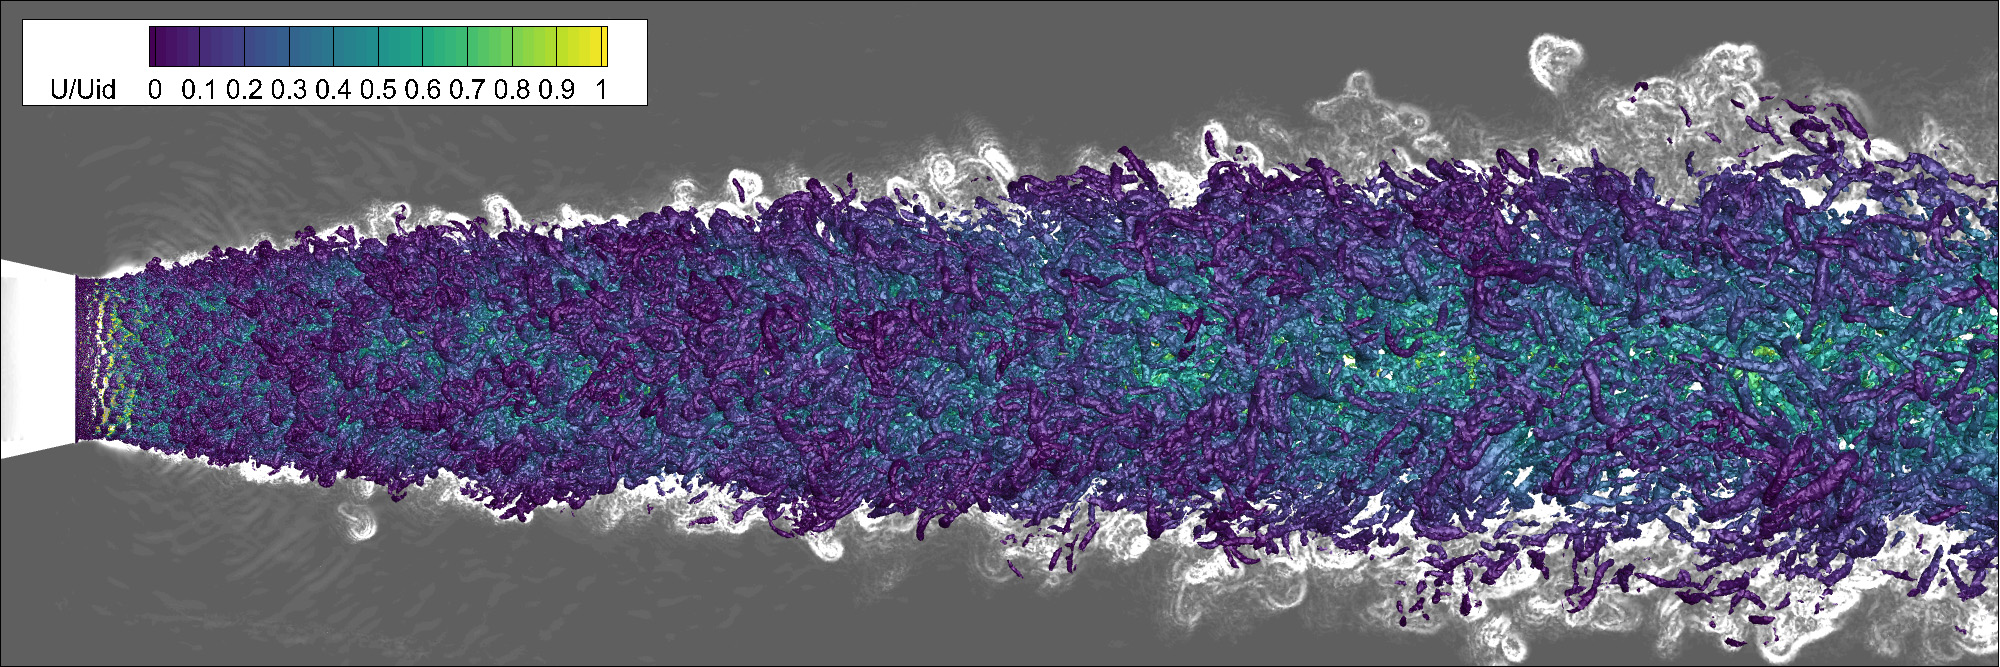
WMLES of a Subsonic Jet
Wall-modeled large-eddy simulations (WMLES) avoid resolving the steep flow gradients within the inner boundary layer by modeling the wall shear stress and applying it as a boundary condition. This approach results in significant computational cost savings compared to wall-resolved large-eddy simulations.
| Area of Expertise | Researcher Name | |
|---|---|---|
| Wall-Modeled Large Eddy Simulations | Brian Heberling | brian.heberling@nasa.gov |
LES of a Shock-Wave Boundary-Layer Interaction (SWBLI)
Another example of complex flow physics under investigation is the influence of sidewall effects on an impinging shock-wave boundary-layer interaction. Statistics from this simulation, conducted using the FDL3DI solver, will be used to inform turbulence model development.
- Vyas, M.A., Yoder, D.A., and Gaitonde, D.V., “Reynolds-stress Budgets in an Impinging Shock Wave/Boundary-layer Interaction,” AIAA Journal, 57(11):4698–4714, Nov. 2019.
- Vyas, M.A., et al., “Sidewall Effects on Exact Reynolds-Stress Budgets in an Impinging Shock Wave/Boundary Layer Interaction,” NASA/TM-2019-220143, Mar. 2019. Also AIAA-2019-1890.
| Area of Expertise | Researcher Name | |
|---|---|---|
| SWBLI Simulations | Manan Vyas | manan.vyas@nasa.gov |
LES of a THX3 Single Cooling Hole Experiment
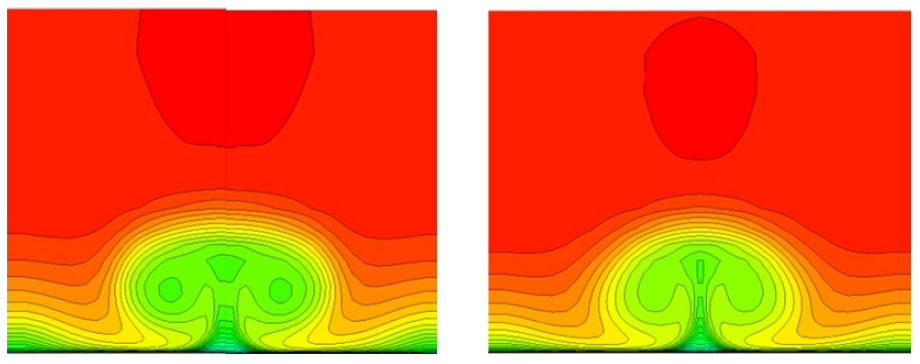
Comparison of mean temperature from LES and RANS of the THX Phase III single cooling hole experiment.
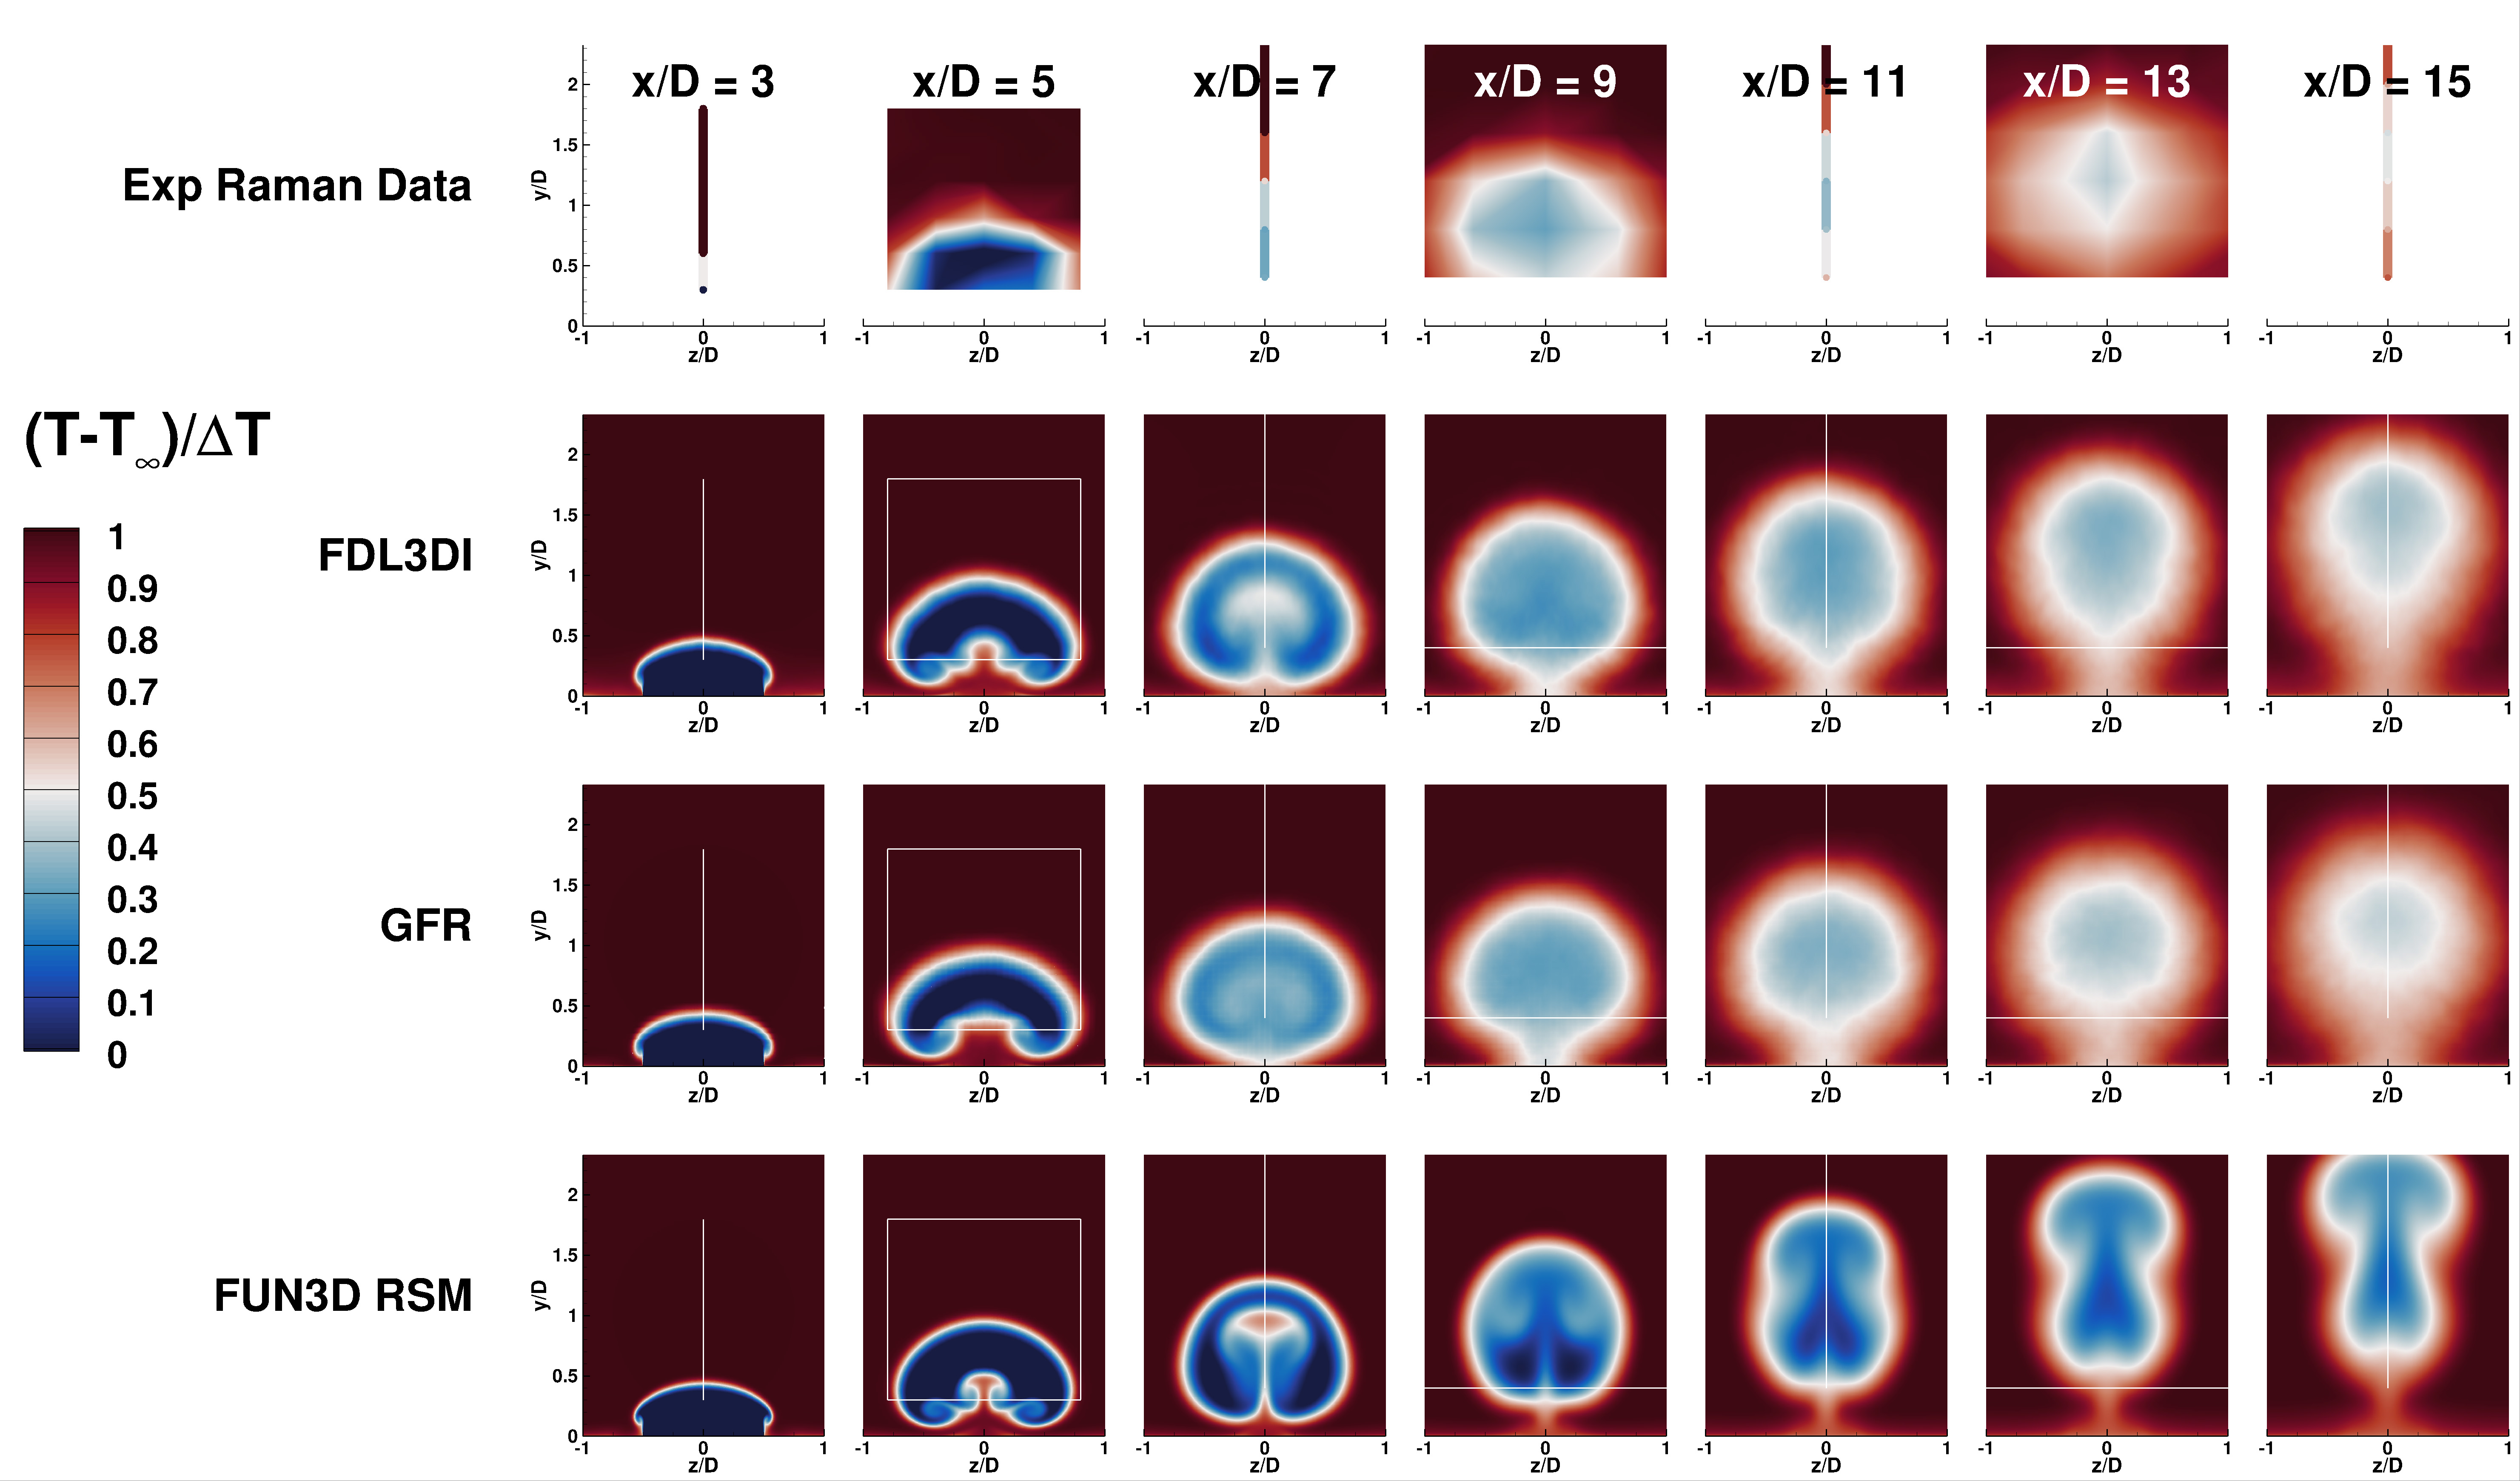

Another example is the FDL3DI and GFR simulations of the THX Phase III single cooling hole experiment described above. In this case, velocity and temperature predictions were again compared with experimental data. LES-derived values of turbulent heat flux (vT) were then used to assess turbulence model performance.
- Spiegel, S.C., Borghi Jr., M.R., and Yoder, D.A., “Large Eddy Simulations of a Single-Injector Cooling Flow Using the High-Order Flux Reconstruction Method,” AIAA-2022-1813, Jan. 2022.
- Borghi Jr., M.R., “Implicit Large-Eddy Simulation of Single-Injector Cooling Flow,” AIAA-2022-1814, Jan. 2022.
- Borghi Jr., M.R., Spiegel, S.C., Yoder, D.A., Georgiadis, N.J., and Wernet, M.P., “Turbulent Simulations of Cooling Jets in Crossflow,” AIAA-2022-1815, Jan. 2022.
- Yoder, D.A., “Assessment of Turbulence Models for a Single-Injector Cooling Flow,” AIAA-2022-1812, Jan. 2022.
| Area of Expertise | Researcher Name | |
|---|---|---|
| THX3 Single Cooling Hole Simulations | Seth Spiegel | seth.c.spiegel@nasa.gov |
LES of a Spacecraft Cabin Ventilation Fan

This example of LES involves the Quiet Space Fan (QSF) prototype, a ventilation fan designed to reduce cabin noise in future crewed spacecraft and space stations. The QSF was used to test three significant new capabilities in the high-order GFR code: improved time-to-solution performance, fully unstructured mixed-element meshes, and a rotating reference frame for simulating turbomachinery.
Fourth- and fifth-order simulations revealed evidence of flow separation on the suction side of the rotor blades—features not previously detected in experiments or Reynolds-averaged Navier-Stokes (RANS) simulations. These insights could help improve the efficiency and noise reduction of future prototypes prior to deployment in space missions.
- Spiegel, S.C., Yoder, D.A., DeBonis, J.R., Huynh, H.T., Heinlein, G.S., Borghi Jr., M.R., and Georgiadis, N.J., “New Capabilities and Improvements to the High-Order Glenn Flux Reconstruction Code,” AIAA-2025-0061, Jan. 2025. Also 2025 SciTech Forum presentation.
| Area of Expertise | Researcher Name | |
|---|---|---|
| Spacecraft Cabin Ventilation Fan Simulations | Seth Spiegel | seth.c.spiegel@nasa.gov |
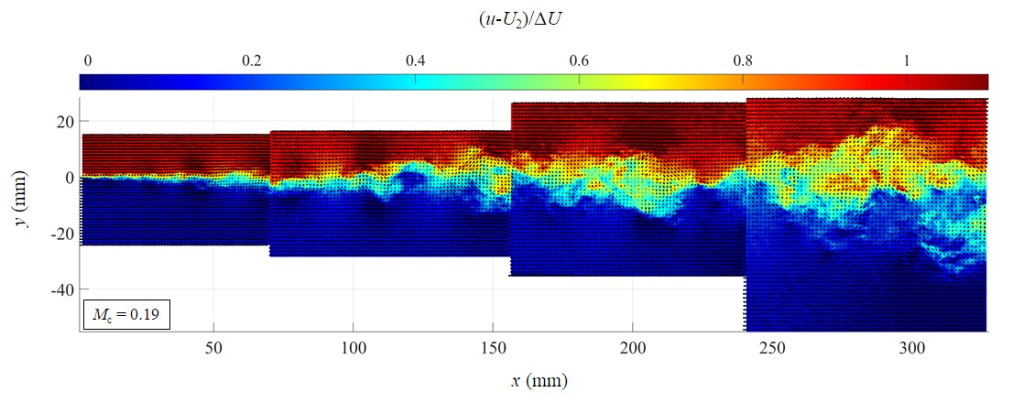
Scale Resolving Simulations of Compressible Mixing Layers
Inlet and nozzle researchers have investigated compressible mixing layers using experimental data from the University of Illinois Urbana-Champaign (UIUC) group, as discussed earlier in this section. Both recent and older datasets have been analyzed using various scale-resolving methods over the years. Early studies employed a hybrid RANS–LES approach:
- Georgiadis, N.J., Alexander, J.I.D., and Reshotko, E., “Hybrid Reynolds-Averaged Navier-Stokes/Large-Eddy Simulations of Supersonic Turbulent Mixing,” AIAA Journal, Vol. 41, No. 2, Feburary 2003, pp. 218-229.
Subsequent studies employed the WRLES code developed by DeBonis and included upstream calculations of the wall boundary layers that generate the compressible mixing layer.
- Mankbadi, M.R., DeBonis, J.R., and Georgiadis, N.J., “Comparison of High-Order and Low-Order Methods for Large-Eddy Simulation of a Compressible Mixing Layer,” AIAA Paper 2015-2939, Jun. 2015.
Recent work has focused on detailed analysis of the turbulent flow budget terms:
- Debonis, J.R., “Implicit Large-Eddy Simulations of Compressible Mixing Layers,” AIAA Paper 2024-1364, Jan. 2024.
Assessment of Large-Eddy Simulation Capabilities and Needs
Inlet and nozzle researchers have authored survey papers addressing the state of the art and research needs of large-eddy simulation (LES) methods for aerodynamic flows::
- Yoder, D.A., DeBonis, J.R., and Georgiadis, N.J., “Modeling of Turbulent Free Shear Flows,” Computers and Fluids, Vol. 117, 2015, pp. 215-232.
- Georgiadis, N.J., Rizzetta, D.P. and Fureby, C., “Large-Eddy Simulation: Current Capabilities, Recommended Practices, and Future Research,” AIAA Journal, Vol. 48, No. 8, Aug. 2010, pp. 1772-1784.
- Debonis, J.R., “Progress Towards Large-Eddy Simulations for Prediction of Realistic Nozzle Systems,” Journal of Propulsion and Power, Vol. 23, No. 5, Sept. 2007, pp. 971-980.
- Georgiadis, N.J. and DeBonis, J.R., “Navier-Stokes Analysis Methods for Turbulent Jet Flows with Application to Aircraft Exhaust Nozzles, Progress in Aerospace Sciences, Vol. 42, Jul. 2006, pp. 377-418.
Read More About Inlets and Nozzles
Fundamental Physics Experiments
Fundamental physics experiments increase our understanding of more complex problems and provide important data for improving and validating physical models.
Design and Analysis Software
A range of advanced software tools is used to support the design, analysis, and testing of inlets and nozzles for aerospace propulsion systems.
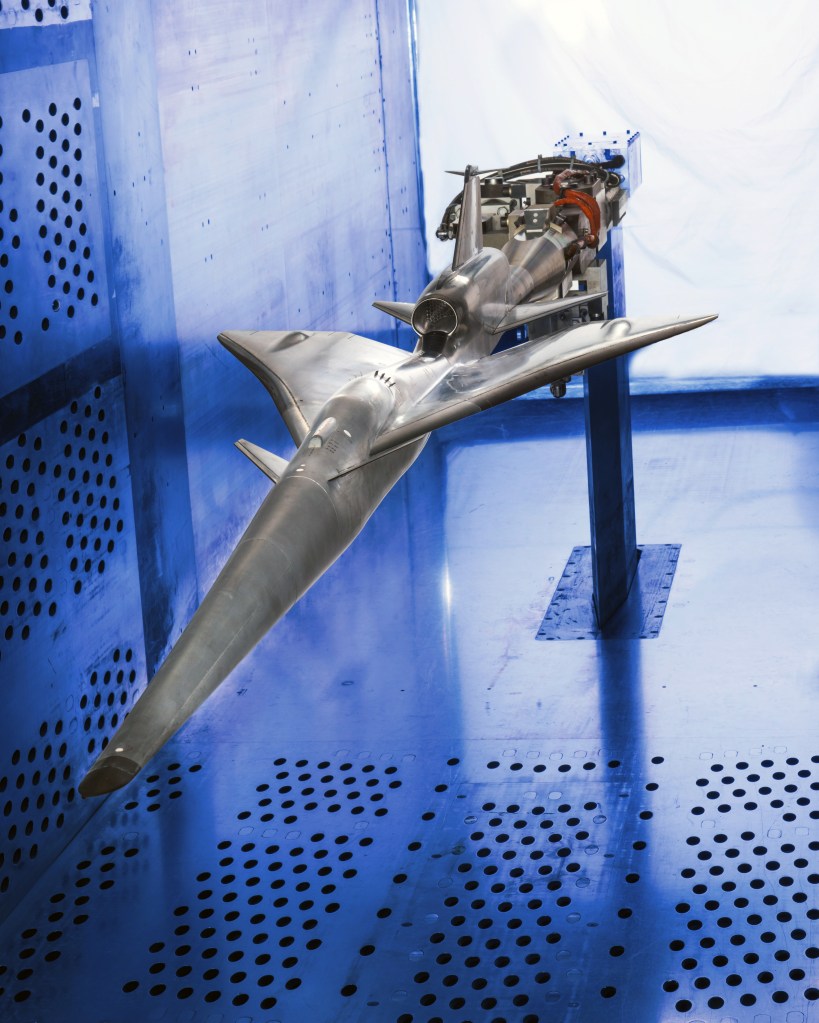
Support of Flight Demonstration Projects
Computational fluid dynamics, wind tunnel tests, real-time displays, and system integration support X-59 supersonic flight.
Inlets and Nozzles
NASA is advancing inlets and nozzles for aircraft engines and aerospace applications through research supporting commercial, military aircraft, and space propulsion systems.
Return