


Inlets and Nozzles
Fundamental Physics Experiments
Fundamental physics experiments increase our understanding of more complex problems and provide important data for improving and validating physical models.
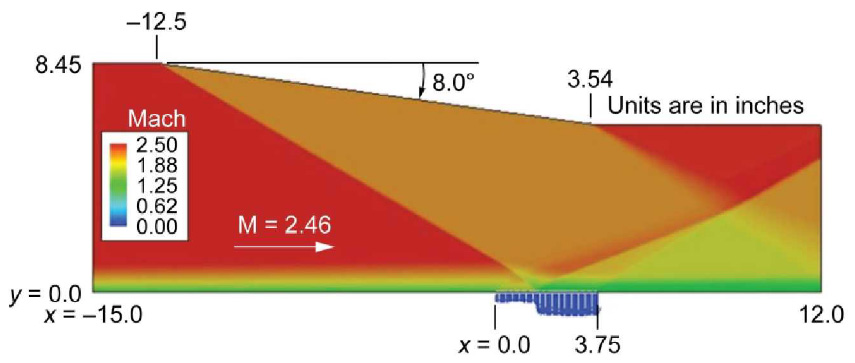
Fundamental Inlet Bleed Experiments (FIBE)
Accurately predicting bleed flow behavior depends heavily on understanding how the bleed orifice flow coefficient changes under different operating conditions.
NASA Glenn researchers conducted a series of fundamental inlet bleed experiments to build a comprehensive experimental database and improve understanding of bleed system performance. The goals included advancing modeling techniques, testing alternative bleed configurations, and evaluating bleed placement in supersonic and hypersonic inlets.
In Phase I, researchers collected flow coefficient data for single bleed holes with 90- and 20-degree inclinations.
- Davis, D.O., et al., “Research on Supersonic Inlet Bleed,” NASA TM 2012-217620, Aug 2012. Also AIAA-2012-0272.
In Phase II, researchers collected flow coefficient data for 21 configurations of a single bleed hole. The study examined how design parameters—such as hole diameter, inclination angle, and thickness-to-diameter ratio—interacted with flow conditions, including pressure ratio and Mach number. A preliminary statistical model was developed to describe these relationships.
- Eichorn, M.B., et al., “Effect of Boundary-Layer Bleed Hole Inclination Angle and Scaling on Flow Coefficient Behavior,” NASA TM 2013-217843, Feb. 2013. Also AIAA-2013-0424.
| Area of Expertise | Researcher Name | |
|---|---|---|
| Bleed Experiments | Christine Pastor-Barsi | christine.m.pastor@nasa.gov |
Mixing Layer Experiments

NASA funded a series of compressible planar mixing layer experiments to generate high-quality data for validating turbulence models.
- Kim, K.U., Elliott, G.S. and Dutton, J.C., “Three-Dimensional Experimental Study of Compressibility Effects on Turbulent Free Shear Layers,” AIAA Journal, Vol. 58, No. 1, Jan. 2020.
- Kim, K.U., Elliott, G.S. and Dutton, J.C., “Compressibility Effects on Large Structures and Entrainment Length Scales in Mixing Layers,” AIAA Journal, Vol. 58, No. 12, Dec. 2020.
- Dutton, J.C., Elliott, G.S., and Kim, K., “Compressible Mixing Layer Experiments for CFD Validation,” AIAA-2019-2847, Jun 2019.
The data is hosted in a Box repository maintained by the University of Illinois.
| Area of Expertise | Researcher Name | |
|---|---|---|
| Mixing Layer Experiments | James R. DeBonis | james.r.debonis@nasa.gov |
Fundamental Experimental Jet Studies
The open-jet facility in test cell CW-17 is used for fundamental studies of flow and noise in various nozzle configurations. The facility can be configured for thrust measurements, as shown in the photo below. It supports plenum pressures up to 65 psig and flow rates up to 4 pounds per second.
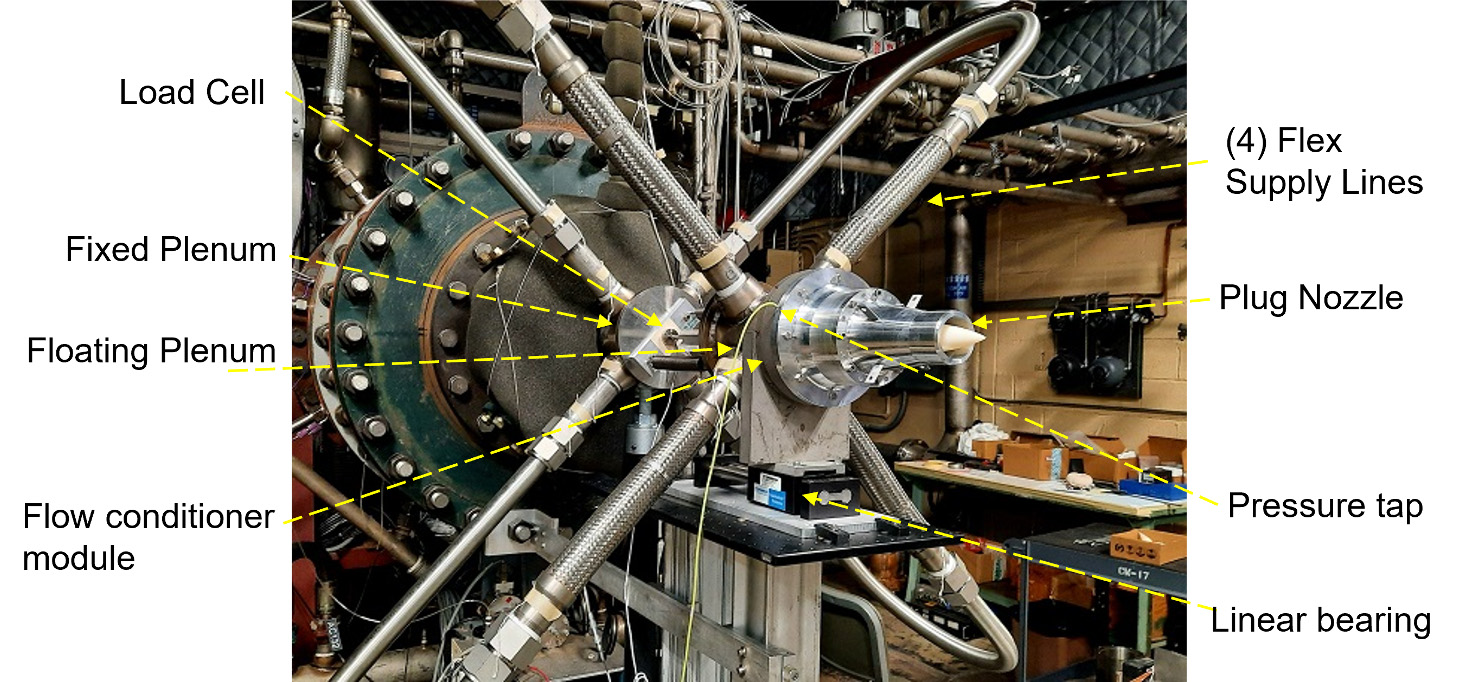
- K.B.M.Q. Zaman, A.F. Fagan and J.H. Korth, “Flow, Noise and Thrust of Supersonic Plug Nozzles”, AIAA Paper 2024-2305, Jan. 2024.
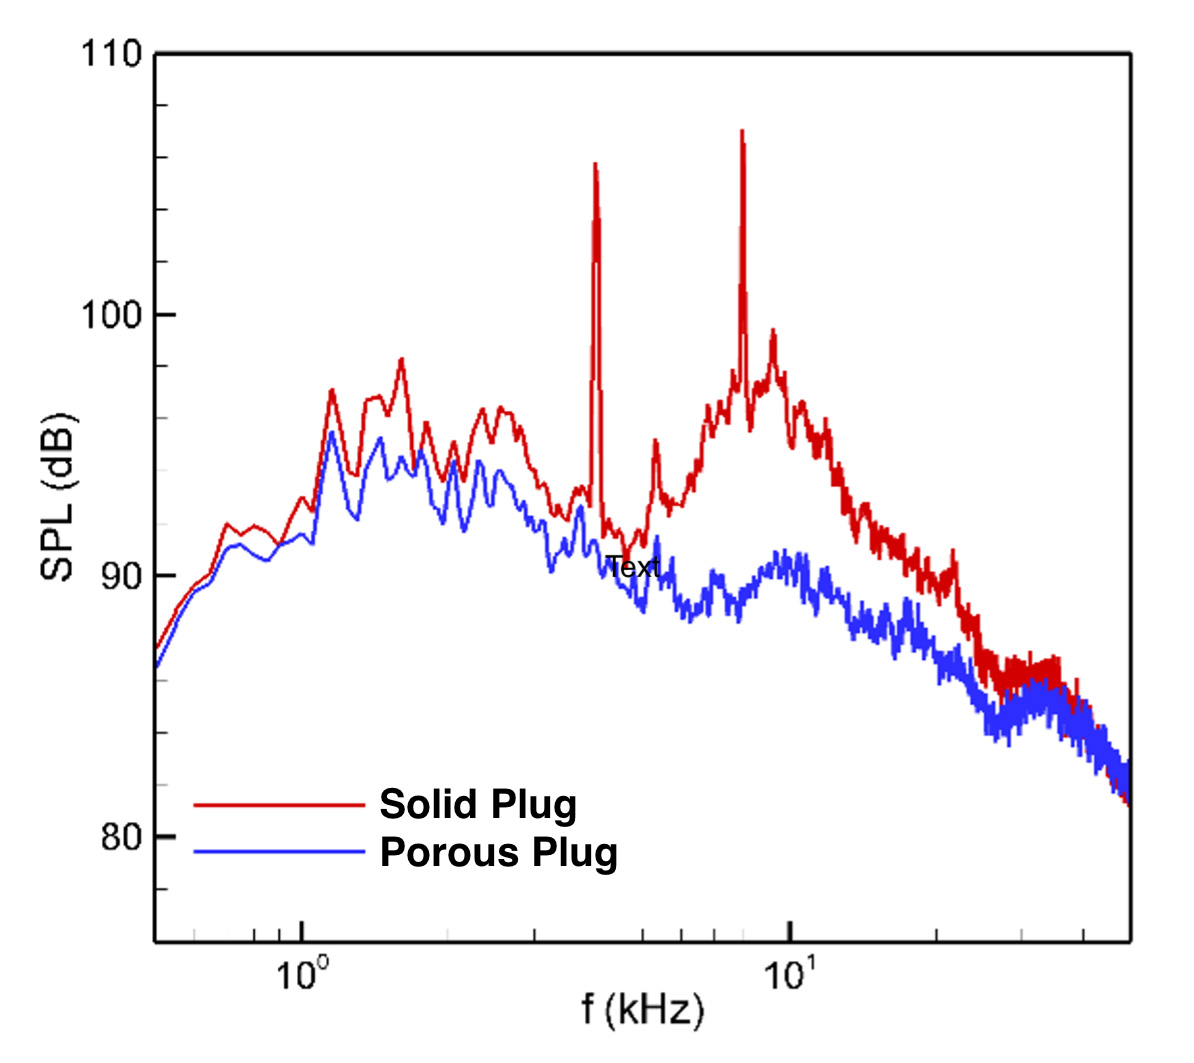
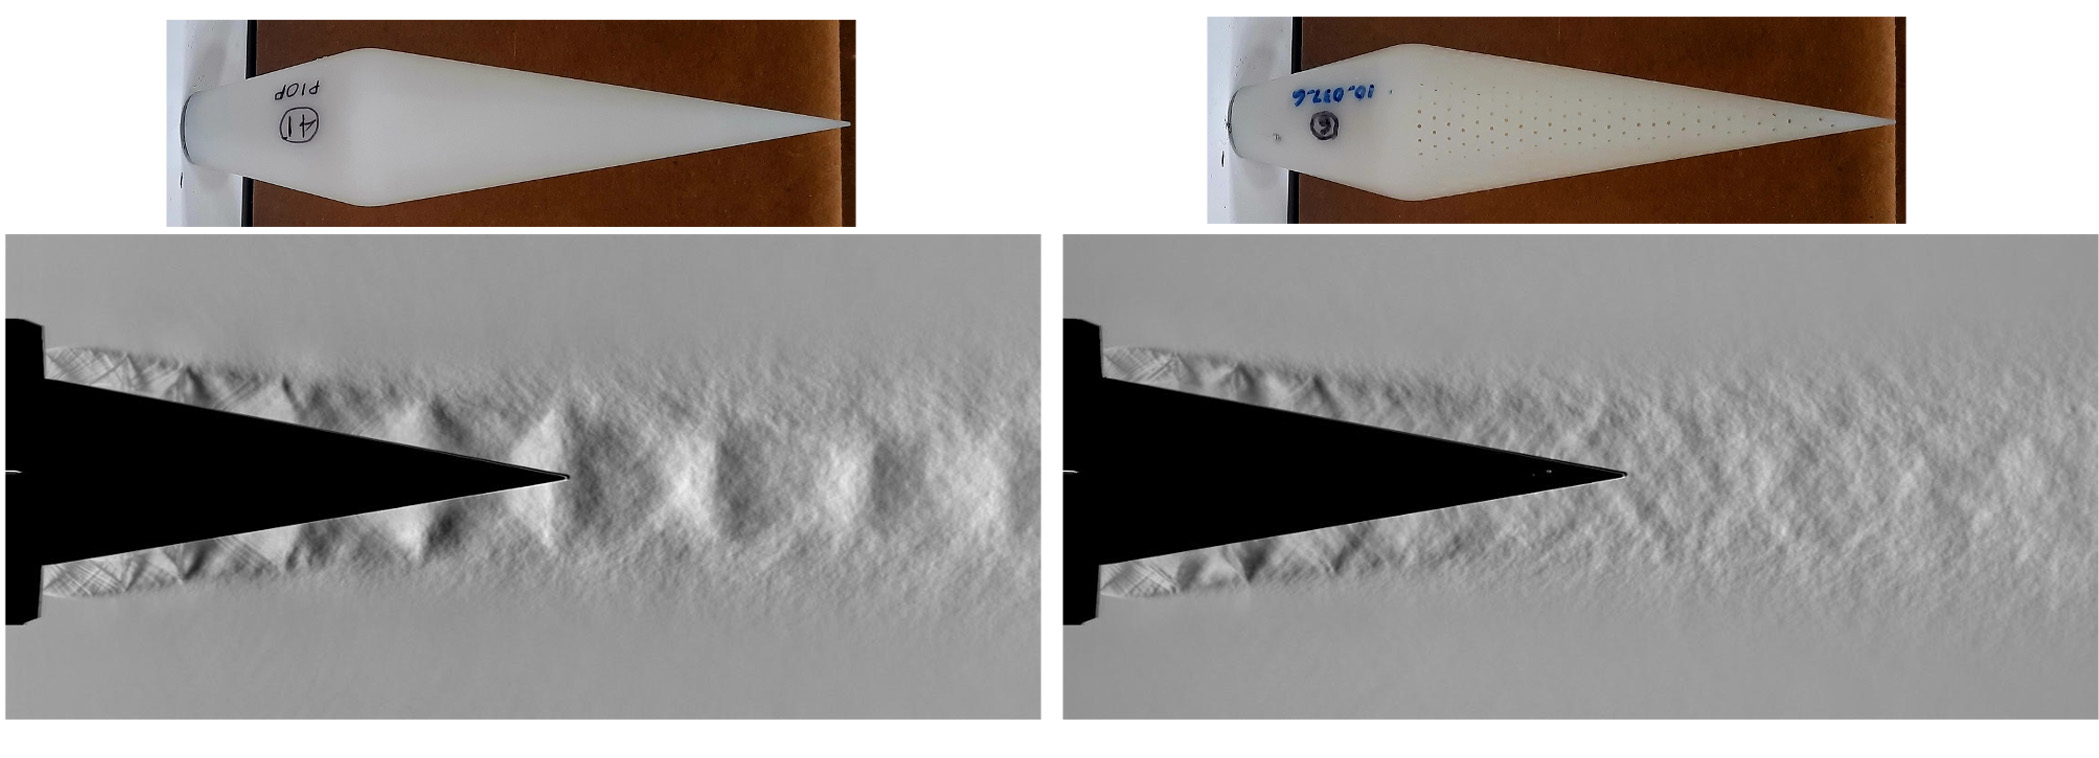
The same setup can be used for flow and noise measurements using Pitot probes, hot-wire anemometers, schlieren visualization, or microphones. Example results from a plug nozzle study are shown below. Radiated noise (sound pressure level, or SPL) spectra and schlieren images were obtained at a jet Mach number of 1.4.
The schlieren images reveal that a solid plug produces well-defined shock structures. In contrast, a plug of the same geometry with a porous surface effectively dissipates these downstream shocks, resulting in a reduction in both tonal and broadband noise.
- Korth, J. H. Burt, J. M., Zaman, K. B. M. Q., and Fagan, A., “Investigation of Physical Mechanisms for Jet Noise Reduction by Plug Nozzle Porosity”, AIAA Paper 2025-2163, Jan. 2025.
- K.B.M.Q. Zaman, A.F. Fagan and J.H. Korth, “Flow, Noise and Thrust of Supersonic Plug Nozzles”, AIAA Paper 2024-2305, Jan. 2024.
| Area of Expertise | Researcher Name | |
|---|---|---|
| Fundamental Experimental Jet Studies | Khairul Zaman | khairul.b.zaman@nasa.gov |
Turbulent Heat Flux in Exhaust Nozzles and Propulsion System Cooling
Several benchmark experiments focused on turbulent heat transport were conducted at NASA Glenn. Detailed velocity and temperature measurements were collected to support validation and refinement of turbulence models for thermal mixing flows.
Numerical modeling was carried out in parallel with the experimental campaigns. Phase I investigated measurement techniques in a small-scale tunnel cooling flow configuration.
- Wernet, M.P., “A Dual-Plane PIV Study of Turbulent Heat Transfer Flows,” NASA/TM-2016-219074, Mar. 2016.
Phase II investigated thermal transport within a subsonic axisymmetric jet.
- Locke, R.J., et al., “Rotational Raman-Based Temperature Measurements in a High-Velocity Turbulent Jet,” NASA/TM-2017-219504/REV1, Dec. 2017.
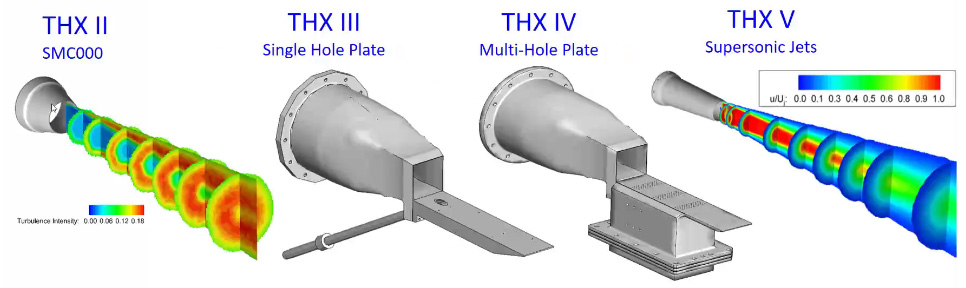
Phase III focused on a single large injector cooling hole to study fundamental physics.
- Wernet, M.P., Georgiadis, N.J., and Locke, R.J., “PIV and Rotational Raman-Based Temperature Measurements for CFD Validation in a Singe Injector Cooling Flow,” AIAA Paper 2018-3857 and NASA TM-2018-219739, Jun. 2018,
Phase IV examined three patches of smaller cooling holes arranged in a staggered pattern representative of a realistic application. This multi-hole configuration was featured in the 2021 AIAA Propulsion Aerodynamic Workshop (PAW5).
- Georgiadis, N. J., Wernet, M. P., Crowe, D. S., Woeber, C. D., Karman-Shoemake, K.C., Winkler, C.M., “Assessment of Multiphysics Computations of Flow Over A Film Cooled Plate,” Journal of Thermophysics and Heat Transfer, Articles in Advance, Mar. 2025, pp. 1-19.
- Pesich, J.M., Georgiadis, N. J., Wernet, M. P., Locke, R. J., Thurman, D. R., Poinsatte, P. E., “PIV and Rotational Raman-Based Temperature Measurements for CFD Validation of a Perforated Plate Cooling Flow: Part II,” AIAA Paper 2022-0084, Jan. 2022.
- Wernet, M. P., Georgiadis, N. J., Locke, R. J., Thurman, D., Poinsatte, P., “PIV and Rotational Raman-Based Temperature Measurements for CFD Validation of a Perforated Plate Cooling Flow: Part I,” NASA TM-2019-220227, Jan. 2020.
Pesich et al. analyzed the Phase IV configuration using a combined computational fluid dynamics (CFD) and conjugate heat transfer approach. Their results demonstrated the necessity of a fully coupled method to accurately calculate surface temperatures in film cooling configurations.
- Pesich, J. M., Georgiadis, N. J., and Wernet, M. P., “Multiphysics Computational Analysis of a Perforated Plate Cooling Flow,” AIAA Paper 2021-1447, Jan. 2021.
Phase V investigated heated supersonic axisymmetric jets and was highlighted during the 2023 AIAA Propulsion Aerodynamic Workshop (PAW6).
- Georgiadis, N.J., Wernet, M. P., Locke, R. J., and Eck, D. G., “Mach Number and Heating Effects on Turbulent Supersonic Jets,” AIAA Journal, Vol. 62, No. 1, Jan. 2024, pp. 31-51.
- Georgiadis, N. J., Wernet, M. P., Winkler, C.M., Benton, S.I., and Connolly, B.J., “Summary of the 6th Propulsion Aerodynamics Workshop Nozzle Test Case: Heated Supersonic Axisymmetric Jets,” AIAA Paper 2024-0749, Jan. 2024.
- Wernet, M. P., Georgiadis, N. J., and Locke, R. J., “Raman Temperature and Density Measurements in Supersonic Jets,” Experiments In Fluids, Vol. 62, No. 3, Mar. 2021, pp. 1-21.
- Wernet, M. P., Georgiadis, N. J., and Locke, R. J., “Velocity, Temperature, and Density Measurements in Supersonic Jets,” AIAA 2021-0596, Jan. 2021.
Three of these supersonic jet cases were also incorporated into the NASA Turbulence Modeling Resource (TMR):
- Georgiadis, N. J., Dippold, V.F., Baurle, R.A., Rumsey, C.L., “Heated Supersonic Jet Cases for the NASA Turbulence Modeling Resource,” AIAA Paper 2025-2577, Jan. 2025.
| Area of Expertise | Researcher Name | |
|---|---|---|
| Temperature and Velocity Measurements | Mark Wernet | mark.p.wernet@nasa.gov |
| Turbulent Heat Transfer Physics and Analysis | Nick Georgiadis | georgiadis@nasa.gov |
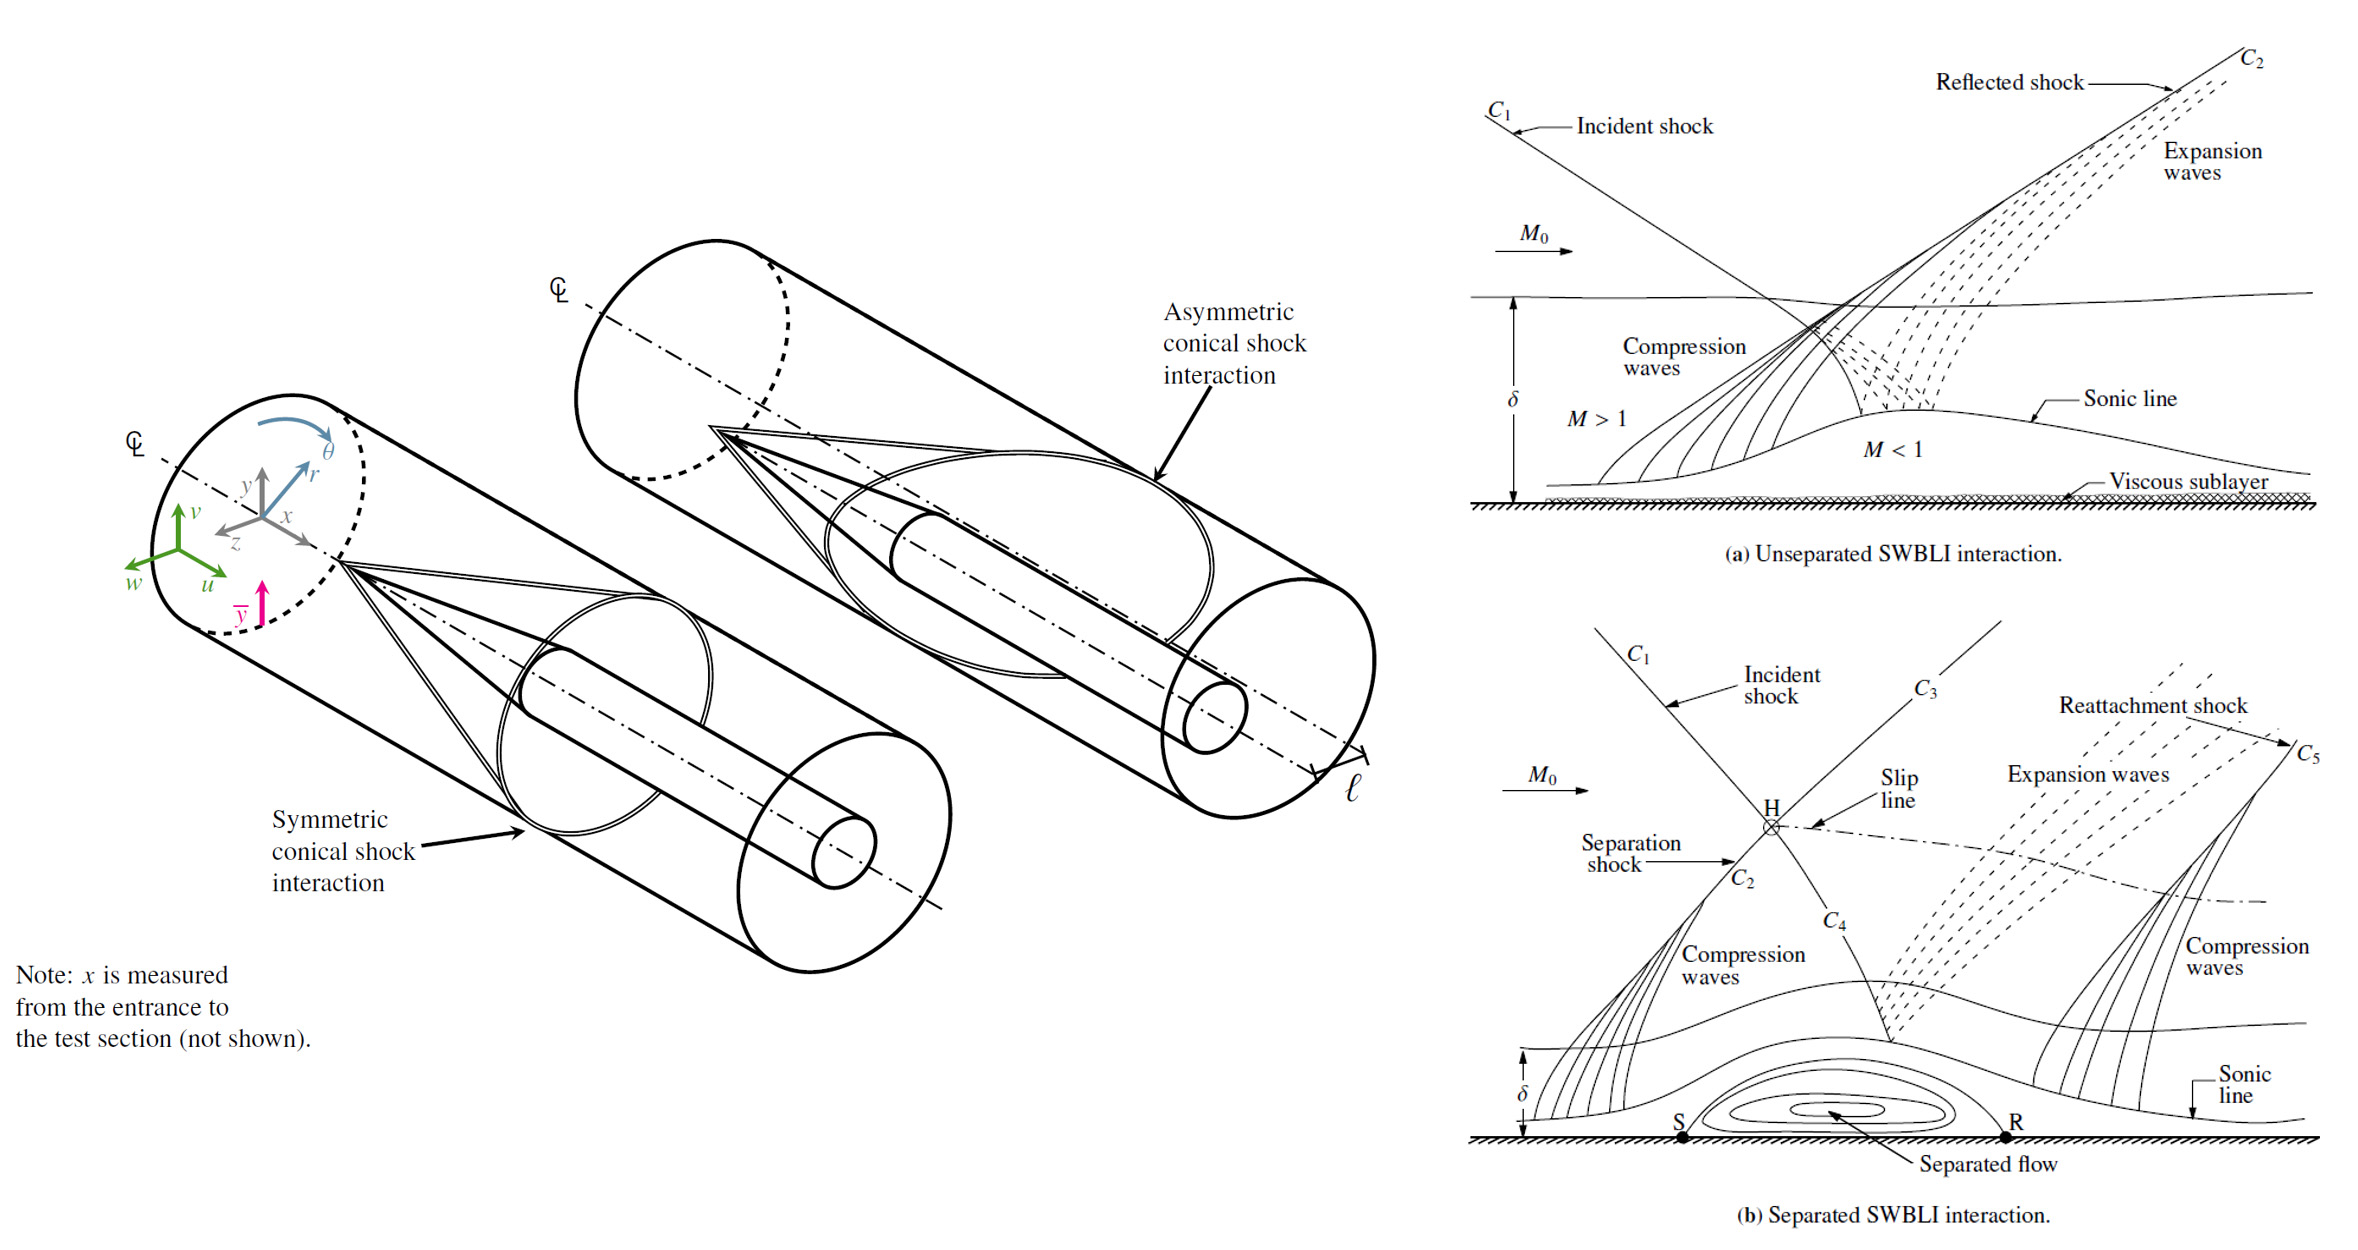
Axisymmetric Shock-Wave Boundary-Layer Interaction (SWBLI)
Shock-wave boundary-layer interaction is prominent in supersonic inlets, yet experimental data suitable for CFD validation remains limited. Documenting experiments in rectangular wind tunnels can be challenging due to three-dimensional interactions in the corner regions. To address this, an experiment was conducted at NASA Glenn using an axisymmetric configuration.
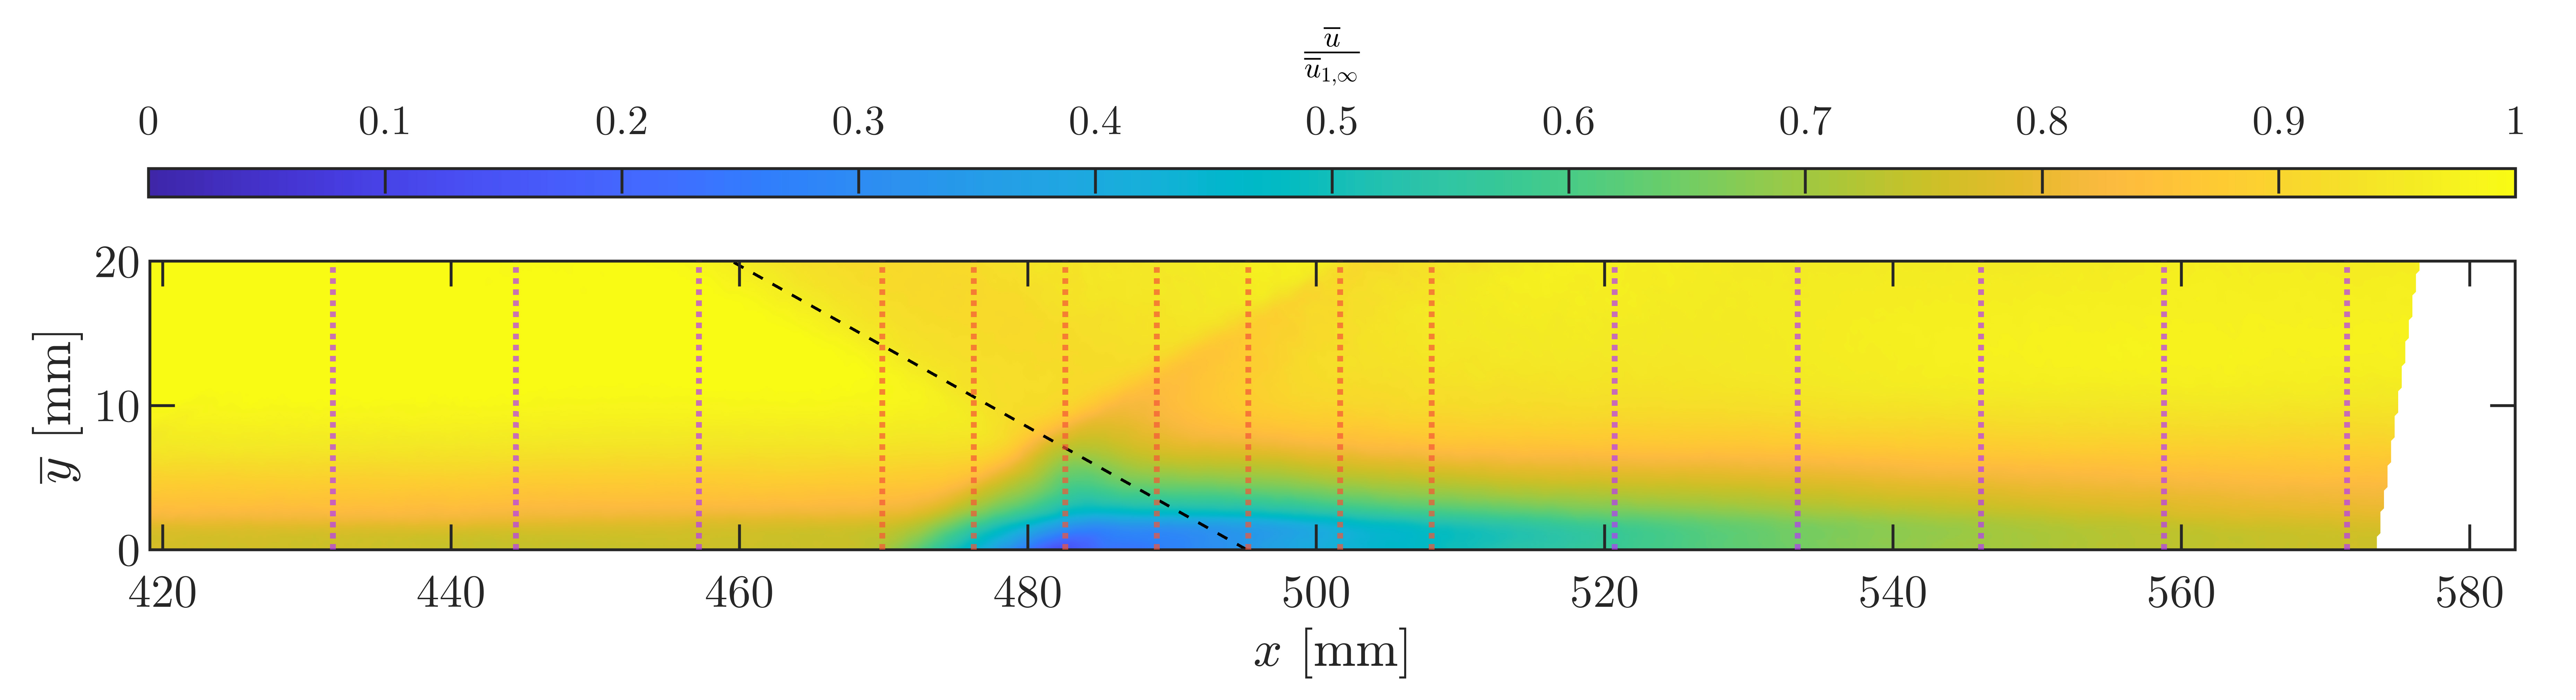
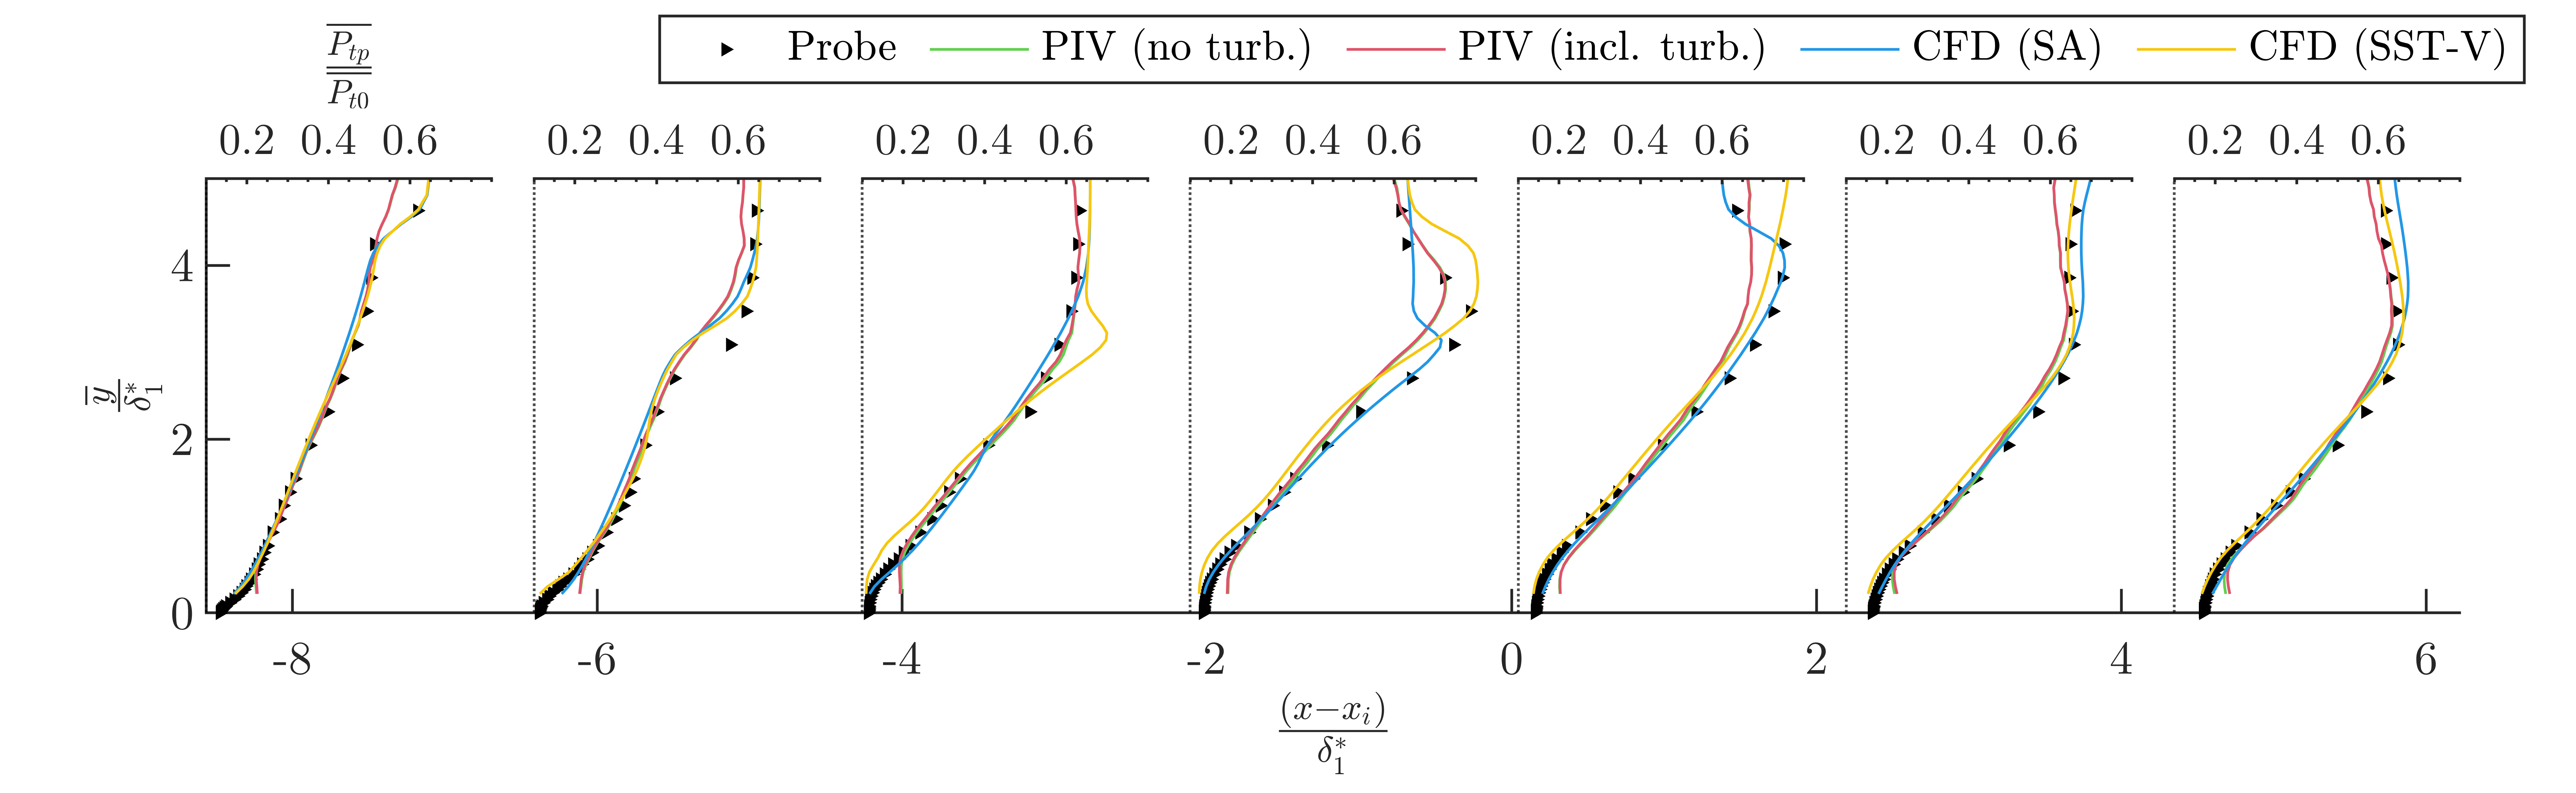
A distinguishing aspect of this test was the use of multiple measurement techniques to corroborate results. Miniature Pitot and hot-wire probes, designed for near-wall measurements, captured detailed boundary layer profiles from the undisturbed upstream flow through the interaction region. A stereoscopic particle image velocimetry (PIV) system was integrated into the test facility to enable non-intrusive, three-component velocity measurements.
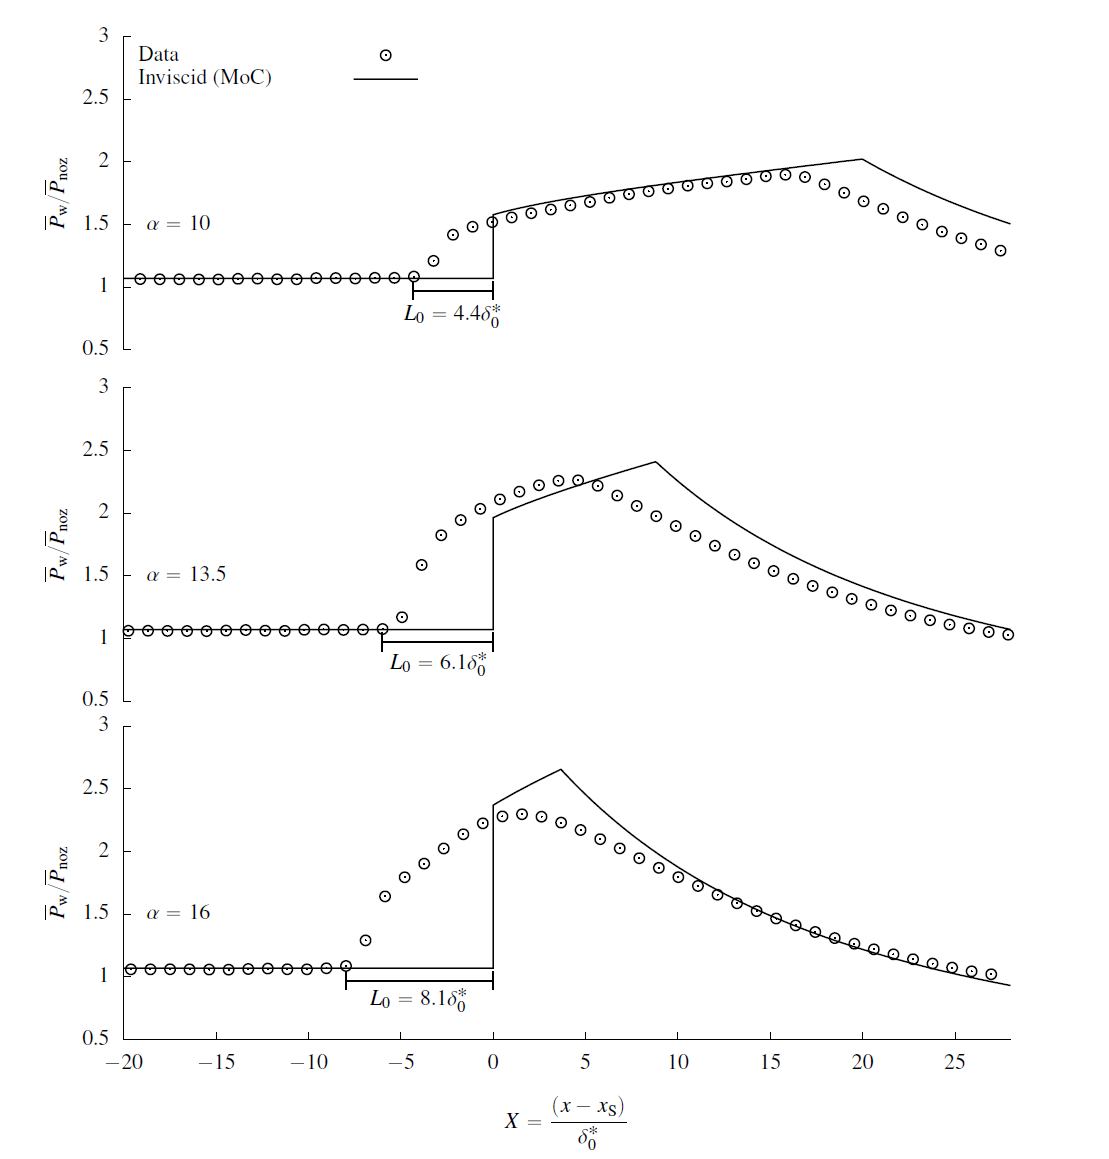
These flow field data were further supported by high-resolution wall pressure taps, oil flow visualization, pressure-sensitive paint, and surface-stress-sensitive films. The resulting dataset has been used in comparisons with several CFD studies of the same flow field.
- Reising, H. H., “Turbulent Shock-Wave/Boundary-Layer Interactions Without Sidewall Effects at Mach 2.5, 3.0, and 3.5 — PIV Measurements from 2024 Test Entry,” NASA/TM−20250004046, Apr. 2025
- Reising, H. H., Sasson, J. S., Davis, D. O., Friedlander, D. F., and Howerton, L. W., “Cross-Measurement Comparisons for a CFD Validation Dataset on Mach 2.5 Axisymmetric Turbulent Shock-Wave/Boundary-Layer Interactions,” Conference Paper, AIAA SciTech Forum 2025, Jan. 2025.
- Reising, H. H., and Davis, D. O., “PIV Measurements of Shock-Wave/Boundary-Layer Interactions at Mach 2.5 in a Circular Test Section,” Conference Paper, AIAA SciTech Forum 2024, Jan. 2024.
- Reising, H. H., and Davis, D. O., “Development and Assessment of a New Particle Image Velocimetry System in the NASA GRC 225 cm2 Wind Tunnel,” Conference Paper, AIAA SciTech Forum 2023, Jan. 2023.
- Sasson, J., Reising, H. H., Davis, D. O., and Barnhart, P. J., “Summary of a Mach 2.5 Shock Wave Turbulent Boundary Layer Interaction Experiment in a Circular Test Section,” Conference Paper AIAA SciTech Forum, Jan. 2023.
- Woike, M. R., Davis, D. O., Clem, M. M., and Crafton, J., “The Investigation of Shock Wave Boundary Layer Interactions Using Fast Pressure Sensitive Paint and Surface Stress Sensitive Film Measurement Techniques,” Conference Paper, AIAA Aviation Forum 2017, Jun. 2017.
- Davis, D.O., “CFD Validation Experiment of a Mach 2.5 Axisymmetric Shock-Wave/Boundary-Layer Interaction,” NASA TM-2015-218841, Sep. 2015.
| Area of Expertise | Researcher Name | |
|---|---|---|
| Probe Measurements | David Davis | david.o.davis@nasa.gov |
| Non-intrusive Measurements | Heath Reising | heath.reising@nasa.gov |
Read More About Inlets and Nozzles
Physics Modeling and Validation
Improvements in physical modeling and the validation of these methods are critical to advancing numerical simulation capabilities.
Design and Analysis Software
A range of advanced software tools is used to support the design, analysis, and testing of inlets and nozzles for aerospace propulsion systems.
Support of Flight Demonstration Projects
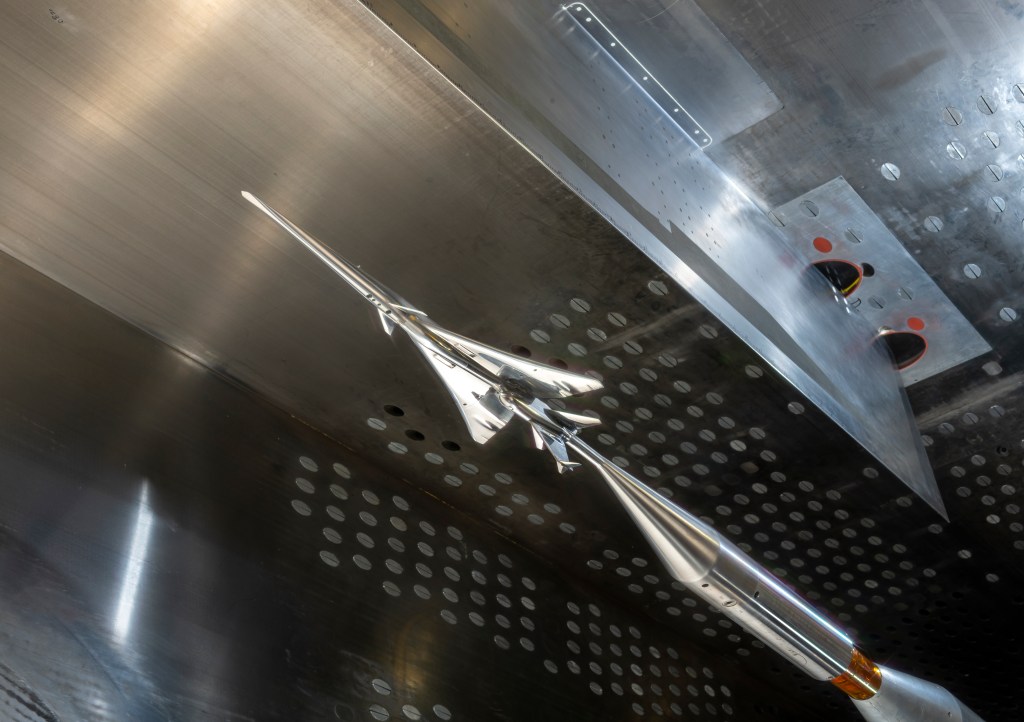
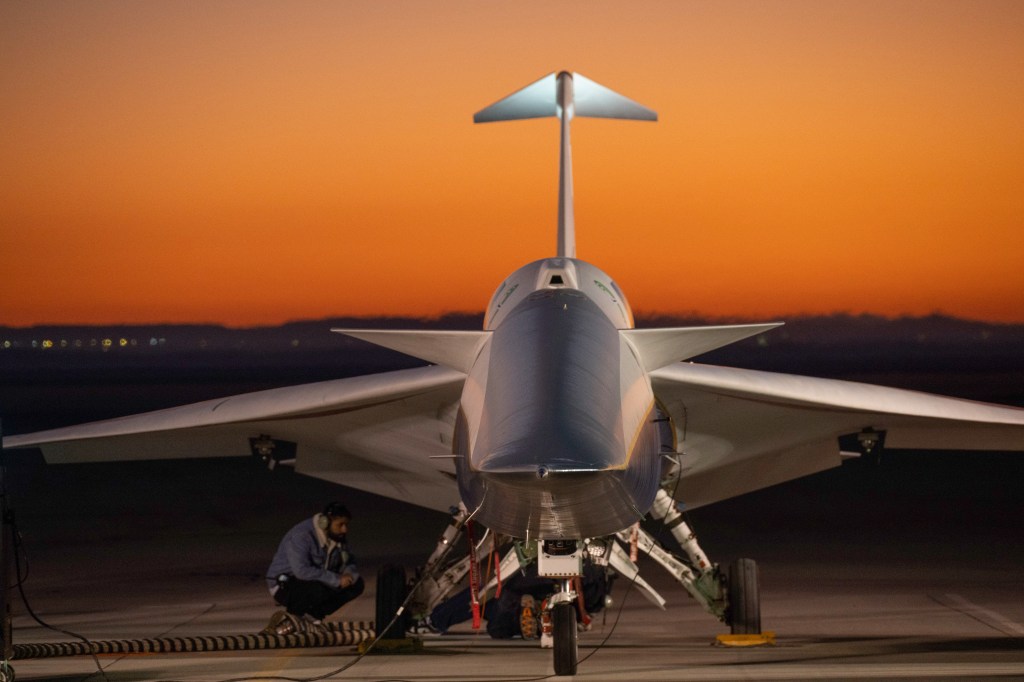
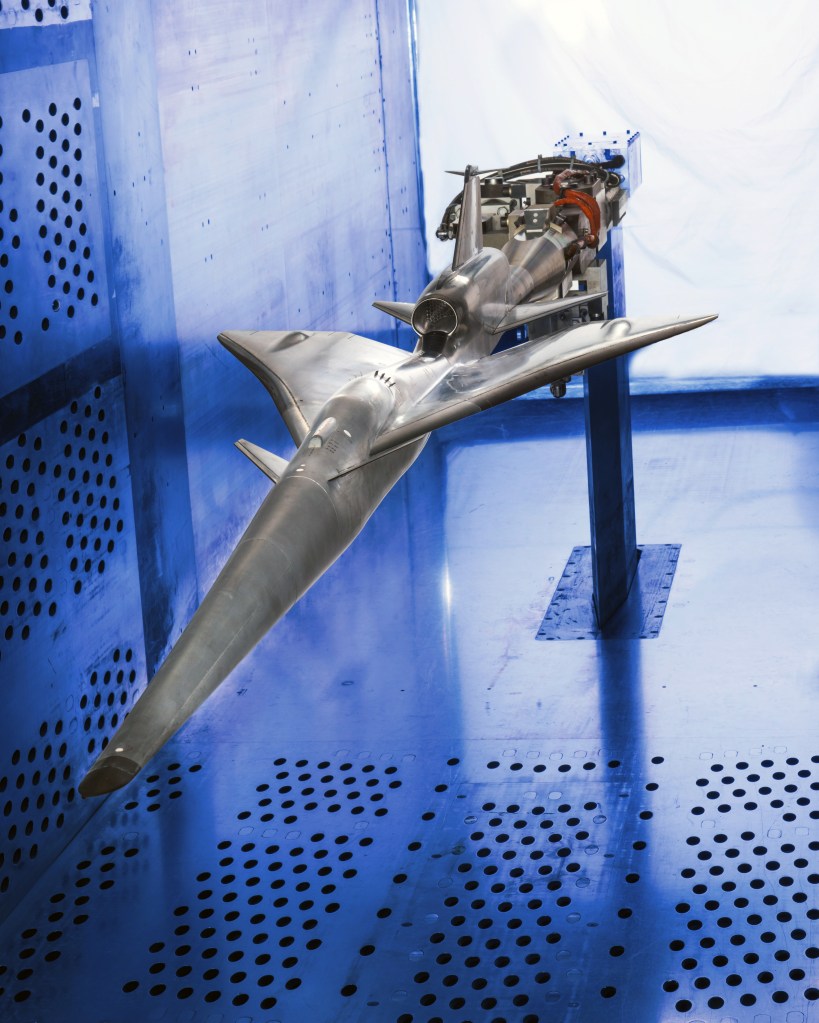
Computational fluid dynamics, wind tunnel tests, real-time displays, and system integration support X-59 supersonic flight.
Inlets and Nozzles
NASA is advancing inlets and nozzles for aircraft engines and aerospace applications through research supporting commercial, military aircraft, and space propulsion systems.
Return