


Scientists are using information from NASA’s Earth-observing satellites, on-the-ground sensors and computer-based datasets to study the environmental, economic and societal impacts of the COVID-19 pandemic. In addition, the agency’s Earth Science Division recently sponsored new projects to examine how the shutdowns in response to the pandemic are changing the environment, especially the atmosphere, and determine what, if any, natural environmental phenomena might impact the spread of the pandemic.
“NASA has a unique role to play in response to this crisis,” said John Haynes, NASA’s program manager for Health and Air Quality Applications. “As we continue to collect Earth-observing satellite data on a global scale, we can aid in the understanding of global changes resulting from the pandemic, as well as investigate potential environmental signals that may influence the spread of COVID-19.”
NASA recently funded two new rapid-turnaround projects focused on COVID-19. Jennifer Kaiser at Georgia Institute of Technology in Atlanta and Elena Lind at Virginia Polytechnic Institute in Blacksburg, are examining the pandemic’s impact on air quality related to reduced airport traffic. Joanna Joiner and Bryan Duncan at NASA’s Goddard Space Flight Center in Greenbelt, Maryland, are creating maps and images that show how COVID-19 has reduced air pollution across the world.
Air traffic in the time of COVID-19
“The world’s response to the pandemic is an unintended experiment that is giving us a chance to test our understanding of various air pollution emission sources,” said Barry Lefer, NASA’s program scientist for tropospheric composition.
Kaiser’s research is looking at how COVID-19 travel bans and lockdown orders are impacting air quality around airports. Current conditions create a unique opportunity to study airport-related pollutants, especially nitrogen dioxide and formaldehyde. It’s a footprint that will likely gradually return to its former shape as travel policies are relaxed.
“People are looking at COVID-19 impacts and seeing better air quality with less traffic,” Kaiser said. They might wonder if this is what the future could look like if we relied more heavily on electric vehicles than we do now. Yet, airplanes are not going to be electric anytime soon, Kaiser said.
“Airports are usually some of the hottest spots for nitrogen dioxide,” Kaiser said. Nitrogen dioxide is released when we burn fuel, either in airplanes or cars. When first released into the lower atmosphere, or the part of the atmosphere that we breathe, nitrogen dioxide reacts with other nearby chemicals and forms ozone. Airplane exhaust also forms formaldehyde, which is an indicator of ozone formation and another air toxin. Breathing in ozone can cause chest pain, coughing and throat irritation.
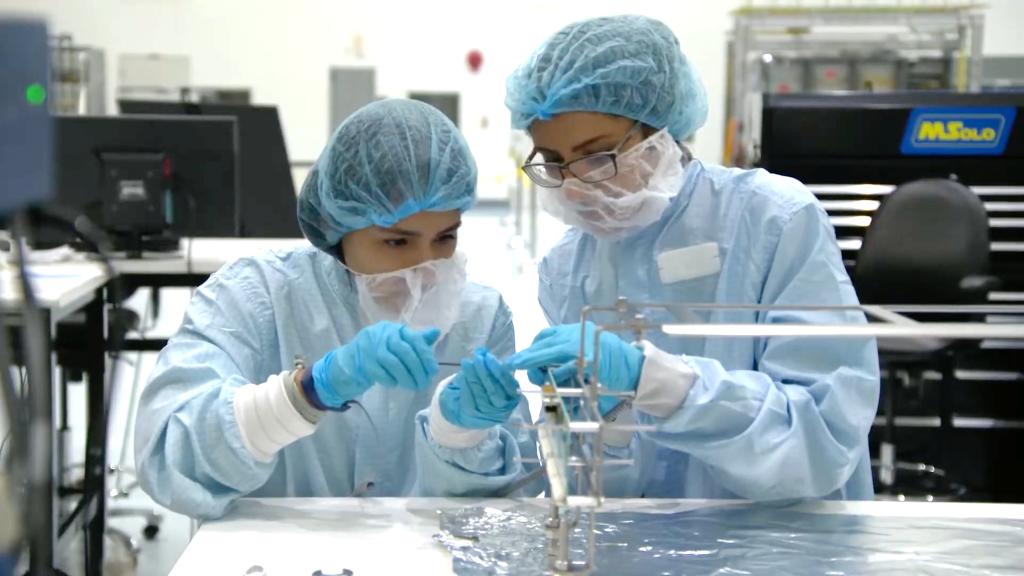
Kaiser and her team installed two sensors at both Baltimore-Washington International Airport (BWI) and Hartsfield-Jackson Atlanta International Airport. BWI’s overall traffic is down by around 60 percent and Atlanta’s is down by 70 percent.
The sensors, which are part of NASA’s Pandora Project, each use a spectrometer to identify chemicals in the air. Two instruments, each propped up with a tripod, sit at both airports. Their spectrometers use ultraviolet and visible wavelengths of light to detect ozone, nitrogen dioxide and formaldehyde at different altitudes of the atmosphere.
Kaiser is comparing the on-the-ground sensor information with satellite information from the European Space Agency (ESA)’s TROPOspheric Monitoring Instrument (TROPOMI), aboard the Copernicus Sentinel-5 Precursor satellite, launched in 2017 and managed by the European Commission in partnership with ESA, the EU Member States and EU agencies. She wants to know if we’re understanding the satellite data accurately for these locations by ground truthing them with the newly-installed Pandora sensors.
“We want to help our stakeholders, like policymakers, improve their understanding of the air we breathe,” Kaiser said, and how that air can be affected by pollution from airports.
Revealing lower fossil fuel emissions from space
Joiner and Duncan at NASA Goddard are also revealing lower nitrogen dioxide levels in the air, but on a global scale. Both work with data from the Dutch-Finnish Ozone Monitoring Instrument (OMI) aboard NASA’s Aura satellite (launched in 2004) to help reveal how COVID-19 policies are impacting air quality. OMI is a precursor to TROPOMI. Although TROPOMI provides higher resolution information, OMI has a longer record.
“We’re looking at changes in nitrogen dioxide to understand how economies are changing,” Duncan said. “If the amount of pollution emitted continues to grow over time, your economy is likely booming,” he said, but noted that pollution can decrease even as coal use remains the same because of improvements in efficiency and the implementation of emission control devices.
https://svs.gsfc.nasa.gov/4810
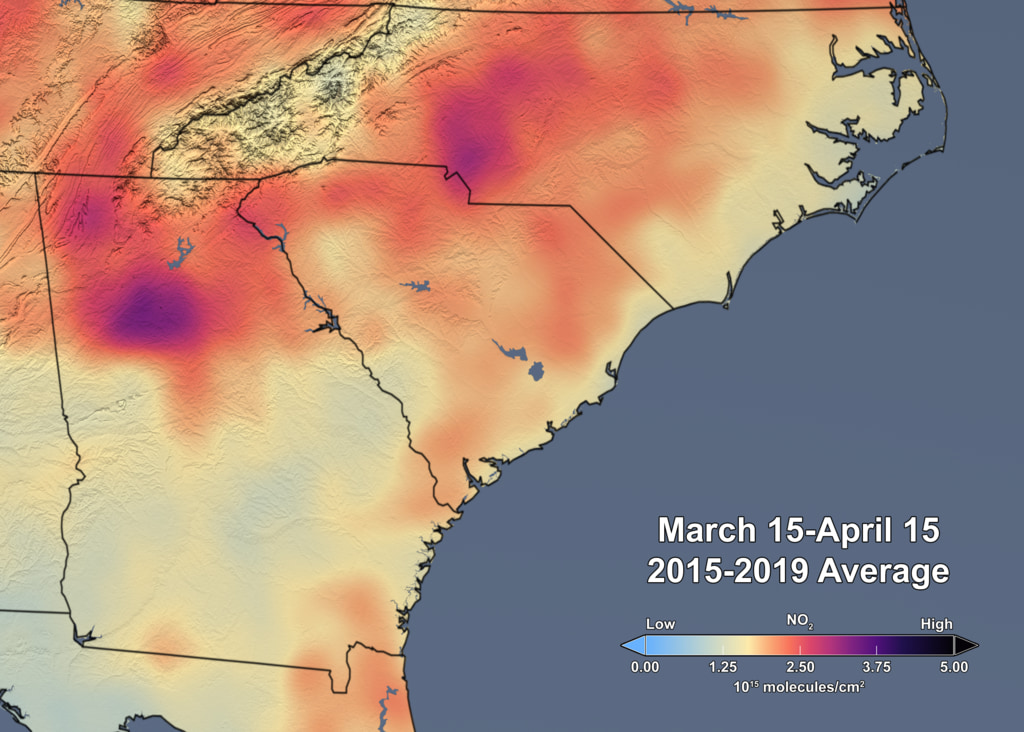
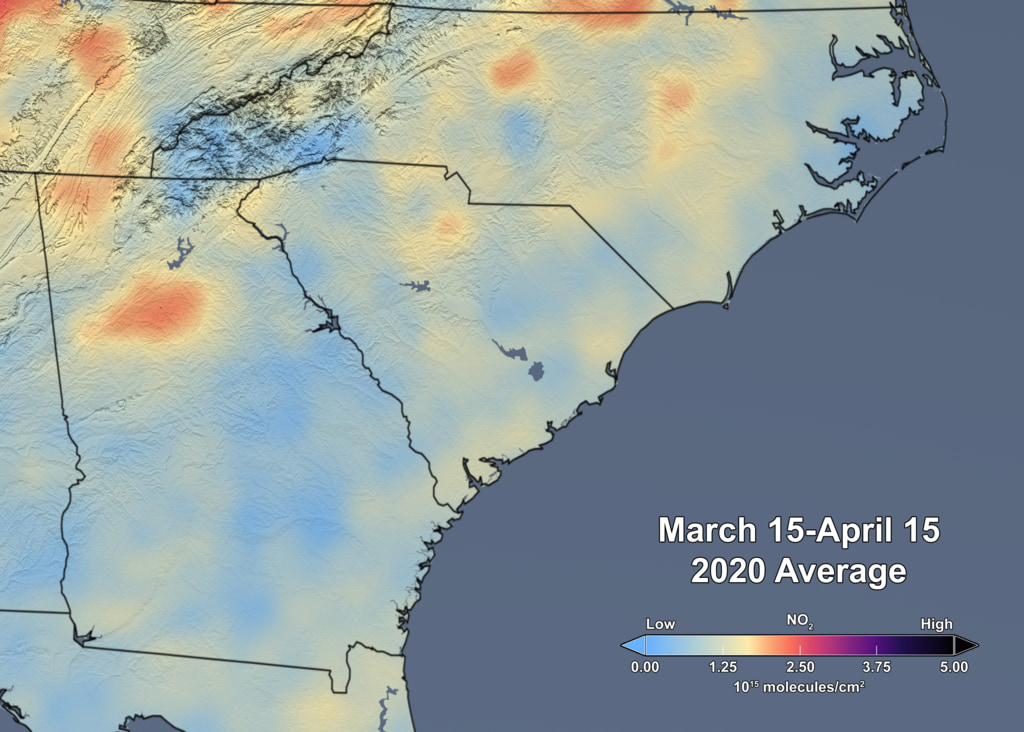
“When we started to hear about China shutting down, we started looking for changes in the nitrogen dioxide signal,” Duncan said. NASA’s Earth Observatory published an image from the TROPOMI instrument in early March 2020, showing a dramatic decrease.
The OMI team decided to make more data like this accessible to scientists, economists and health professionals to help them understand how atmospheric chemistry is changing, how economies are shrinking and whether lockdowns are effective for specific areas, Duncan said.
“We already had tools in place to do this kind of monitoring because we also monitor gases, like sulfur dioxide, related to volcanic eruptions,” Joiner said. However, while volcanoes have very obvious signals that are easy to see in the satellite data, COVID-related impacts are harder to see.
“The nitrogen dioxide isn’t very high to begin with, so changes are subtle,” Joiner said. “We need to determine if a change is due to weather, like wind, or if a change is due to decreases in transportation.”
With additional NASA funding, Joiner and Duncan are developing different ways to present new information. They put together a comparison of data from this year to an average of data from the five previous years. Their team wants to know when changes in nitrogen dioxide begin relative to different government actions. OMI’s record of data goes back to 2005.
“We have a good, long record to compare our current year to,” Joiner said.
https://svs.gsfc.nasa.gov/4810
Changing seasons during COVID-19
Ben Zaitchik at Johns Hopkins University in Baltimore is investigating a question on many peoples’ minds: Will COVID-19 cases decrease in the summer because of the weather?
“Although cases will likely decrease as we move into summer, we want to know how much of that change is due to social-distancing policies and lockdown orders versus higher temperatures and humidity,” Kaitchik said.
Zaitchik’s COVID-19 focused research builds on his prior NASA-funded work studying how enteric infectious diseases spread. Enteric diseases, like cholera, are intestinal.
COVID-19, however, is an infectious respiratory disease. Although the diseases infect humans differently, they both may be affected by the weather. By applying Earth satellite data to public health data related to COVID-19, Zaitchik will be able to note if there are any significant links. For example, do cases decrease as temperature or humidity rise?
Zaitchik’s team is using data on temperature, precipitation, and other weather and climate information from a NASA data set called MERRA-2, short for Modern-Era Retrospective analysis for Research and Applications, Version 2. Once they find any potential links between weather and COVID-19 cases, they’ll verify them with higher resolution satellite data.
The team will pull in information about precipitation from the Global Precipitation Measurement mission (jointly run by the Japan Aerospace Exploration Agency and NASA), temperature from the MODerate Resolution Imaging Spectroradiometer (MODIS) instrument aboard NASA’s Earth Observing System Terra and Aqua satellites, and soil moisture and the water cycle from NASA’s Soil Moisture Active Passive mission (SMAP).
“We have the full arsenal of Earth observations at our disposal,” Zaitchik said. Furthermore, Zaitchik is working with the team behind the Johns Hopkins COVID-19 Dashboard. The dashboard displays information about the number of people infected, deceased and recovered due to the virus. “We have this big database that is collected by people around the world,” Zaitchik said.
“Right now, policymakers are observing trends while implementing policies,” Zaitchik said. “But there are so many unknowns right now.” The time between research and public discussion has been incredibly shortened, he noted. “People come out with a study and immediately it’s on the front page,” Zaitchik said.
If the team finds a link between weather and cases of COVID-19, it will influence how we think about this in terms of a potential second wave of cases during the fall, Zaitchik said. “And if there isn’t a link, we still need to know,” Zaitchik said.
For more information on NASA’s Earth Science and other efforts related to COVID-19, visit: