


The Surface Water and Ocean Topography mission offers the first taste of the detailed perspectives of Earth’s surface water that its cutting-edge instruments will be able to capture.
The Surface Water and Ocean Topography mission offers the first taste of the detailed perspectives of Earth’s surface water that its cutting-edge instruments will be able to capture.
The international Surface Water and Ocean Topography (SWOT) mission – led by NASA and the French space agency Centre National d’Études Spatiales (CNES) – has sent back some of its first glimpses of water on the planet’s surface, showing ocean currents like the Gulf Stream in unprecedented detail. SWOT is also capturing views of freshwater features such as lakes, rivers, and other water bodies down to about 300 feet (100 meters) wide.
The satellite will measure the elevation of nearly all the water on Earth’s surface and provide one of the most comprehensive surveys yet of our planet’s surface water. SWOT’s measurements of freshwater bodies and the ocean will provide insights into how the ocean influences climate change and the water cycle; how a warming world affects water storage in lakes, rivers, and reservoirs; and how communities can better manage their water resources and prepare for floods and other disasters.
“SWOT’s advanced imagery will empower researchers and advance the way we manage fresh water and the effects of sea level rise across the globe,” said NASA Administrator Bill Nelson. “Water is one of our planet’s most important resources – and it’s proven to be vulnerable to the impacts of climate change. SWOT will provide critical information that communities can use to prepare for the impacts of a warming climate.”
A Whole New View
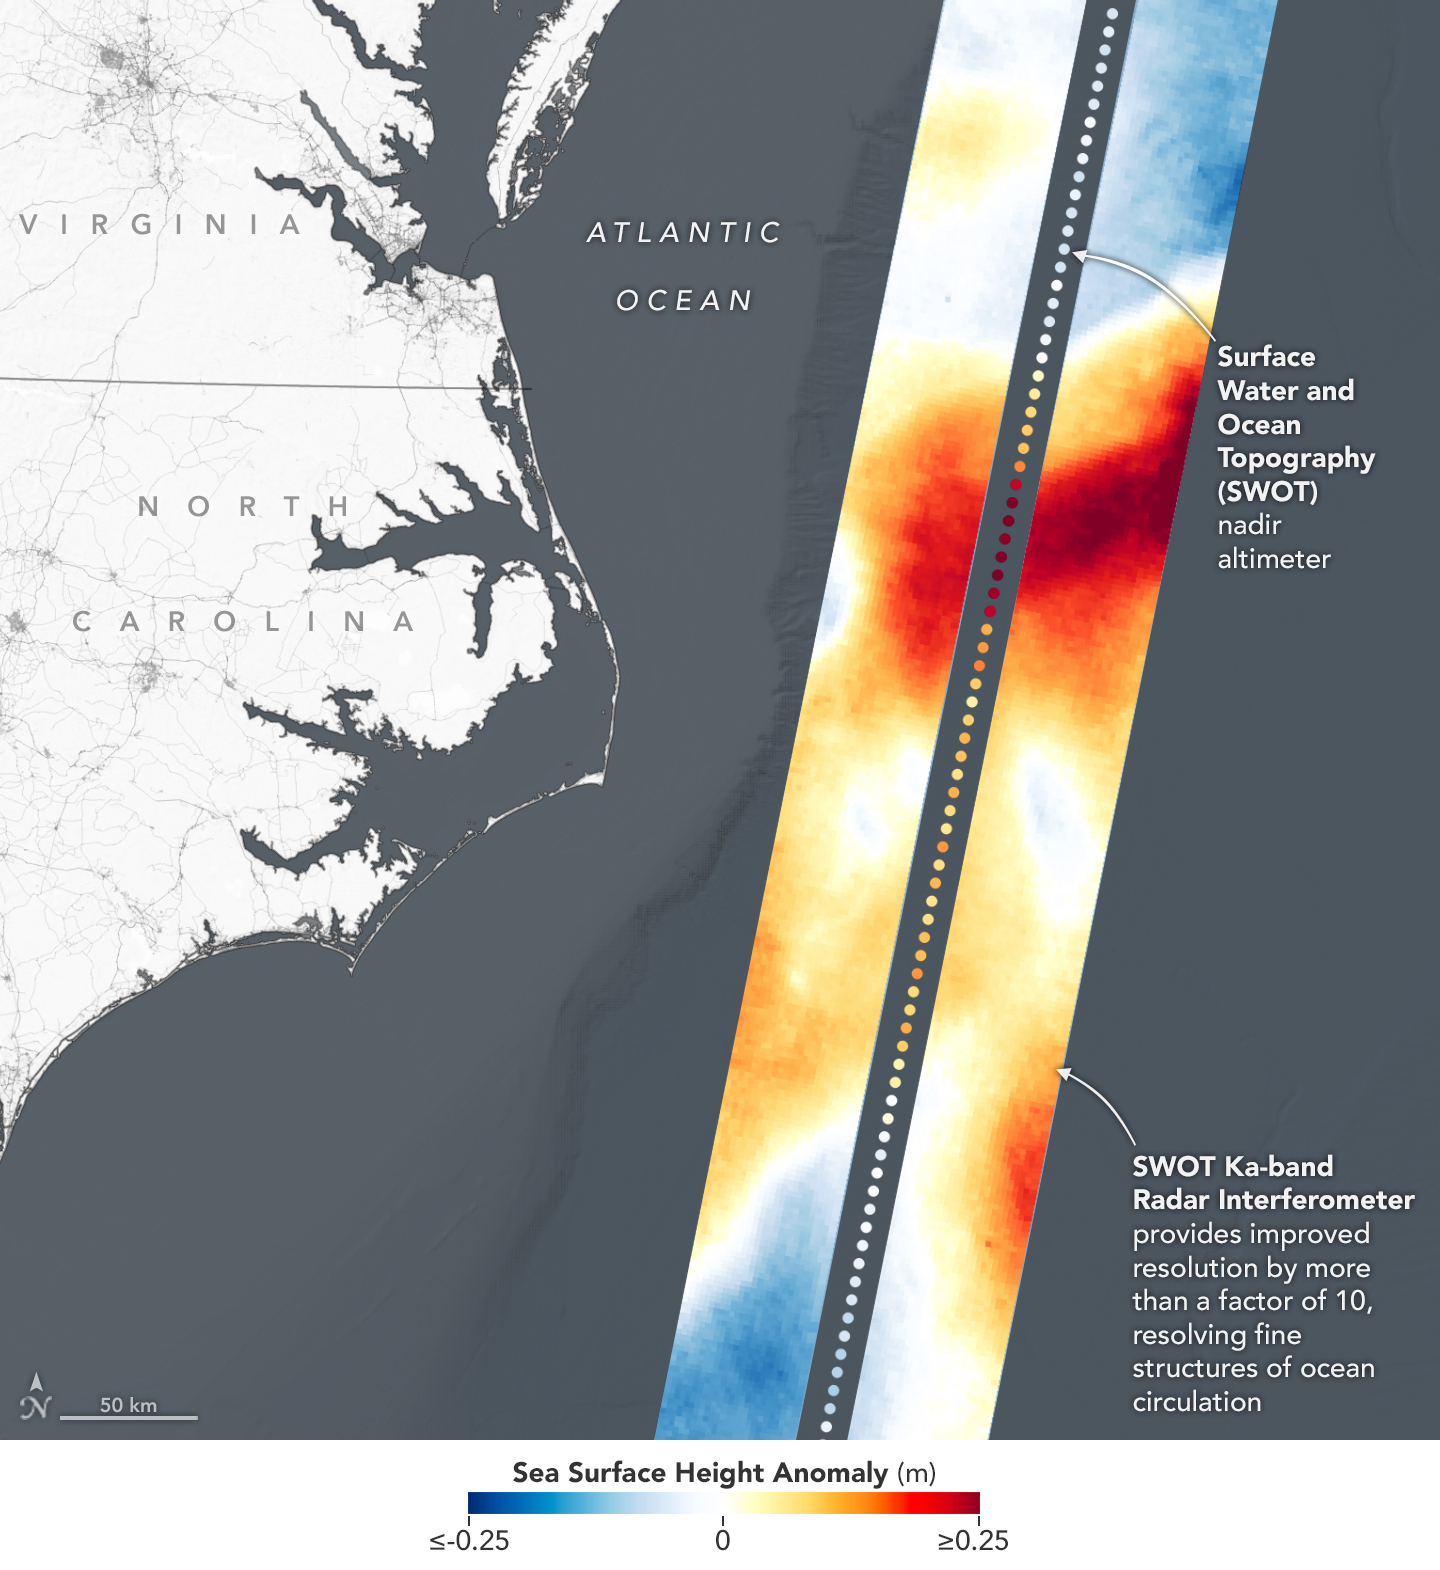
As seen in these early images, on Jan. 21, 2023, SWOT measured sea level in a part of the Gulf Stream off the coast of North Carolina and Virginia. The two antennas of SWOT’s Ka-band Radar Interferometer (KaRIn) instrument acquired data that was mapped as a pair of wide, colored strips spanning a total of 75 miles (120 kilometers) across. Red and orange areas in the images represent sea levels that are higher than the global average, while the shades of blue represent sea levels that are lower than average.
For comparison, the new data is shown alongside sea surface height data taken by space-based instruments called altimeters. The instruments – widely used to measure sea level – also bounce radar signals off of Earth’s surface to collect their measurements. But traditional altimeters are able to look only at a narrow beam of Earth directly beneath them, unlike KaRIn’s two wide-swath strips that observe sea level as a two-dimensional map.
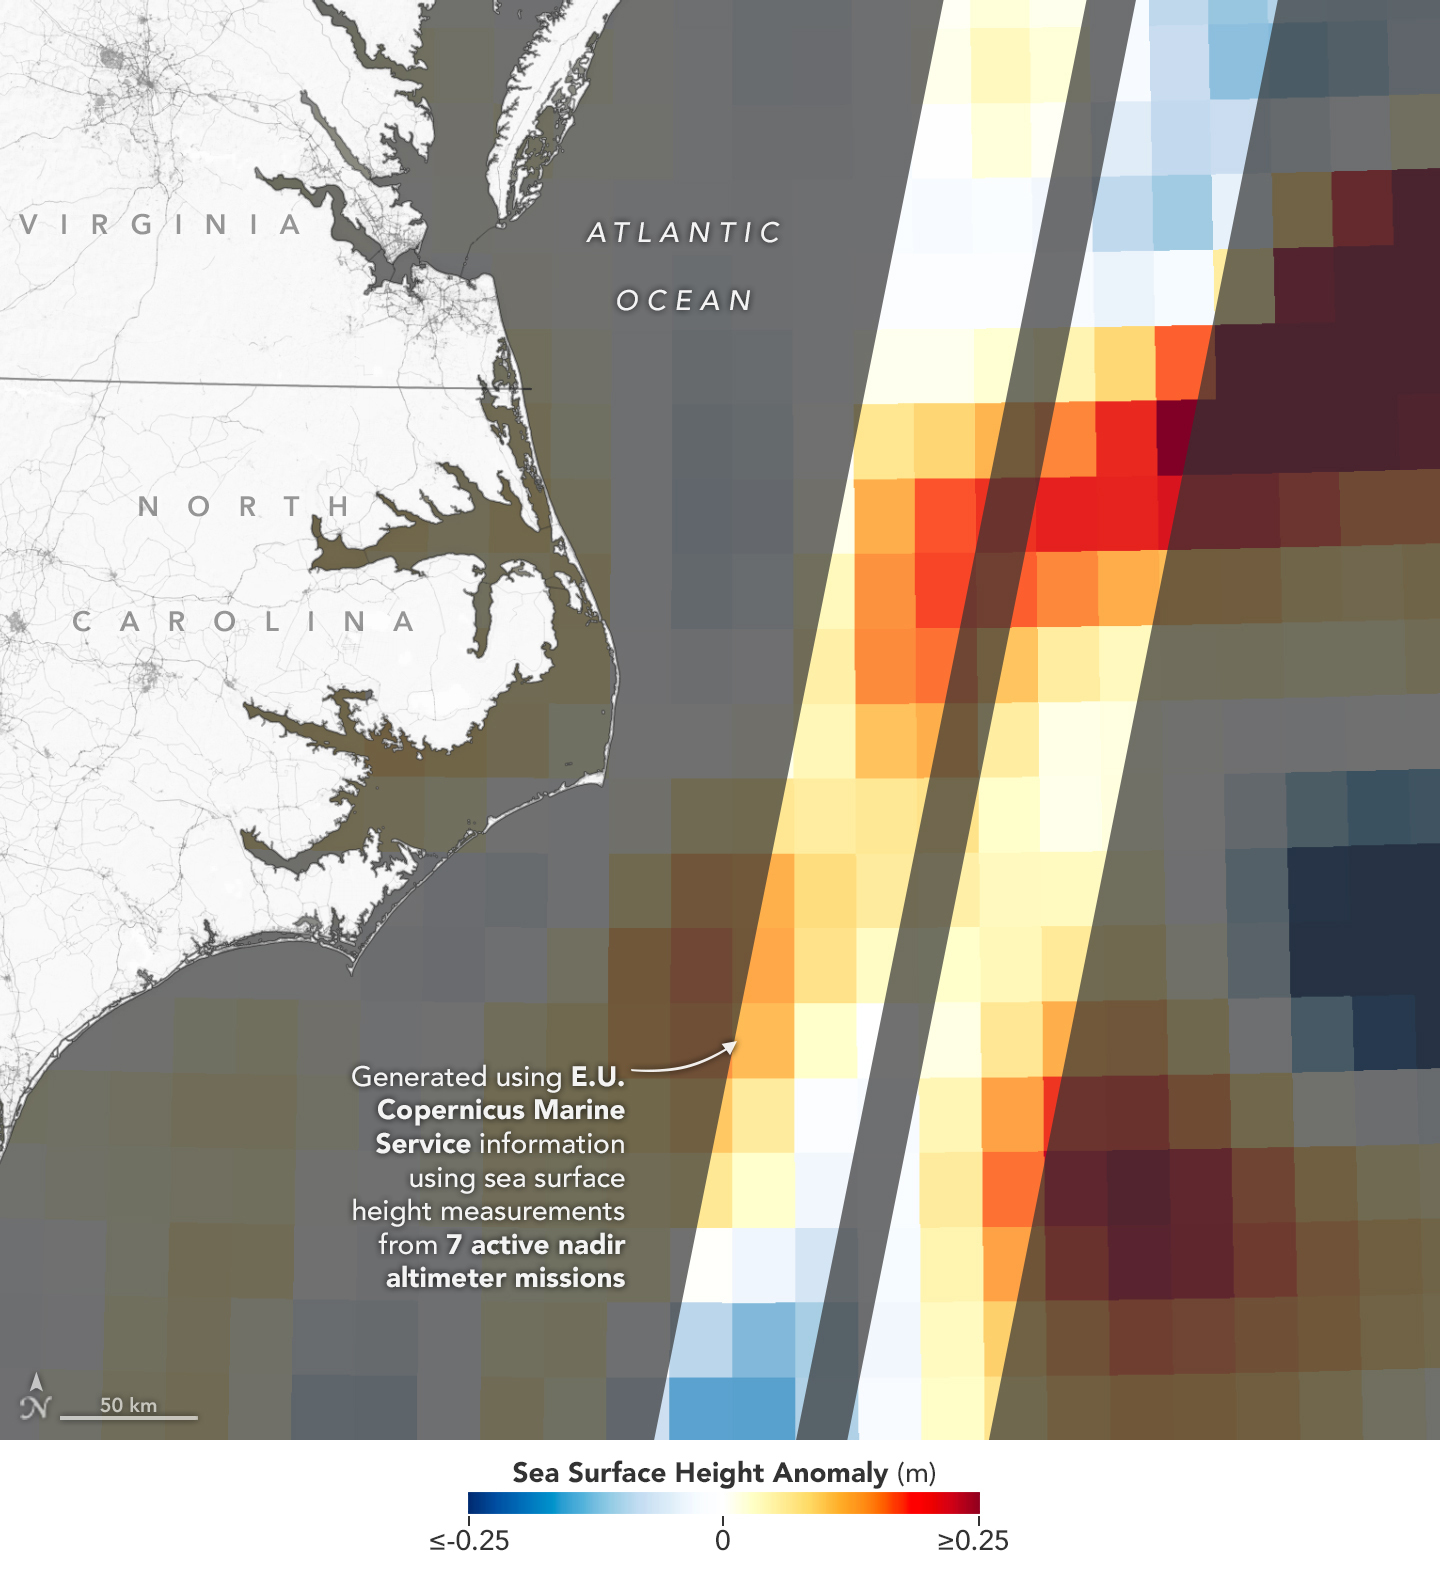
The spatial resolution of SWOT ocean measurements is 10 times greater than the composite of sea surface height data gathered over the same area by seven other satellites: Sentinel-6 Michael Freilich, Jason-3, Sentinel-3A and 3B, Cryosat-2, Altika, and Hai Yang 2B. The composite image was created using information from the Copernicus Marine Service of ESA (European Space Agency) and shows the same day as the SWOT data.
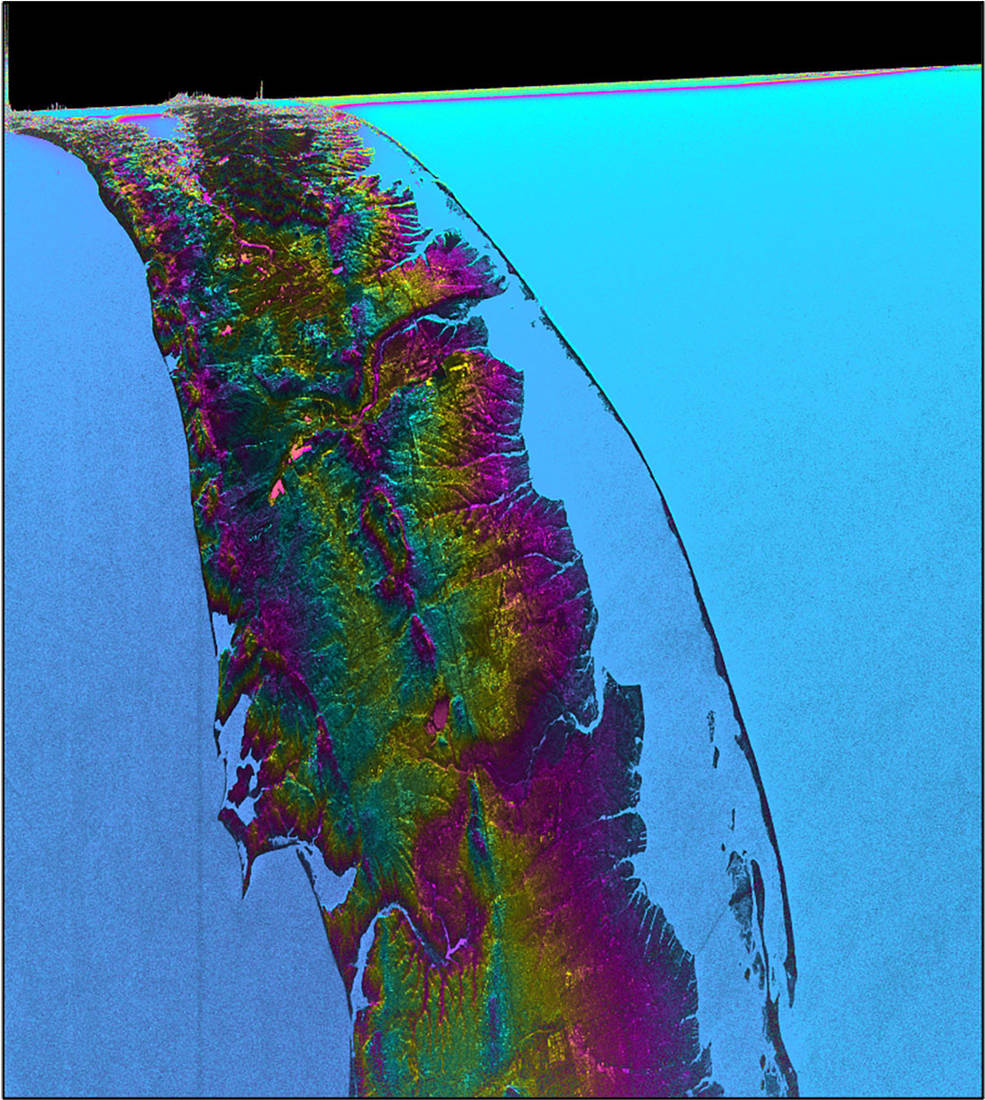
KaRIn also measured the elevation of water features on Long Island – shown as bright pink splotches nestled within the landscape. (Purple, yellow, green, and blue shades represent different land elevations.)
“Our ability to measure freshwater resources on a global scale through satellite data is of prime importance as we seek to adjust to a changing climate,” said CNES Chairman and CEO Philippe Baptiste. “In this respect, the first views from SWOT give us a clearer picture than ever before. These data will prove highly valuable for the international scientific community in the fields of hydrology, oceanography, and coastal studies.”
This initial inland image is a tantalizing indication of how SWOT can measure details of smaller lakes, ponds, and rivers in ways that satellites could not before. Such data will be used to produce an extraordinary accounting of the freshwater on Earth’s surface in ways useful to researchers, policymakers, and water resource managers.
“The KaRIn instrument took years to develop and build, and it will collect information on bodies of water across the globe – data that will be freely and openly available to everybody who needs it,” said Parag Vaze, SWOT project manager at NASA’s Jet Propulsion Laboratory in Southern California.
More About the Mission
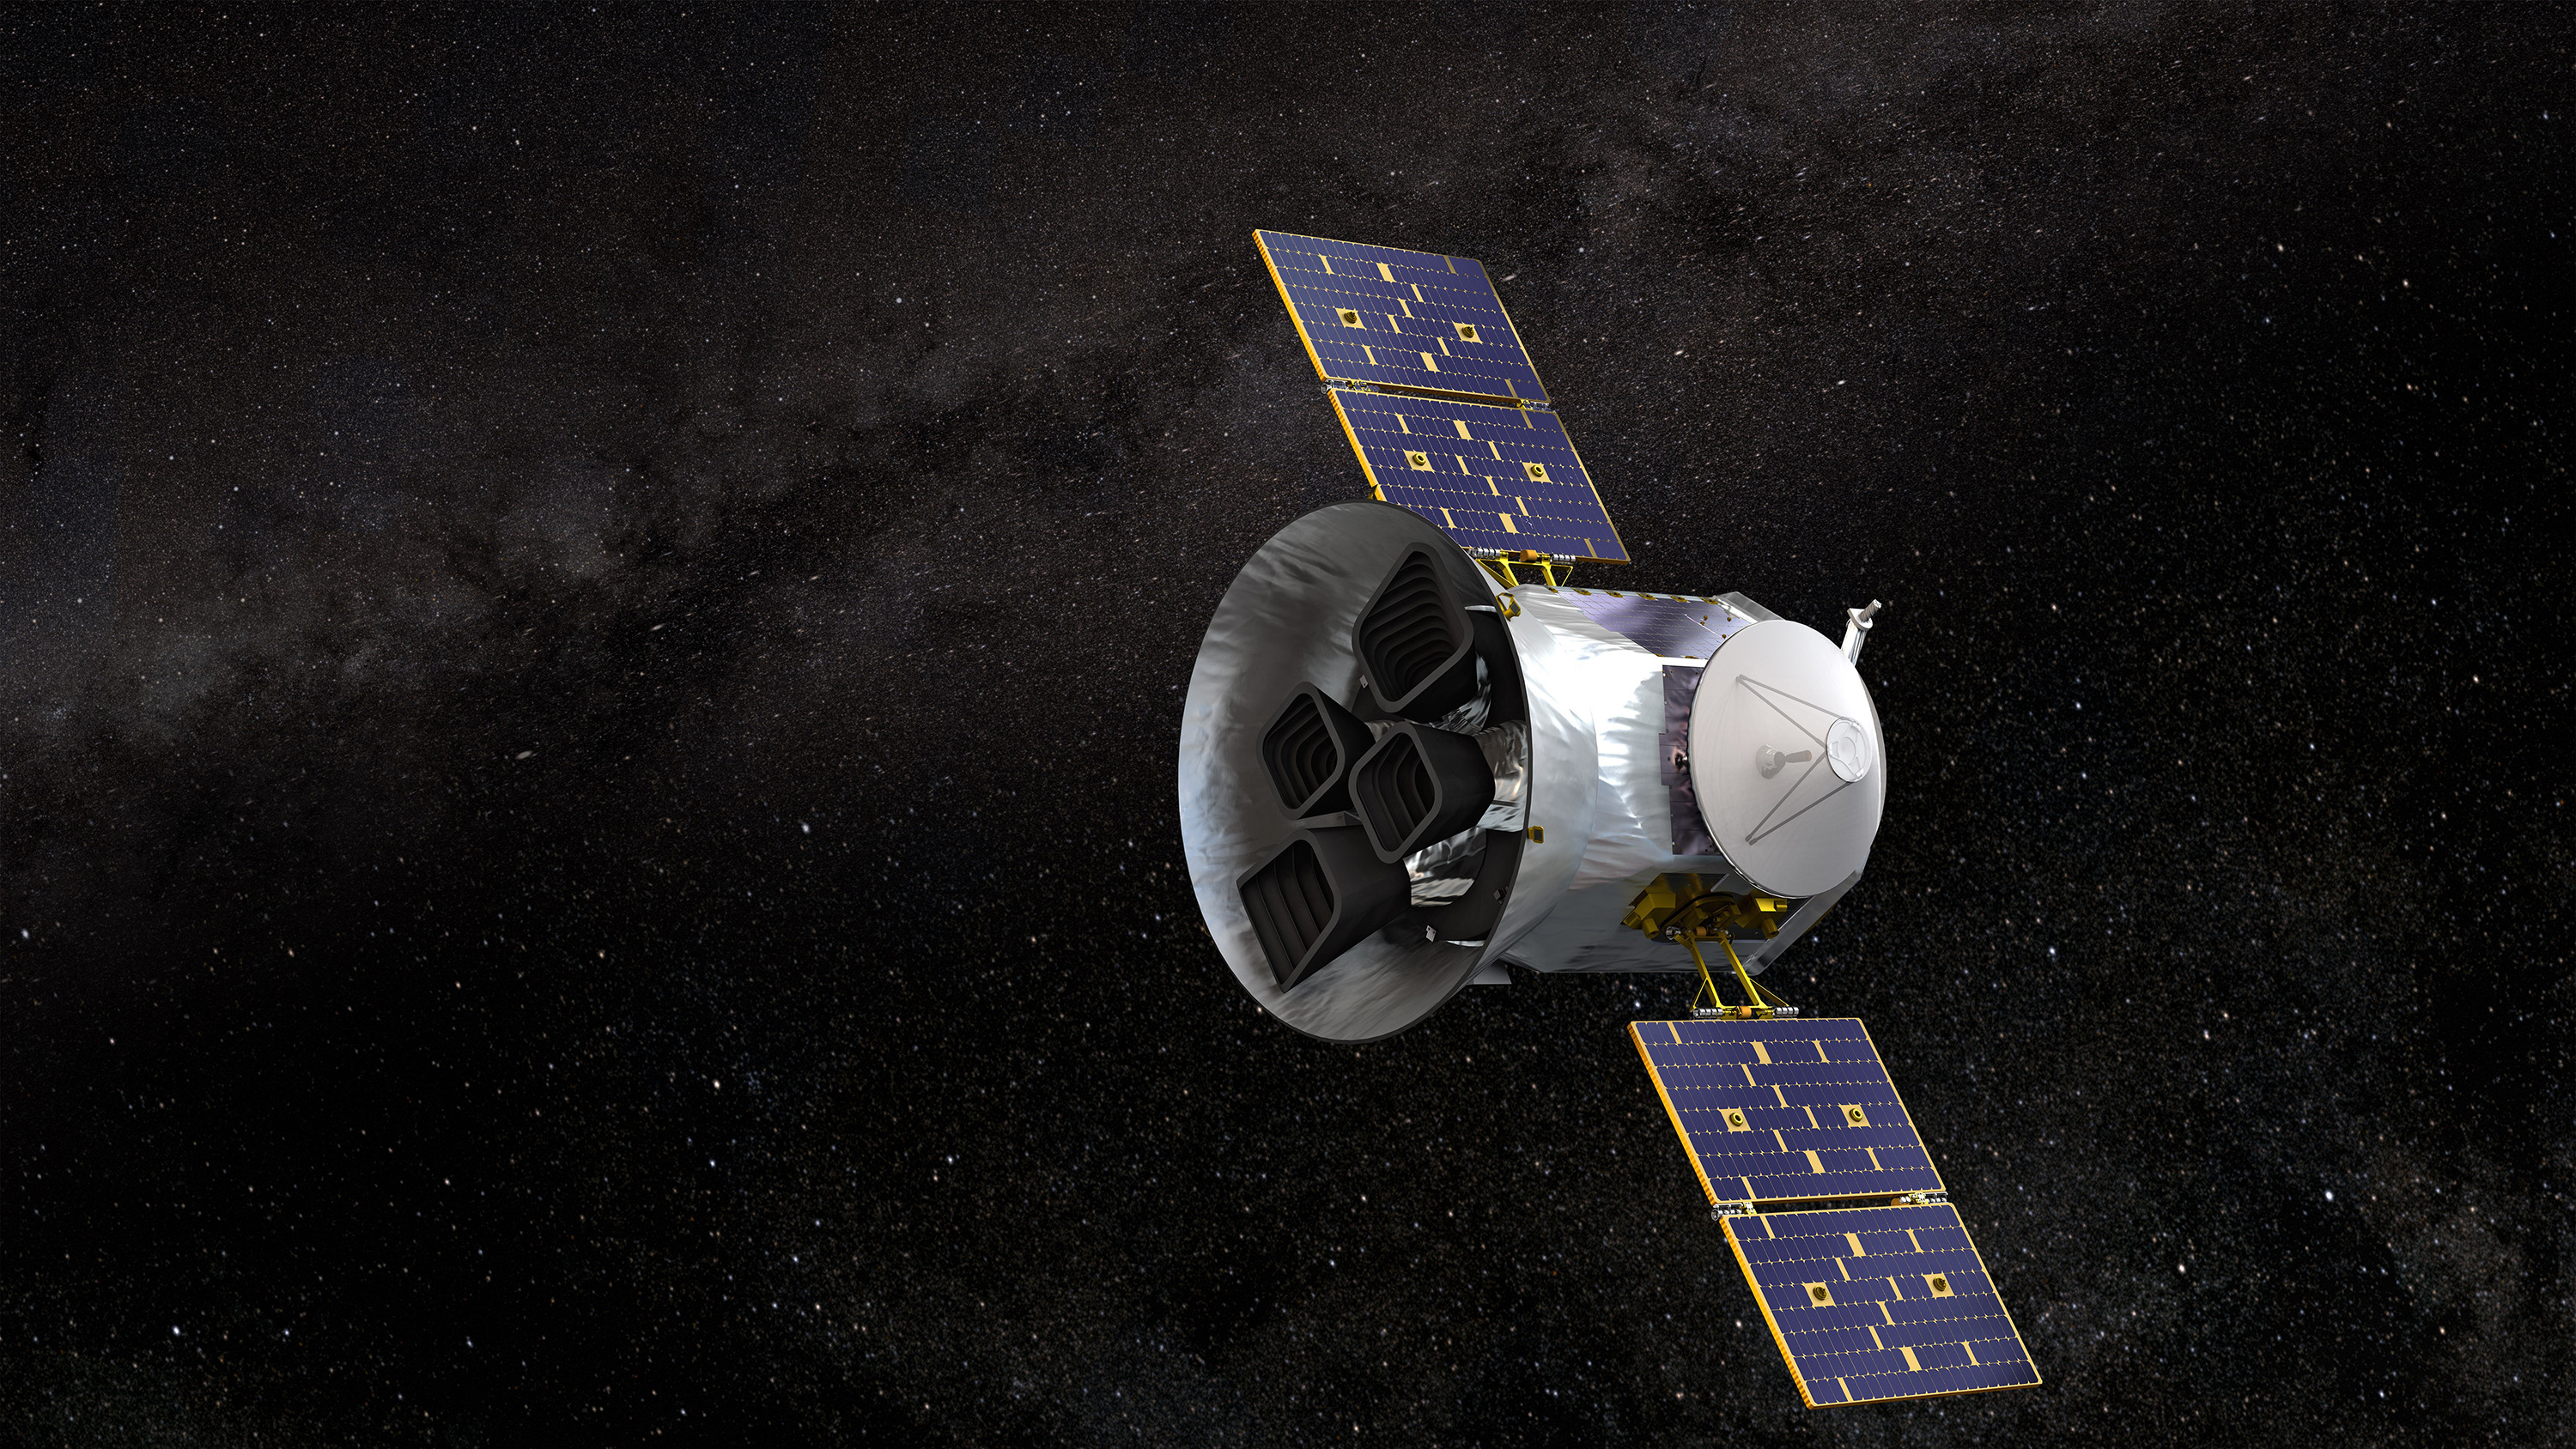
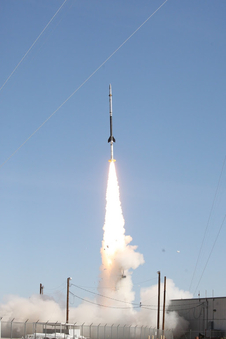
Launched on Dec. 16, 2022, from Vandenberg Space Force Base in central California, SWOT is now in a period of commissioning, calibration, and validation. Engineers are checking out the performance of the satellite’s systems and science instruments before the planned start of science operations in summer 2023.
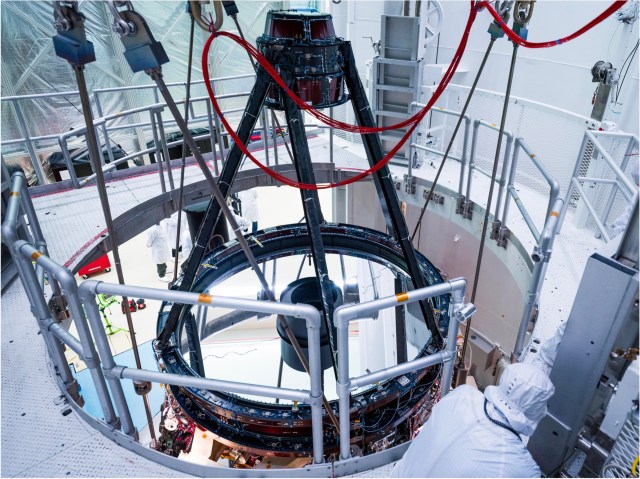
The data for these first images was collected by SWOT’s KaRIn instrument, the scientific heart of the satellite. KaRIn has one antenna at each end of a boom that’s 33 feet (10 meters) long. This enables the instrument to look off to either side of a center line directly below the satellite as it bounces microwave signals off Earth’s surface. The returning radar signals arrive at each antenna slightly out of sync, or phase, from one another. When these signals are combined with other information about the antennas and the satellite’s altitude, scientists will be able to map the height of water on Earth’s surface with never-before-seen clarity. KaRIn encountered an issue earlier this year with one of its subsystems; engineers have now resolved the situation, and the instrument is up and running.
SWOT was jointly developed by NASA and CNES, with contributions from the Canadian Space Agency (CSA) and the UK Space Agency. JPL, which is managed for NASA by Caltech in Pasadena, California, leads the U.S. component of the project. For the flight system payload, NASA provided the KaRIn instrument, a GPS science receiver, a laser retroreflector, a two-beam microwave radiometer, and NASA instrument operations. CNES provided the Doppler Orbitography and Radioposition Integrated by Satellite (DORIS) system, the dual frequency Poseidon altimeter (developed by Thales Alenia Space), the KaRIn radio-frequency subsystem (together with Thales Alenia Space and with support from the UK Space Agency), the satellite platform, and ground operations. CSA provided the KaRIn high-power transmitter assembly. NASA provided the launch vehicle and the agency’s Launch Services Program, based at Kennedy Space Center, managed the associated launch services.
To learn more about SWOT, visit:
Jane J. Lee / Andrew Wang
Jet Propulsion Laboratory, Pasadena, Calif.
818-354-0307 / 626-379-6874
jane.j.lee@jpl.nasa.gov / andrew.wang@jpl.nasa.gov
2023-041