


Life. It’s the one thing that, so far, makes Earth unique among the thousands of other planets we’ve discovered. Since the fall of 1997, NASA satellites have continuously and globally observed all plant life at the surface of the land and ocean. During the week of Nov. 13-17, NASA is sharing stories and videos about how this view of life from space is furthering knowledge of our home planet and the search for life on other worlds.
NASA satellites can see our living Earth breathe.
In the Northern Hemisphere, ecosystems wake up in the spring, taking in carbon dioxide and exhaling oxygen as they sprout leaves — and a fleet of Earth-observing satellites tracks the spread of the newly green vegetation.
Meanwhile, in the oceans, microscopic plants drift through the sunlit surface waters and bloom into billions of carbon dioxide-absorbing organisms — and light-detecting instruments on satellites map the swirls of their color.
This fall marks 20 years since NASA has continuously observed not just the physical properties of our planet, but the one thing that makes Earth unique among the thousands of other worlds we’ve discovered: Life.
Satellites measured land and ocean life from space as early as the 1970s. But it wasn’t until the launch of the Sea-viewing Wide Field-of-view Sensor (SeaWiFS) in 1997 that the space agency began what is now a continuous, global view of both land and ocean life. A new animation captures the entirety of this 20-year record, made possible by multiple satellites, compressing a decades-long view of life on Earth into a captivating few minutes.
“These are incredibly evocative visualizations of our living planet,” said Gene Carl Feldman, an oceanographer at NASA’s Goddard Space Flight Center in Greenbelt, Maryland. “That’s the Earth, that is it breathing every single day, changing with the seasons, responding to the Sun, to the changing winds, ocean currents and temperatures.”
Credits: NASA’s Goddard Space Flight Center
Download this video in HD formats from NASA Goddard’s Scientific Visualization Studio
The space-based view of life allows scientists to monitor crop, forest and fisheries health around the globe. But the space agency’s scientists have also discovered long-term changes across continents and ocean basins. As NASA begins its third decade of global ocean and land measurements, these discoveries point to important questions about how ecosystems will respond to a changing climate and broad-scale changes in human interaction with the land.
Satellites have measured the Arctic getting greener, as shrubs expand their range and thrive in warmer temperatures. Observations from space help determine agricultural production globally, and are used in famine early warning detection. As ocean waters warm, satellites have detected a shift in phytoplankton populations across the planet’s five great ocean basins — the expansion of “biological deserts” where little life thrives. And as concentrations of carbon dioxide in the atmosphere continue to rise and warm the climate, NASA’s global understanding of plant life will play a critical role in monitoring carbon as it moves through the Earth system.
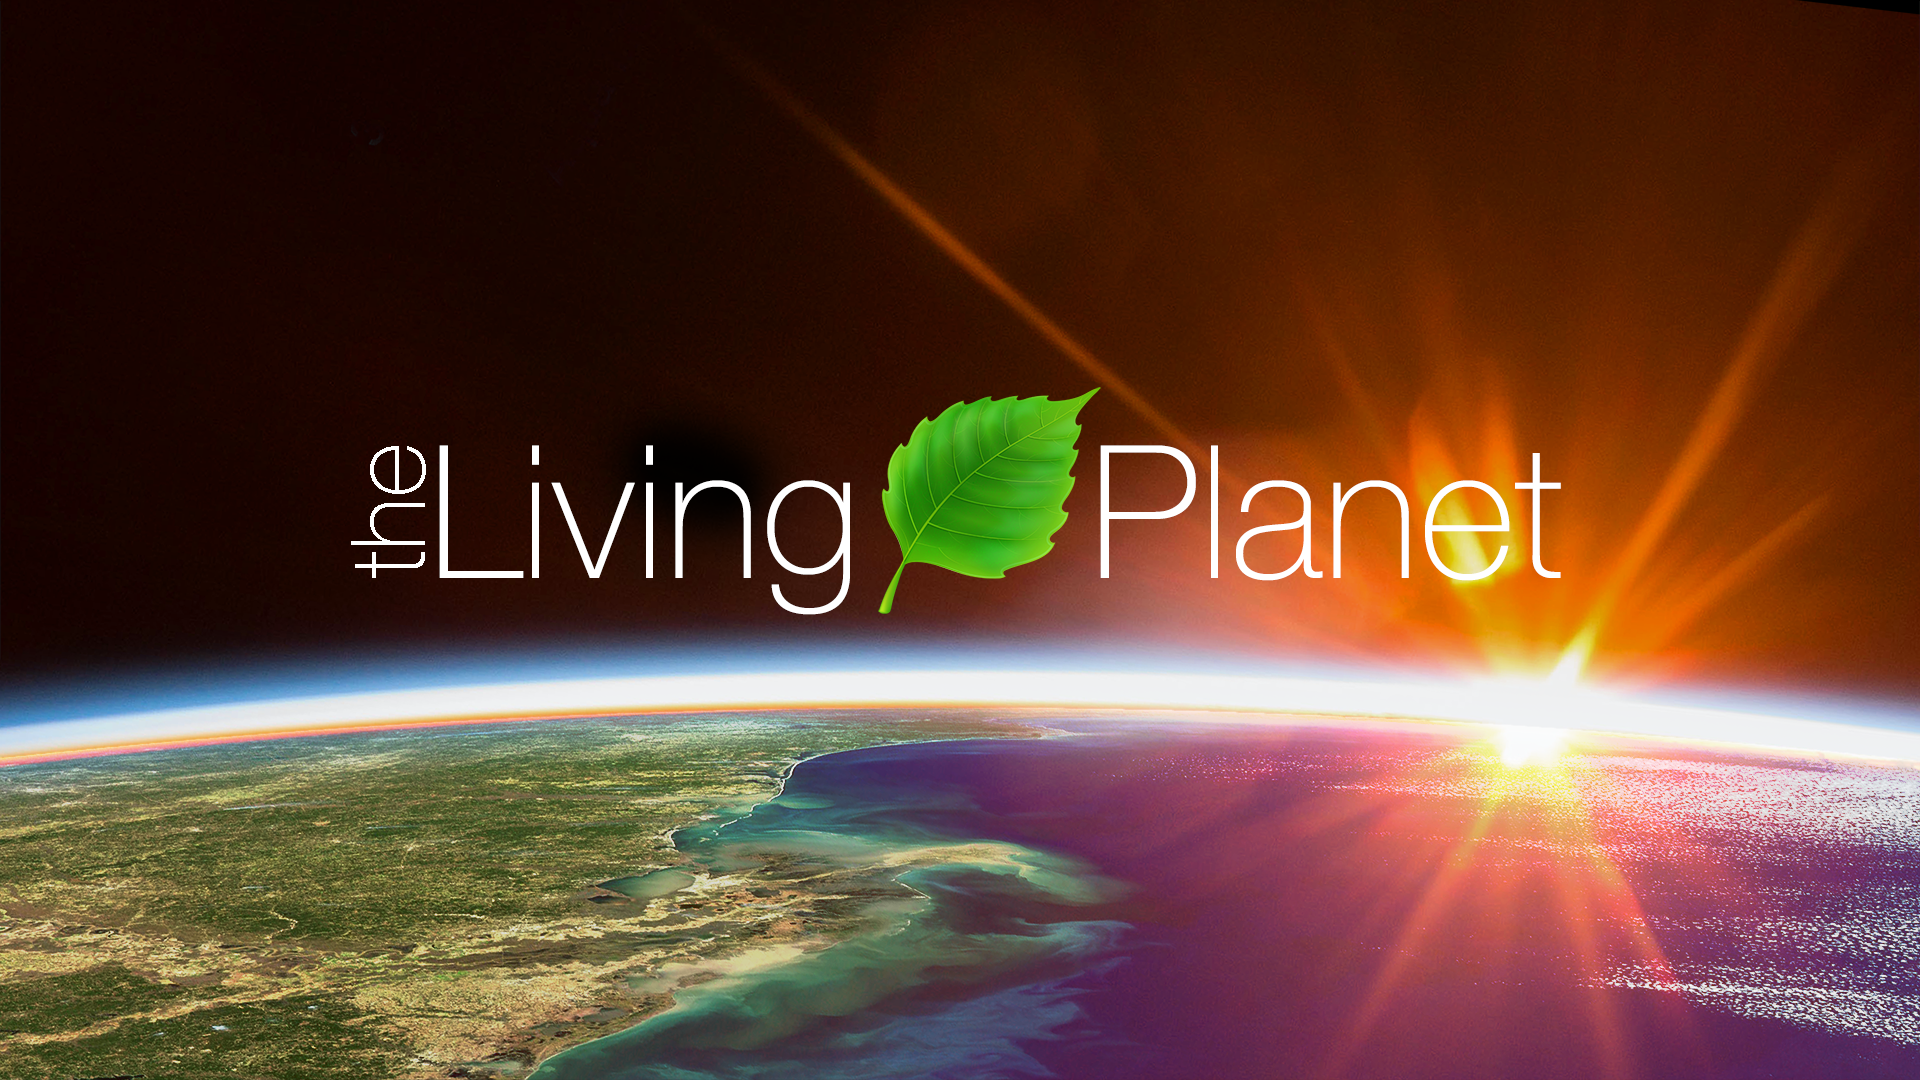
Life on Earth, from space
ocean’s surface, from September 1997 to September 2017. On land, vegetation appears on a scale from brown (low vegetation) to dark green (lots
of vegetation); at the ocean surface, phytoplankton are indicated on a scale from purple (low) to yellow (high). This visualization was created with
data from satellites including SeaWiFS, and instruments including the NASA/NOAA Visible Infrared Imaging Radiometer Suite and the Moderate
Resolution Imaging Spectroradiometer.
Sixty years ago, people were not sure that Earth’s surface could be seen clearly from space. Many thought that the dust particles and other aerosols in the atmosphere would scatter the light, masking the oceans and continents, said Jeffrey Masek, chief of the Biospheric Sciences Laboratory at NASA Goddard.
The Gemini and Apollo programs demonstrated otherwise. Astronauts used specialized cameras to take pictures of Earth that show the beauty and complexity of our living planet, and helped kickstart the era of Earth science research from space. In 1972, the first Landsat mission began its 45-year record of vegetation and land cover.
“As the satellite archive expands, you see more and more dynamics emerging,” Masek said. “We’re now able to look at long-term trends.”
The grasslands of Senegal, for example, undergo drastic seasonal changes. Grasses and shrubs flourish during the rainy season from June to November, then dry up when the rain stops. With early weather satellite data in the 1970s and ’80s, NASA Goddard scientist Compton Tucker was able to see that greening and die-back from space, measuring the chlorophyll in the plants below. He developed a way of comparing satellite data from two wavelengths, which gives a quantitative measurement of this greenness called the Normalized Difference Vegetation Index.
“We were astounded when we saw the first images. They were amazing because they showed how vegetation changed annually, year after year,” Tucker said, noting that others were surprised as well when the study came out in 1985. “When we produced this paper, people accused us of ‘painting by numbers,’ or fudging data. But for the first time, you could study vegetation from space based on their photosynthetic capacity.”
When the temperature is right, and water and sunlight are available, plants photosynthesize and produce vegetative material. Leaves strongly absorb blue and red light but reflect near-infrared light back into space. By comparing the ratio of red to near-infrared light, Tucker and his colleagues could quantify the vegetation covering the land.
Expanding these observations to the rest of the globe, the scientists could track the impact on plants of rainy and dry seasons elsewhere in Africa, see the springtime blooms in North America, and the after-effects of wildfires in forests worldwide.
But land is only part of the story. At the base of the ocean’s food web are phytoplankton — tiny organisms that, like land plants, turn water and carbon dioxide into sugar and oxygen, aided by the right combination of nutrients and sunlight.
Satellites that can monitor the subtle changes in color of the ocean have helped scientists track changes in phytoplankton populations across the globe. The first view of ocean color came from the Coastal Zone Color Scanner, a proof-of concept instrument launched in 1979. Continuous observations of ocean color began with the launch of SeaWIFS in late 1997. The satellite was just in time to capture the transition from El Niño to La Niña conditions in 1998 — revealing just how quickly and dramatically phytoplankton respond to changing ocean conditions.
“The entire Eastern Pacific, from the coast of South America all the way to the dateline, transitioned from what was the equivalent of a biological desert to a thriving rainforest. And we watched it happen in real time,” Feldman said. “For me, that was the first demonstration of the power of this kind of observation, to see how the ocean responds to one of the most significant environmental perturbations it could experience, over the course of just a few weeks. It also showed that the ocean and all the life within it is amazingly resilient — if given half a chance.”
Tracking change from satellites
With 20 years of satellite data tracking ocean plant life on a global scale, scientists are investigating how habitats and ecosystems are responding to changing environmental conditions.
Recent studies of ocean life have shown that a long-term trend of rising sea surface temperatures is causing ocean regions known as “biological deserts” to expand. These regions of low phytoplankton growth occur in the center of large, slow-moving currents called gyres.
“As the surface waters warm, it creates a stronger boundary between the deep, cold, nutrient-rich waters and the sunlit, generally nutrient-poor surface waters,” Feldman said. This prevents nutrients from reaching phytoplankton at the surface, and could have significant consequences for fisheries and the marine ecosystem.
In the Arctic Ocean, an explosion of phytoplankton indicates change. As seasonal sea ice melts, warming waters and more sunlight will trigger a sudden, massive phytoplankton bloom that feeds birds, sea lions and newly hatched fish. But with warming atmospheric temperatures, that bloom is now happening several weeks early — before the animals are in place to take advantage of it.
“It’s not just the amount of food, it’s the location and timing that are just as critical,” Feldman said. “Spring bloom is coming earlier, and that’s going to impact the ecosystem in ways we don’t yet understand.”
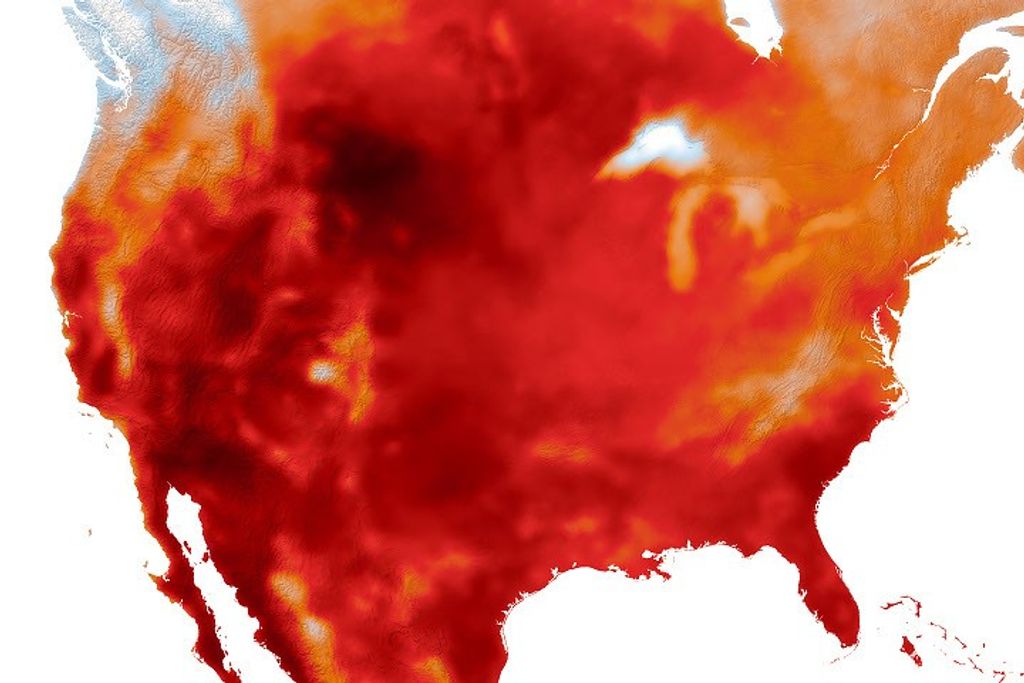
The climate is warming fastest in Arctic regions, and the impacts on land are visible from space as well. The tundra of Western Alaska, Quebec and elsewhere is turning greener as shrubs extend their reach northwards.
The neighboring northern forests are changing as well. Massive fires in 2004 and 2015 wiped out millions of acres of forests in Alaska, including spruce forests, noted Chris Potter, a research scientist at NASA’s Ames Research Center in California’s Silicon Valley.
“These fires were amazing in the amount of forest area they burned and how hot they burned,” Potter said. “When the air temperature hits 90 degrees Fahrenheit in late May up there, and all these lightning strikes occurred, the forest burned very extensively — close to rivers, close to villages — and nothing could stop it.”
Satellites help scientists routinely map fires, deforestation and other changes, and to analyze their impact on the carbon cycle, Potter said. Giant fires release many tons of carbon dioxide into the atmosphere, both from the charred trees and moss but also, especially in northern latitudes, from the soils. Potter and colleagues went to the burned areas of Central Alaska this year to measure the underlying permafrost — the thick mossy layer had burned off, exposing the previously frozen soils.
“It’s like taking the insulating layer off a cooler,” he said. “The ice melts underneath and it becomes a slushy mess.”
Forest types can change too, whether it’s after wildfires, insect infestations or other disturbance. The Alaskan spruce forests are being replaced with birch. Potter and his colleagues are also keeping an eye on California forests burned in recent fires, where the concern is that pines will be replaced by oaks.
“When drought is accentuated with these record high temperatures, nothing good seems to come from that for the existing forest type,” he said. “I think we’re seeing real clear evidence of climate causing land-cover change.”
Keeping an eye on crops
Changing temperatures and rainfall patterns also influence crops, whether they are grown in California or Africa. The “greenness” measurement that scientists use to measure forests and grasslands can also be used for agriculture, to monitor the health of fields throughout the growing season.
Researchers and policy makers realized this potential early. One of the first applications of Landsat data in the 1970s was to predict grain yields in Russia and better understand commodities markets. In 1985, food security analysts from USAID approached NASA to incorporate satellite images into their Famine Early Warning Systems Network, to identify regions where food production has been limited by drought. That partnership continues today. With rainfall estimates, vegetation measurements, as well as the recent addition of soil moisture information, NASA scientists can help organizations like USAID direct emergency help.
With improved data from Landsat, the MODIS instruments on NASA’s Terra and Aqua spacecraft and other satellites, and by combining data from multiple sensors, researchers are now able to track the growth of crops in individual fields, Tucker said.
“This moves things down to the field sizes for probably 80 percent of the fields globally — this is a huge advancement,” Tucker said.
The view from space not only helps monitor crops, but can help improve agricultural practices as well. A winery in California, for example, uses individual pixels of Landsat data to determine when to irrigate and how much water to use.
The next step for NASA scientists is actually looking at the process of photosynthesis from space. When plants undergo that chemical process, some of the absorbed energy fluoresces faintly back, notes Joanna Joiner, a NASA Goddard research scientist. With satellites that detect signals in the very specific wavelengths of this fluorescence, and a fine-tuned analysis technique that blocks out background signals, Joiner and her colleagues can see where and when plants start converting sunlight into sugars.
“It was kind of a revelation that yes, you can measure it,” Joiner said. An early study looked at the U.S. Corn Belt and found it fluoresces “like crazy,” she said. “Those plants have some of the highest fluorescence rates on Earth at their peak.”
Joiner and Tucker are using both the fluorescence data and vegetation indices to get the most information possible about plant growth at regional and global scales: “One of the big questions that still remains is how much carbon are the plants taking up, why does it vary year to year, and which areas are contributing to that variability,” Joiner said
Whether it’s crops, forests or phytoplankton blooms, NASA scientists are tracking life on Earth. Just as satellites help researchers study the atmosphere, rainfall and other physical characteristics of the planet, the ever-improving view from above will allow them to study the interconnected life of the planet, Feldman said.
“This is the capability that will allow us to understand how Earth’s biology responds to a changing planet,” he said.
Banner image: Visualization from September 2017 showing plant life on land and at the ocean’s surface. On land, vegetation appears on a scale from brown (low vegetation) to dark green (lots of vegetation); at the ocean surface, phytoplankton are indicated on a scale from purple (low) to yellow (high). This visualization was created with data from satellites including SeaWiFS, and instruments including the NASA/NOAA Visible Infrared Imaging Radiometer Suite and the Moderate Resolution Imaging Spectroradiometer. Credit: NASA
By Kate Ramsayer
NASA’s Goddard Space Flight Center, Greenbelt, Md.