










This website is currently under construction.
Please see the full NASA Common Research Model website for current information.
Experimental Approach
The experimental approach to a project involves several items, including the facility used, the model itself, the test conditions where the model is tested, and corrections that are applied to the data.
Related Files and Data
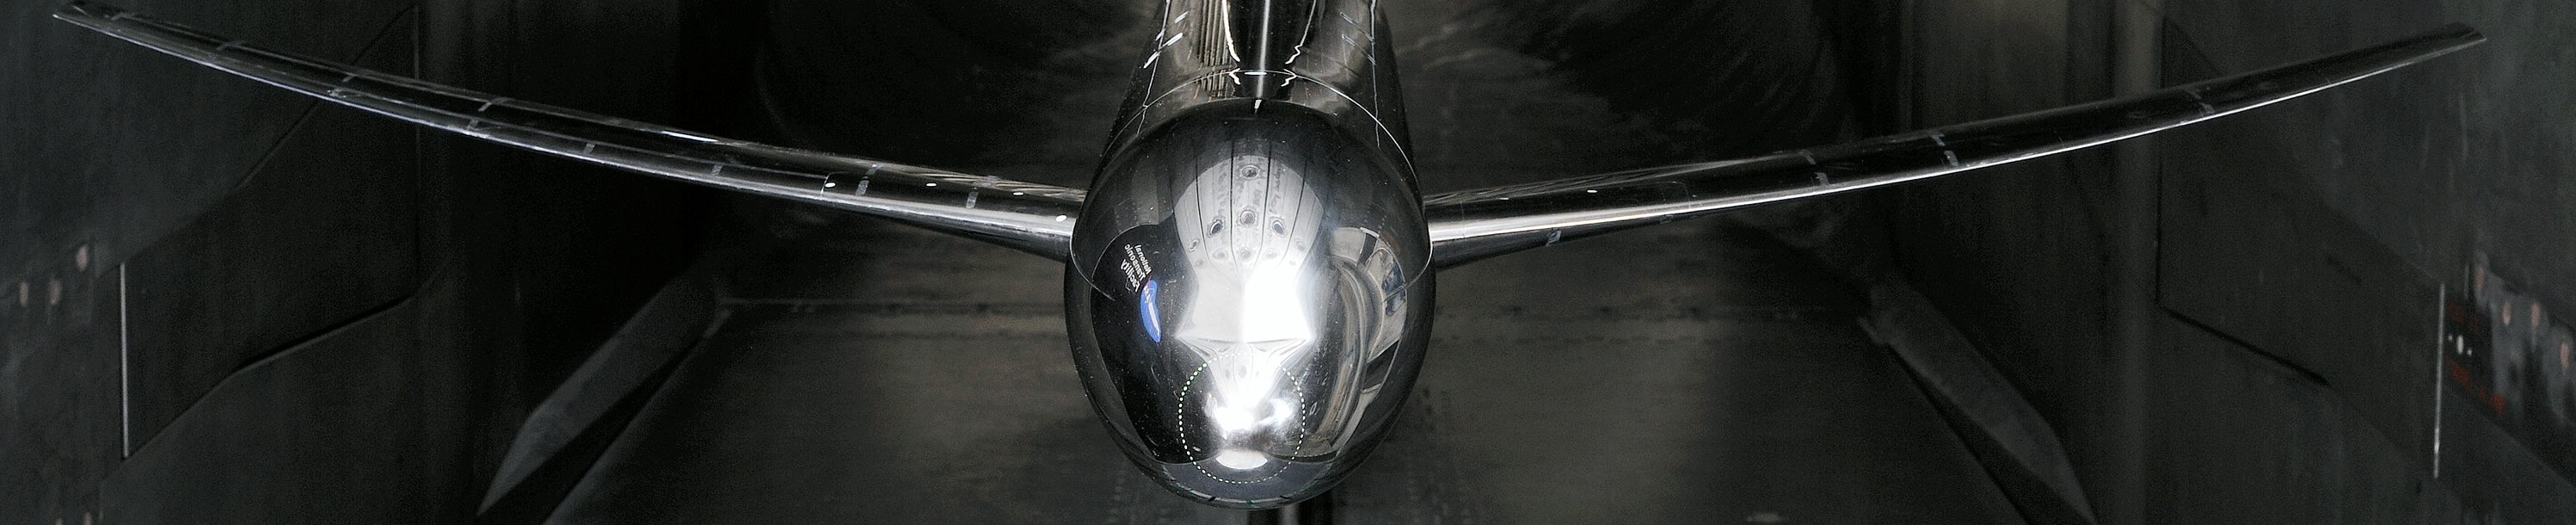
The NASA Common Research Model (CRM) consists of a contemporary supercritical transonic wing and a fuselage that is representative of a widebody commercial transport aircraft. The CRM is designed for a cruise Mach number of M∞ = 0.85 and a corresponding design lift coefficient of CL= 0.5.
The aspect ratio is 9.0, the leading edge sweep angle is 35 deg, the wing reference area (S) is 3.011 ft2, the wing span (b) is 62.47 inches, and the mean aerodynamic chord (c) is 7.447 inches. The model moment reference center is located at MS=35.799 inches and WL=4.805 inches. The nacelles used for this test were simple, flow through nacelles.
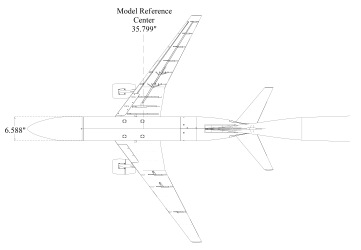 Top View | 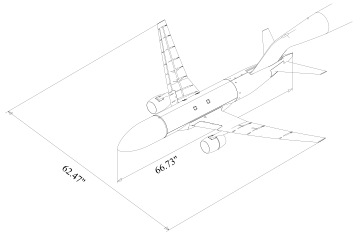 Isometric View |
Pressure distributions are measured on both the left and right wings using 291 pressure orifices located in 9 span-wise wing stations (η = 0.131, 0.201, 0.283, 0.397, 0.502, 0.603, 0.727, 0.846, and 0.950) and on the left hand nacelle by 6 orifices at 6 radial stations (η = 30º, 90º, 150º, 210º, 270º, and 330º). All pressure measurements were made using Electronically Scanned Pressure (PSP) modules mounted inside the forward portion of the fuselage. Based on quoted accuracies from the ESP module manufacturer, surface pressure measurements should be in error no more than +/- 0.015 psi. This in turn would correspond to a variation of no more than +/- 0.0026 in terms of Cp. The model is mounted in the wind tunnel using a blade sting arrangement.
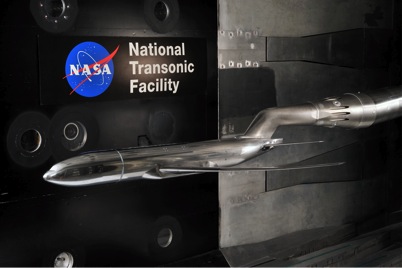
Five different configurations were tested in the current investigation: the wing/body (WB) alone, wing/body/pylon/nacelle (WBPN), wing/body/tail=0° (WBT0), wing/body/tail=+2° (WBT+2) and wing/body/tail=-2° (WBT-2).
Ames 11-ft Wind Tunnel
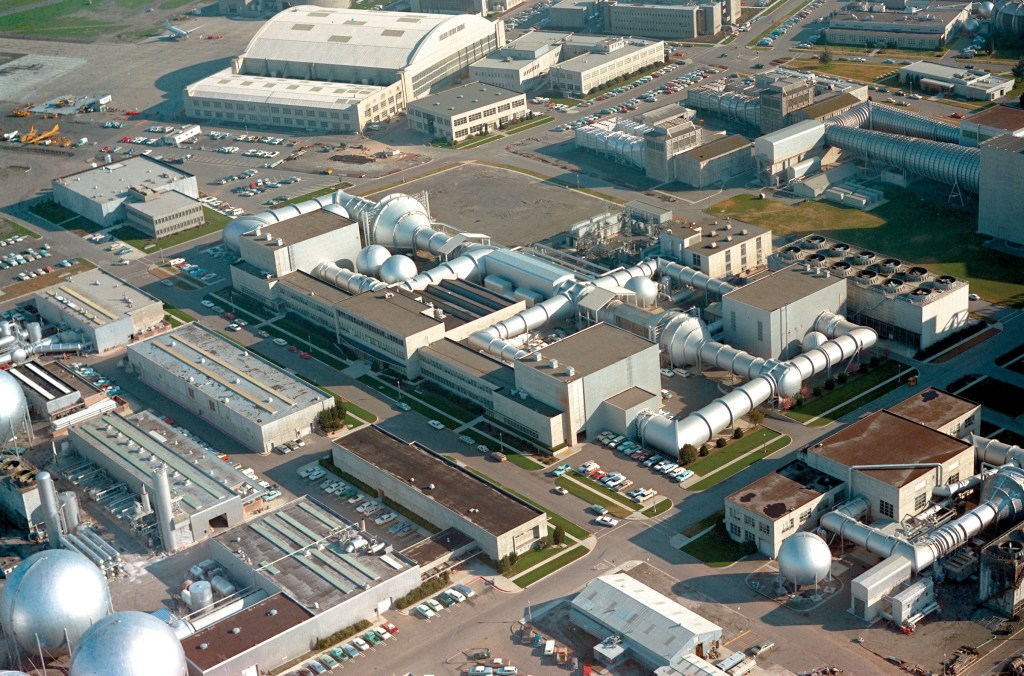
The 11- by 11-Foot Transonic Wind Tunnel (11-Foot TWT) Facility is part of the Unitary Plan Wind Tunnel (UPWT) complex at NASA Ames Research Center at Moffett Field, California, where generations of commercial and military aircraft and NASA space vehicles, including the space shuttle, have been designed and tested.
The 11-Foot TWT is a closed-return, variable-density tunnel with a fixed-geometry, ventilated test section with a flexible wall nozzle. It is one of three separate test sections powered by a common drive system. A three-stage, axial-flow compressor powered by four wound-rotor, variable-speed induction motors, produces airflow. Interchangeability of models among the UPWT test sections allows testing across a wide range of conditions.
The 11-Foot TWT has been instrumental in the development of virtually every domestically produced commercial transport and military fixed-wing airframe since the 1960s. The facility is used extensively for airframe testing and aerodynamic studies and has played a vital role in every manned space flight program, including NASA’s new Orion space capsule, on which astronauts will fly to the International Space Station, the Moon, and beyond.
Langley National Transonic Facility
The world’s largest pressurized cryogenic wind tunnel, the National Transonic Facility (NTF), possesses unique capabilities to duplicate actual flight conditions. The NTF supports advanced aerodynamic concept development and assessment, advanced computational fluid dynamics tool validation, and risk reduction for vehicle development.
The NTF provides the highest transonic Reynolds number testing capability in the world, and can use either conventional air at ambient temperatures as the test gas, or gaseous nitrogen (expanded from injecting liquid nitrogen) at temperatures as low as -250 ºF for achieving flight test conditions. With a wide range of customizable instrument and measurement techniques, both full-span and semi-span model testing is supported.
The facility has the unique capability to adjust test conditions to match model size. Independent control of total temperature, pressure, and fan speed allow isolation and study of pure compressibility (Mach) effects, viscous (Reynolds number) effects, and aeroelastic (dynamic pressure) effects. The interior of the pressure shell is thermally insulated to ensure minimal energy consumption, and responsive Mach-number control is achieved with a variable inlet drive system.
Our expert GFTD test team supports a wide variety of notable clients, including large commercial aircraft manufacturers, leading general aviation corporations and NASA’s Space Shuttle Program.
The geometry of the NTF is available here.
European Transonic Wind Tunnel
The European Transonic Wind Tunnel (ETW) is similar to the National Transonic Facility, a pressurized cryogenic, closed circuit, continuous-flow, fan-driven wind tunnel. It can be operated in closed and slotted wall configurations for testing full and half-models from Mach numbers of 0.15 up to light supersonic conditions at M∞=1.35. Pure high quality nitrogen is used as the only test gas. The capability of varying the gas temperature, pressure and speed independently allows for pure Reynolds number and/or aeroelastic investigations. The test section dimensions are 7.87 ft (2.4 m) in width, 6.56 ft (2 m) in height and about 30 ft (9 m) in length. High flow quality is provided by 2 filling screens in the wide angle diffuser combined with a flow straightener (honeycomb) and 2 anti-turbulence screens followed by a fixed contraction and a flexible nozzle for supersonic operation. Additionally, the tunnel features a second throat downstream of the re-entry preventing flow disturbances eventually generated in the high-speed diffuser from propagating upstream into the test-section.
The ETW operating range covers pressures from 110kPa to 450kPa and temperatures from 313K down to 110K allowing the achievement of maximum Reynolds numbers of 50 million for full models and 90 million for semi-span models at a Mach number around 0.85. While the tunnel shell is internally insulated against heat losses the heat generated by the fan is compensated by the evaporation of the injected liquid nitrogen, which is sprayed into the tunnel upstream of the compressor. Further details about the facility and its operation can be found at www.etw.de.
ONERA S1MA Large Transonic Atmospheric Wind Tunnel
Information and results of the test of the Common Research Model in the ONERA S1MA wind tunnel can be found here.
Ames 11-ft Wind Tunnel
Download a copy of the final Ames 11 foot run log CRM Ames Test 216 Run Log
Download a copy of the Ames 11 foot variable names AmesT216VarNames
The investigation, conducted over a 5-week period, provided force and moment, surface pressure, and surface flow visualization data. Testing was conducted at a chord Reynolds number of 5 million. The data were collected at temperatures of approximately 100º F.
All data presented were obtained at freestream Mach numbers ranging from 0.7 to 0.87. Data were generally obtained over an angle-of-attack range from -3° to +12° at 5 million chord Reynolds number. Flow angularity measurements were made and upflow corrections ranging from 0.013° to 0.067° were applied to the final data. Classical wall corrections accounting for tunnel buoyancy and lift interference have been applied according to the method presented elsewhere.
Transition was also fixed on the model when tested at the Ames 11-ft wind tunnel. For this investigation, though, only vinyl adhesive trip dots were applied. These trip dots measured 0.05 inches in diameter and were spaced 0.1 inches apart. For a chord Reynolds number of 5 million, a trip dot height of 0.0035 inches was used from the SOB (side of body) to the yehudi break, 0.003 inches was used from the yehudi break to the midwing and 0.003 inches was used from the midwing to the wing tip. These trip dots were installed at 10% chord. Vinyl adhesive trip dots were also applied at the nose of the fuselage and left on for the entire test. When the nacelles were on the model, trip dots were located 0.43 inches back from the leading edge on the outer surface and the inner surface. Finally, when the tails were on the model, trip dots were located at 10% chord and measured 0.003 inches.
Langley National Transonic Facility
Download a copy of the NTF final run log CRM NTF Test 197 Run Log
Download the definition of the NTF variable names NTFT197VarNames.v2. This file was last updated on October 23, 2014. Please discard any variable name file for NTF Test 197 downloaded from this website before this date.
The force and moment data from NTF Test 197 was updated on October 23, 2014. Please discard any force and moment data from NTF Test 197 downloaded from this website before this date.
The investigation, conducted over a 6-week period, provided force and moment, surface pressure, model deformation, and surface flow visualization data. Testing was conducted at 5, 19.8 and 30 million Reynolds number. All Reynolds number values presented in this paper are based on mean aerodynamic chord. The 5 and 19.8 million Reynolds number data were collected to provide a comparison to previously calculated CFD results and all of the Reynolds numbers were used to provide an assessment of Reynolds number effects. The 19.8 million Reynolds number data were collected at two different q∞ levels – a high and a low q∞ condition. Having two q∞ levels at the same Reynolds number provides an aeroelastic step in the data. The data were collected at temperatures ranging from -250ºF up to 120ºF.
Data were generally obtained over an angle-of-attack range from -3° to +12° at 5 million Reynolds number and from -3° to +6° at 19.8 and 30 million Reynolds numbers. The reduced angle-of-attack range at the higher Reynolds number was required such that safe model stress levels would not be exceeded. Flow angularity measurements were made and upflow corrections ranging from 0.092° to 0.173° were applied to the final NTF data. Classical wall corrections accounting for model blockage, wake blockage, tunnel buoyancy, and lift interference have been applied.
In order to ensure a consistent and repeatable transition from laminar to turbulent flow and to support the goal of the wind tunnel data being used for CFD validation purposes, it was important to apply a proven and reliable method to fix transition on the model. Evercoat trip dots measuring 0.05 inches in diameter and spaced 0.1 inches apart (center to center) were used for the current investigation. For a chord Reynolds number of 5 million, a trip dot height of 0.0035 inches was used from the SOB (side of body) to the yehudi break, 0.003 inches was used from the yehudi break to the midwing and 0.003 inches was used from the midwing to the wing tip. These trip dots were installed at 10% chord. Vinyl adhesive trip dots with a height of 0.004 inches were applied at the nose of the fuselage and left on for the entire test. When the nacelles were on the model, trip dots with a height of 0.003 inches were located 0.43 inches back from the leading edge on the outer surface and the inner surface. Finally, when the tails were on the model, trip dots were located at 10% chord and measured 0.003 inches in height.
European Transonic Wind Tunnel
Since this investigation was funded by the European Commission as part of the ESWIRP project, the available budget only allowed for testing over a limited range of conditions. The test plan for the 5-day test campaign in the ETW was determined based on a compromise between test requirements from the European project group chaired by J.L. Goddard from ONERA-France which focused on acquiring data for CFD validations of unsteady wake flows and a repeat of the conditions at which the used CRM model had been tested in the NTF. A few polars were added at a very low Reynolds number to provide comparative aerodynamic data for the Japanese research organisation JAXA who have tested the CRM in a downscaled version in their transonic tunnel.
For achieving the scientific goal of the project, newly integrated measurement capabilities were operated during the campaign: unsteady PIV for wake flow analysis and unsteady and steady model deformation measurements combined with the recording of unsteady balance signals taking the benefit of an upgraded fast high capacity data acquisition system. In the frame of the present paper only aerodynamic data like force, moments and wing pressure distributions combined with the wing deformation are presented. Although, data were acquired at 12 different Mach numbers ranging from 0.25 to 0.87 the majority focussed on M=0.7 and the model design Mach number of 0.85. So, with respect to the intended comparison of results, the reference test conditions of the NTF at these two Mach numbers were carefully set and controlled. To cover the relevant Reynolds numbers of 5, 19.8 and 30 million the tunnel temperature was varied between 302 K and 117 K combined with corresponding pressures between 200 and 300 kPa. The operating envelopes of NTF and ETW do not allow achieving the minimum and maximum Reynolds number at the identical q/E value. Hence, it was decided to duplicate the 19.8 million Reynolds number at a lower and higher q/E value allowing an additional comparison of the model deformation assessment as a function of the different aeroelastic effects. By performing lift polars with the model in upright and inverted position the upwash could be assessed as 0.010 to 0.015 deg over the full operating range. The measured data were additionally corrected for wall interference based on the ETW experimental assessment established in the past. Extreme care is always given to the measurement of the model angle of attack. Before starting the test campaign the electrical offset and misalignment of the relevant inclinometer inside the model is checked even under load applied to it. Special care was also given to the application of the transition band classically used when testing at a chord Reynolds number of 5 million. Performing this work in close cooperation with the NTF experts minimised the risk for later mismatches in the results originated by this sensitive item.
Before facilities like NTF and ETW went into operation engineers were convinced of the rigidity of wind tunnel models not suffering remarkable deformations generated by aerodynamic loads especially present in pressurised facilities. Using the unique capabilities of these tunnels for establishing identical Reynolds numbers at different pressure or better q/E levels the opposite could be proven. Nowadays, the correct assessment of the wing shape under load is mandatory for all comparisons to CFD results. Starting with the developments of appropriate measurement systems with a Moirée tool today, ETW may operate 4 systems in parallel, e.g. for monitoring the shape of the main wing and all high lift components of a half-model. The Stereo Pattern Tracking systems (SPT) are capable of monitoring the shift in space of markers pasted on the lower wing surface. In the test campaign reported here one system was looking on the main wing with 58 frames/sec while a second one monitored unsteady HTP movements with 386 frames/sec.
Both the NTF and the Ames 11-ft wind tunnels use the Transonic Wall Interference Correction System (TWICS) to provide blockage and incidence corrections due to the presence of the test section boundary. TWICS and its predecessor, the Wall Interference Correction System (WICS), were developed at the NASA Ames Research Center by Ulbrich et al.as a modification and extension of the Hackett wall signature method. TWICS is an enhanced version of WICS that handles ventilated boundary conditions, typically seen in transonic wind tunnels. This method was chosen to be implemented at the NTF, see Iyer et al.,in an effort to standardize the wall interference correction methodology across NASA centers. TWICS is based on a linearized potential flow method with a Prandtl-Glauert compressibility model which inherently assumes that there is a portion of flow in the test section between the near-field region of the test article and the near-field region of the wall that is a linear perturbation of the empty test section flow field.
The method uses a tared wall pressure signature, which is the difference between the model installed condition and the empty test section, a database of normalized perturbation velocities using unit singularity solutions computed for a given mathematical representation of the wall boundary condition, and geometric information from the test article. Tareing of the wall pressure signature is performed to remove first order effects of the empty tunnel boundary layer and buoyancy, is assumed to contain only the solid and wake blockage, and is also assumed that the additional second order change in the test-section-wall boundary layer displacement thickness due to the presence of the test article is negligible—an assumption that is violated by flow near a Mach number of unity where aspects of the crossflow are more critical. The test article is modeled with an appropriately weighted point doublet chain to represent the fuselage, wake, and support system. Line doublets, typically distributed along the lifting surface quarter-chord, are used to simulate the effect of lift. The strengths of the line doublets are determined using the measured lift from the balance. The resulting wall signature from these singularities is subtracted from the tared wall signature, leaving only the blockage signature. This remaining signature is used to determine the strengths of the solid and wake blockage singularities.
Although both facilities use TWICS, the implementations are not identical. The differences occur in how the wall boundary conditions are formulated and applied. Ulbrichperformed a calibration and validation of the baffled, slotted (i.e. porous) wall boundary condition for the Ames 11-ft wind tunnel. Walker calibrated and validated the longitudinal slotted wall boundary condition in the NTF. A discrete wall formulation, where the boundary condition is applied in the baffled slot, is used at the Ames 11-ft wind tunnel; whereas, a homogeneous wall formulation, which is more of an averaged representation of the effect of the ventilated wall boundary, is used at the NTF. Work is in progress to assess the impact of modeling the NTF wall boundary condition as discrete. It is anticipated that a change to the discrete formulation of the NTF may lead to a decreased incidence correction. Data presented on this website are corrected using the respective implementations of TWICS at each facility.
During the test in the Ames 11′ wind tunnel test PSP data was obtained on the Wing/Body, Wing/Body/Tail=0 and Wing/Body/Tail=+2 configurations. On this page you will find a summary of this PSP data, the data itself in PLOT3D format as well as grids for the three configurations on which data was taken. A link to a paper detailing the PSP process during this test is also given below:
- CRM Test 11-0215 PSP Data Summary
- AIAA-2011-1128
- CRM_WB.formatted.p3d
- CRM_WBH_iH0.formatted.p3d
- CRM_WBH_iH+2.formatted.p3d
Wing/Body Configuration Data
- 003401.c3d
- 003402.c3d
- 003403.c3d
- 003404.c3d
- 003405.c3d
- 003406.c3d
- 003407.c3d
- 003408.c3d
- 003409.c3d
- 003501.c3d
- 003502.c3d
- 003503.c3d
- 003504.c3d
- 003505.c3d
- 003506.c3d
- 003507.c3d
- 003508.c3d
- 003509.c3d
- 003601.c3d
- 003602.c3d
- 003603.c3d
- 003604.c3d
- 003605.c3d
- 003606.c3d
- 003607.c3d
- 003608.c3d
- 003609.c3d
Wing/Body/Tail=0 Configuration
- 005601.c3d
- 005606.c3d
- 005603.c3d
- 005602.c3d
- 005604.c3d
- 005605.c3d
- 005607.c3d
- 005608.c3d
- 005609.c3d
- 005701.c3d
- 005702.c3d
- 005703.c3d
- 005704.c3d
- 005705.c3d
- 005706.c3d
- 005707.c3d
- 005708.c3d
- 005709.c3d
- 005801.c3d
- 005802.c3d
- 005803.c3d
- 005804.c3d
- 005805.c3d
- 005806.c3d
- 005807.c3d
- 005808.c3d
- 005809.c3d
Wing/Body/Tail=+2 Configuration
The final run logs from some of the experiments that have been performed on the CRM thus far contain all of the data as well as a page that describes what is included in the data files.
The Ames final run log is available here, CRM Ames Test 216 Run Log.
The NTF final run logs are available here:
The entire force and moment data set from the first NTF entry is located here: NTF197Data
To only pick certain conditions to download, use the search tool within this menu.
National Transonic Facility Results
There have been 3 tests on the high speed CRM in the NTF over the years. All of the data is not yet on this website but is being added as time permits. The run logs for each of the tests can be downloaded via the links below and the available data themselves can be found using the experimental results search feature on this menu.
European Transonic Wind Tunnel Results
Since this test was funded by the European Community through the ESWIrp initiative, all of the data obtained during the ETW test of the CRM are available on the ESWIrp initiative website here.
To download the free Adobe Reader please click here.