


This image shows four separate images of the M5.3 class flare from the morning of July 4, 2012. In clockwise order starting at the top left, the wavelengths shown are: 131, 94, 193, and 171 Angstroms. Each wavelength shows a different temperature of material, which in turn corresponds to different levels of the sun's atmosphere.
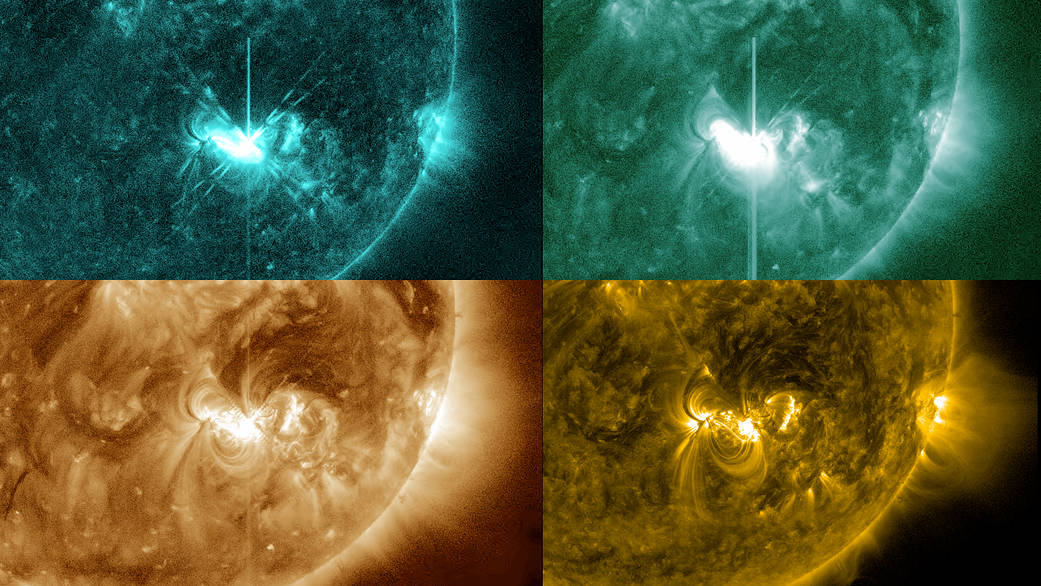
This image shows four separate images of the M5.3 class flare from the morning of July 4, 2012. In clockwise order starting at the top left, the wavelengths shown are: 131, 94, 193, and 171 Angstroms. Each wavelength shows a different temperature of material, which in turn corresponds to different levels of the sun’s atmosphere. By looking at images in several wavelengths, scientists can track how a solar eruption moves through the layers.
Credit for the composite is: NASA/SDO/AIA/Helioviewer/TheSunToday