


Satellite Shows Tropical Depression 9 Weakening

NOAA’s GOES-East satellite captured an image of Tropical Depression 9 weakening in the Central Atlantic on September 18, 2015. Tropical Depression 9 is battling wind shear and dry air, both of which are taking the life out of it.
NOAA’s GOES-East satellite provides continuous coverage of the Atlantic and eastern U.S. and on September 18 at 0845 UTC (4:45 a.m. EDT) saw the fading Tropical Depression 9. Forecaster Beven of the National Hurricane Center noted that the satellite imagery showed a burst of convection with cloud tops colder than -70C had developed near and northeast of the center of Tropical Depression Nine. However, strong vertical wind shear continues to affect the storm. The image was created by the NASA/NOAA GOES Project at NASA’s Goddard Space Flight Center in Greenbelt, Maryland.
At 500 AM AST (0900 UTC), the center of Tropical Depression Nine was located near latitude 17.6 North, longitude 45.7 West. The depression is moving toward the north-northwest near 7 mph (11 kph). A motion toward the northwest is expected during the next 48 hours.
Maximum sustained winds are near 30 mph (45 kph) with higher gusts. The depression is moving through an area of strong upper-level winds, and it is forecast to weaken to a remnant low Friday or Friday night (September 18).The estimated minimum central pressure is 1007 millibars.
Beven said the depression continues to be in an environment of 25 to 30 knot of westerly vertical wind shear, and water vapor imagery shows mid- to upper-level dry air is moving into the depression. Both of those factors are weakening the depression. The dynamical computer forecast models suggest those conditions should persist for at least 48 hours, and based on this the depression is forecast to degenerate to a remnant low pressure area in 24 hours or less.
Rob Gutro
NASA’s Goddard Space Flight Center
Sep. 17, 2015 – NASA’s GPM Analyzes Tropical Depression Nine Rainfall
The Global Precipitation Measurement or GPM mission core satellite passed over Tropical Depression 9 in the Central Atlantic and looked at the rainfall rates within the storm.
Tropical cyclone development has been relatively slow in the Atlantic Ocean in 2015 with tropical depression Nine (TD9) forming yesterday, September 16 in the central tropical Atlantic.
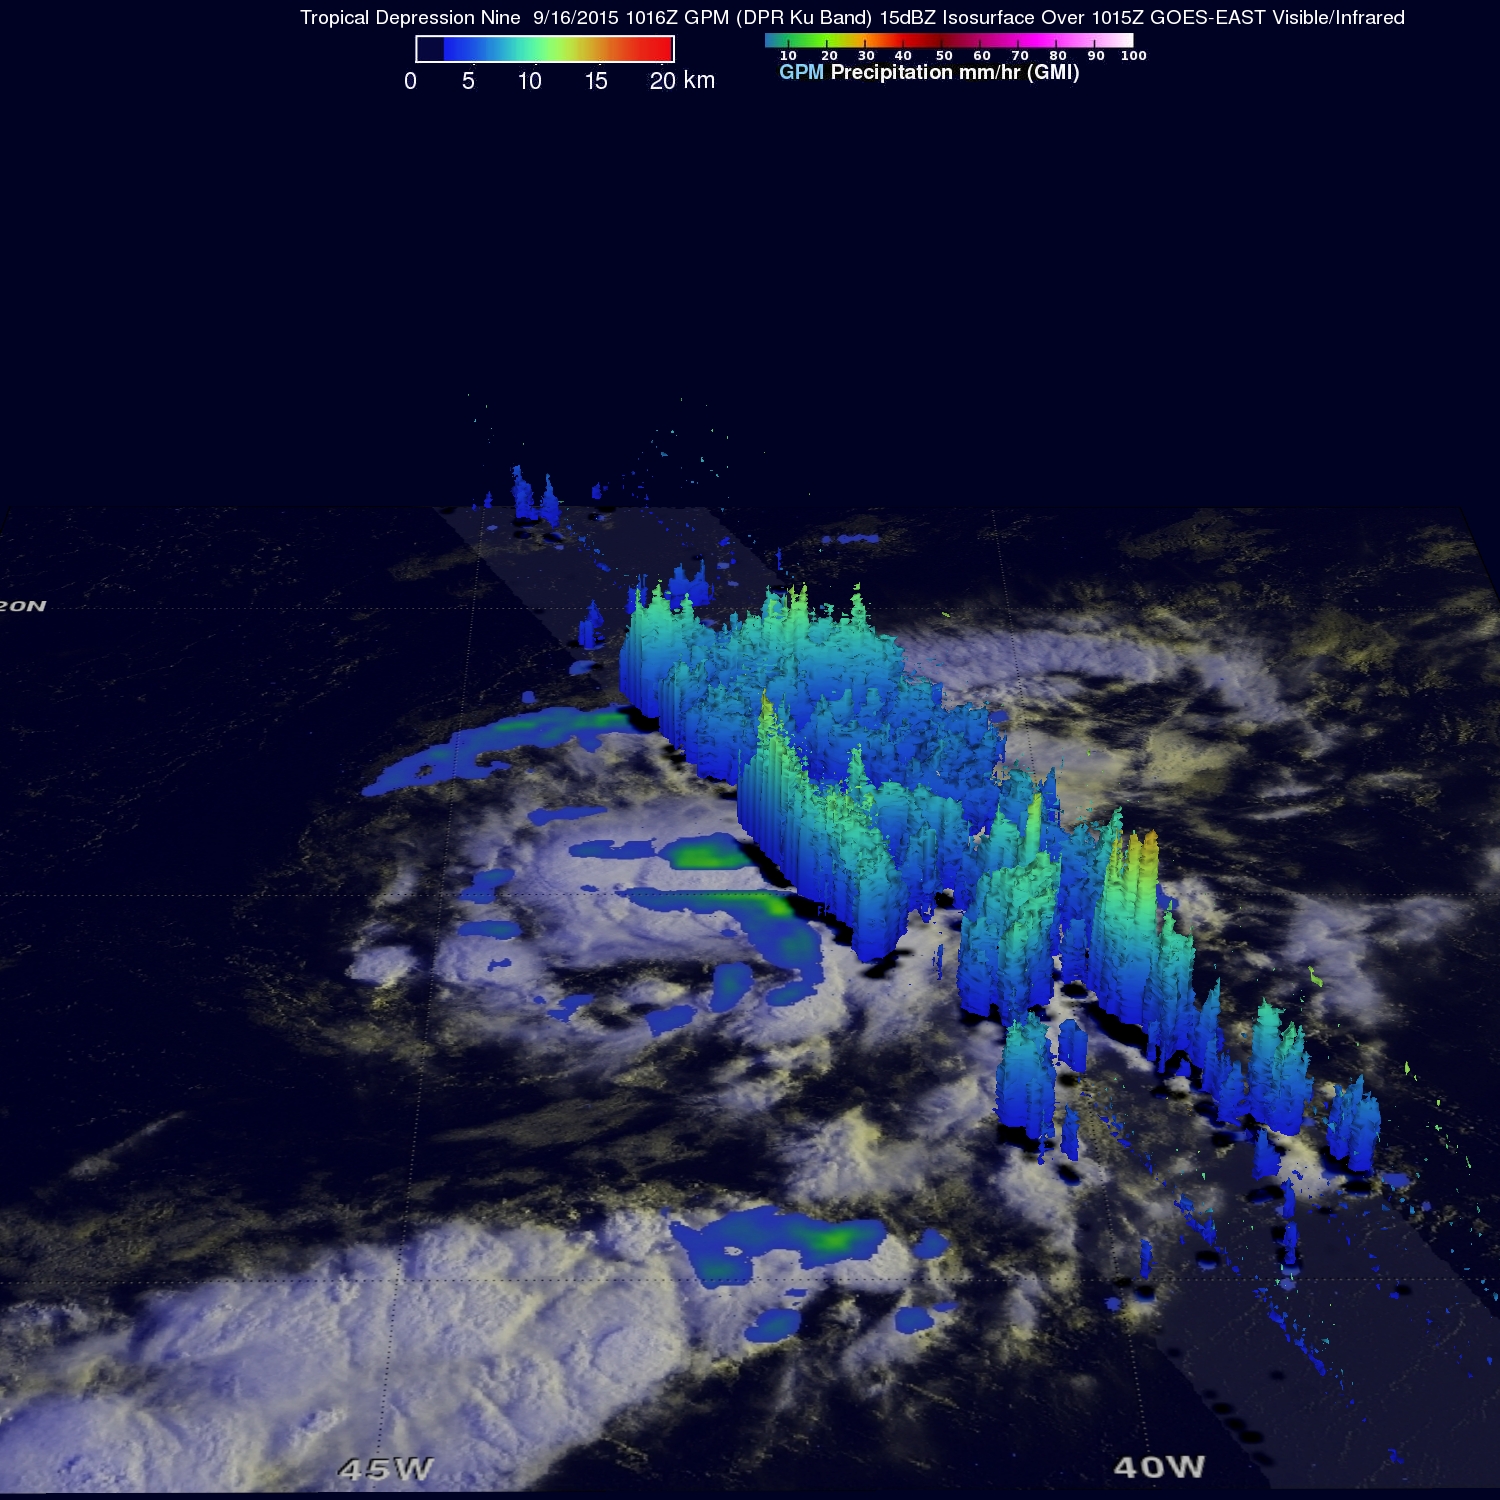
GPM’s Microwave Imager (GMI) and Dual-Frequency Precipitation Radar (DPR) instruments collected data on Sept. 16 at 1016 UTC (6:16 a.m. EDT). At NASA’s Goddard Space Flight Center in Greenbelt, Maryland, data from that overpass (or flyover) were used to create a three dimensional (3-D) extent of Tropical Depression Nine’s (TD9) rainfall. GPM’s 3-D DPR (Ku Band) found that the tallest convective thunderstorms within TD9 were reaching heights of about 14.9 km (9.2 miles) in a feeder band southeast of TD9’s center of circulation. The most intense rain was measured by GPM falling at a rate of 58.2 mm (2.3 inches) per hour.
Credits: SSAI/NASA/JAXA, Hal Pierce
The GPM core satellite is managed by both NASA and the Japan Aerospace Exploration Agency.
At 5 a.m. EDT on September 17, 2015 the center of Tropical Depression Nine was located near latitude 16.3 North and longitude 45.3 West. That puts the center about 1,065 miles (1.715 km) east of the Lesser Antilles. The depression was moving toward the northwest near 7 mph (11 kph), and this general motion is expected to continue for the next couple of days.
Maximum sustained winds are near 35 mph (55 kph) and the National Hurricane Center (NHC) expects some weakening is expected during the next couple of days. In fact, the NHC said that the depression could degenerate to a remnant low pressure area by Saturday, September 19. For the latest forescasts on TD9, visit the National Hurricane Center webpage: www.nhc.noaa.gov.
Hal Pierce
SSAI/NASA Goddard Space Flight Center
Sep. 16, 2015 – NASA’s RapidScat and Aqua Satellite See Tropical Depression 9 Developing
The ninth tropical depression of the Atlantic Ocean hurricane season developed in the central Atlantic on September 16, 2015. The day before, NASA’s RapidScat instrument analyzed the surface winds of the developing low pressure area and found tropical-storm-force winds in one quadrant of the system. NASA’s Aqua satellite looked at the depression and saw that it was already being affected by wind shear.
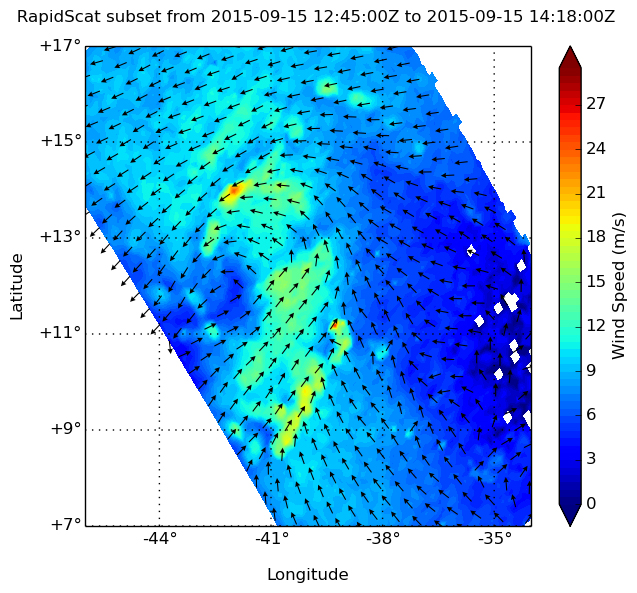
RapidScat data on September 15 at 10 a.m. EDT showed that the strongest sustained winds in the developing depression were north of the center near 24 meters per second (53.6 mph/ 86.4 kph). Winds around the rest of the system were around 20 meters per second/72 km/44.7 mph, with the exception of the western quadrant, which were weaker. RapidScat wind data was analyzed by the RapidScat team at NASA’s Jet Propulsion Laboratory, Pasadena, California.
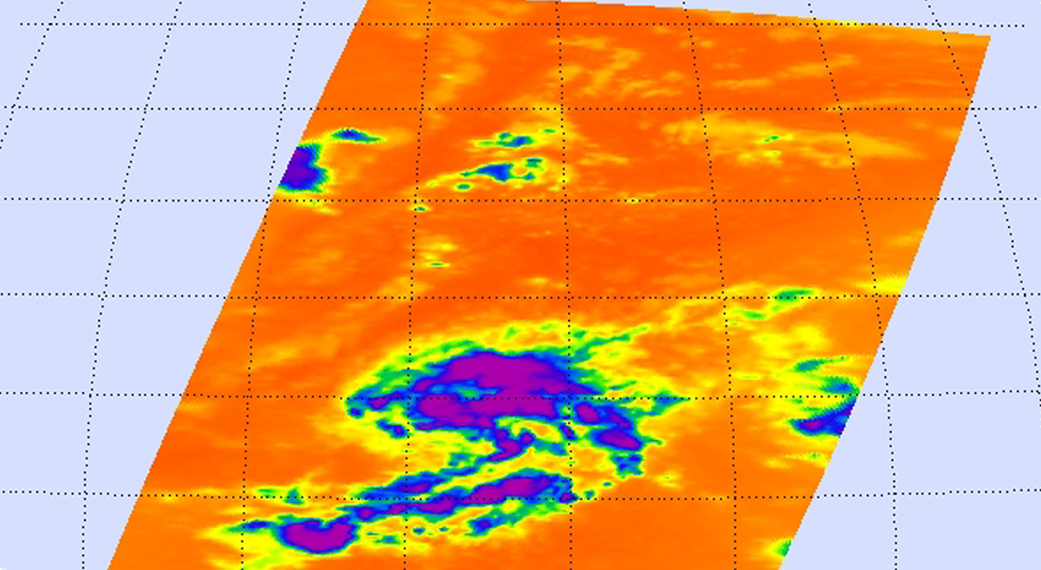
Infrared data from the Atmospheric Infrared Sounder or AIRS instrument aboard NASA’s Aqua satellite on Sept. 16 at 04:23 UTC (12:23 a.m. EDT) showed cold cloud tops of powerful thunderstorms wrapping north and east of the developing depression’s center. Cloud top temperatures were as cold as -63F/-53C, and were capable of generating heavy rain.
At 11 a.m. (1500 UTC) on September 16 the center of Tropical Depression Nine was located near latitude 15.0 North, longitude 43.1 West. That puts the center about 1,270 miles (2,050 km) west of the Cape Verde Islands. The depression is moving toward the north-northwest near 8 mph (13 kph). Maximum sustained winds are near 30 mph (45 kph) with higher gusts. The National Hurricane Center noted that little change in strength is forecast during the next 48 hours. The estimated minimum central pressure is 1010 millibars.
National Hurricane Center Forecaster Brennan noted that some southwesterly vertical wind shear is already affecting the cyclone, with most of the thunderstorms, clouds and convection (rising air that forms the thunderstorms that make up a tropical cyclone) pushed east and north of the estimated center position. Brennan noted that the environment will becomes less favorable from this point forward, with the wind shear forecast to quickly increase over the next day and remain high through the remainder of the forecast period. In addition, the southwesterly flow aloft will bring dry mid- to upper-level air over the cyclone.
NHC expects Tropical Depression 9 to move in a north-northwestward to northwestward direction for the next couple of days and then turn west-northwest in four days.