


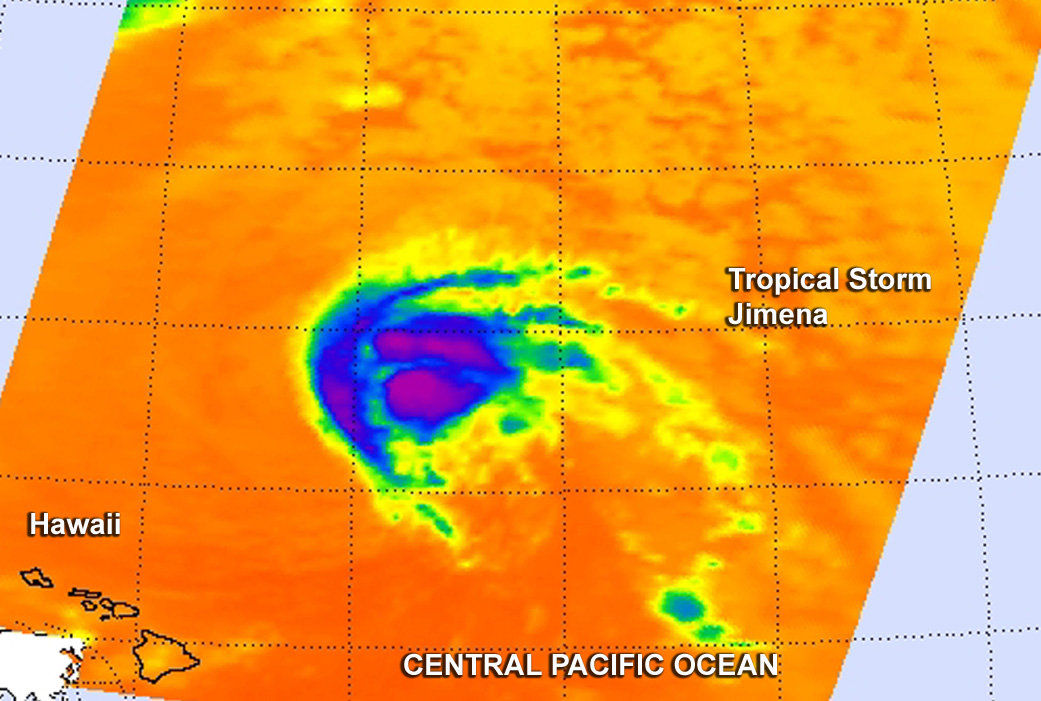
Satellite Spots Jimena’s Remnants North of Hawaiian Islands
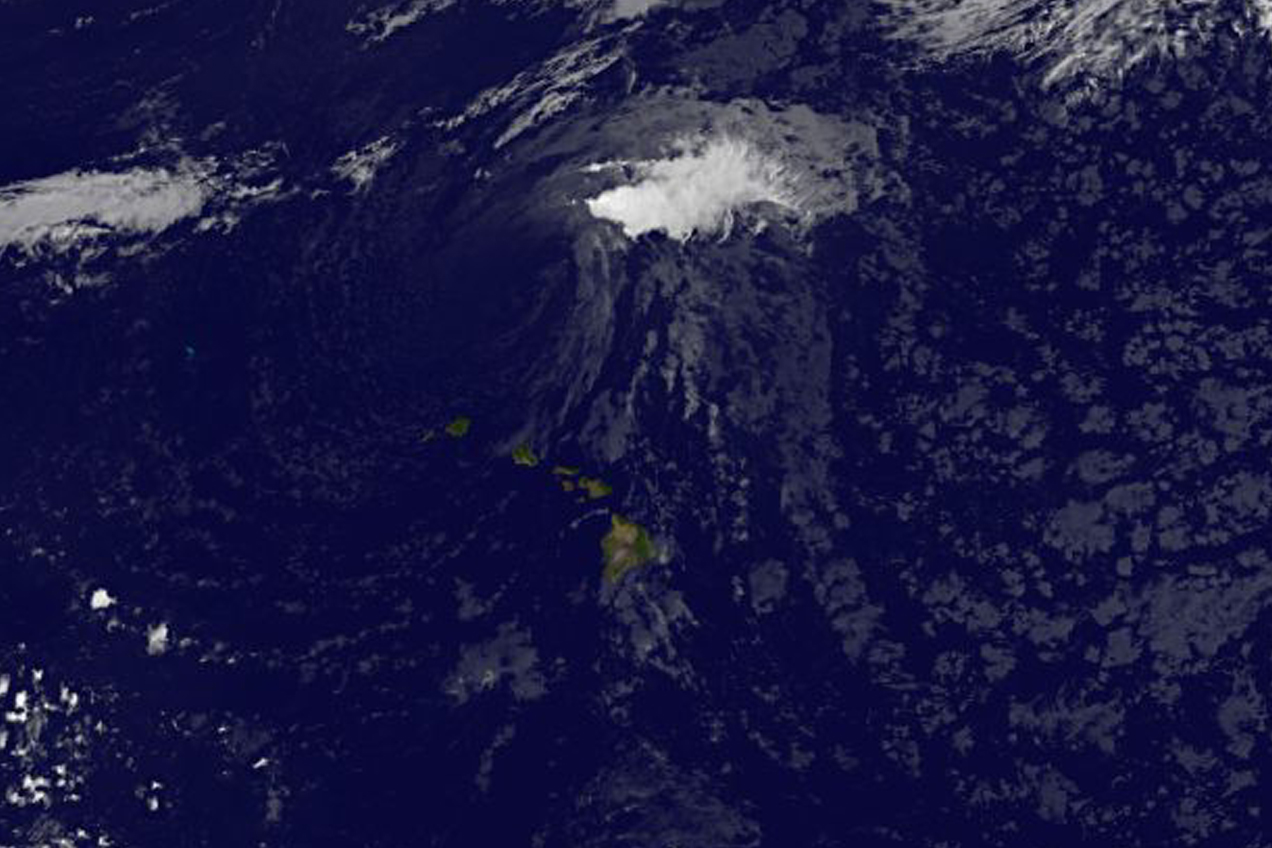
NOAA’s GOES-East satellite captured an infrared image of the remnants of what was Tropical Storm Jimena as it continued moving past the northern Hawaiian Islands on September 10.
At 8 a.m. EDT on September 10, NOAA’s Central Pacific Hurricane Center (CPHC) noted that remnant low that had been tropical depression Jimena was located around 225 miles north of Lihue, Hawaii. The remnant low has been moving west to west-southwest near 10 mph.
NOAA’s GOES-West satellite captured an infrared look at the remnant low pressure area on Sept. 10 at 10:00 a.m. EDT as it continued moving north of Hawaii. The GOES image showed that the strongest part of the remnant low was east of the center where some clouds and storms were still visible.
CPHC noted that environmental conditions will likely inhibit redevelopment of the system.
Rob Gutro
NASA’s Goddard Space Flight Center
Sep. 09, 2015 – NASA’s RapidScat Sees Tropical Storm Jimena’s Strong Side Away from Hawaii
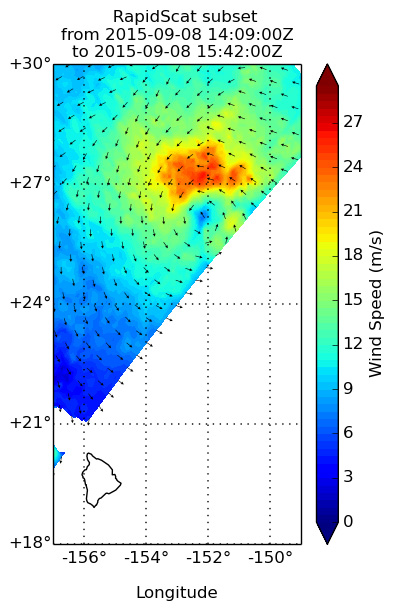
The strongest winds in Tropical Storm Jimena were on its northern side when NASA’s RapidScat instrument measured the storm’s surface winds. The following day, NOAA’s GOES-West satellite saw the strongest thunderstorms east of the center.
RapidScat is a scatterometer perched on the International Space Station (ISS) that measures surface winds over the ocean. When the ISS passed over Jimena on September 8 at 11 a.m. EDT, RapidScat saw the strongest sustained winds in Jimena near 25 meters per second (55.9 mph/90 kph) on the northern side of the storm. Winds around the rest of the circulation center were weaker.
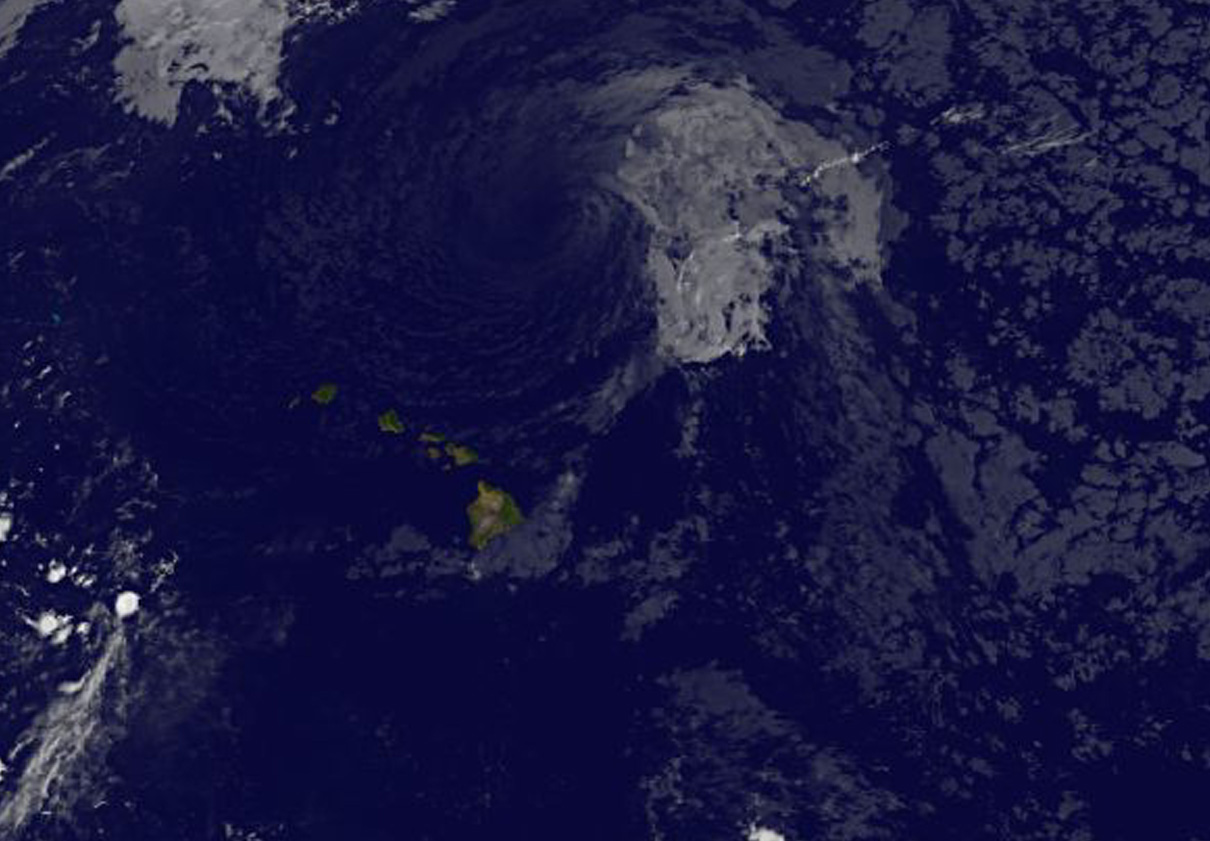
On September 9 at 0300 UTC (Sept. 8 at 11 p.m. EDT) the center of tropical storm Jimena was located near latitude 26.0 north and longitude 153.9 west. That’s about 410 miles (660 km) northeast of Honolulu, Hawaii. Jimena was moving toward the west-southwest near 8 mph (14 kph). Jimena is forecast to turn to the west by September 10.
Maximum sustained winds dropped to near 50 mph (85 kph) and NOAA’s Central Pacific Hurricane Center forecast calls for a slow decrease in strength for the next couple of days. The estimated minimum central pressure was 998 millibars.
NOAA’s GOES-West satellite captured an infrared image of Tropical Storm Jimena on Sept. 9 at 8 a.m. EDT. In the image, Jimena appears as a swirl of clouds with strongest storms on its north and eastern sides.
As Tropical Storm Jimena continues its westerly track, northeast and east facing shores of the Hawaiian Islands will continue to experience large swells and surf through Wednesday, September 9, 2015. For updated forecasts, visit the CPHC website: http://www.prh.noaa.gov/cphc.
Rob Gutro
NASA’s Goddard Space Flight Center
Sep. 08, 2015 – NASA Sees Wind Shear Affecting Tropical Storm Jimena
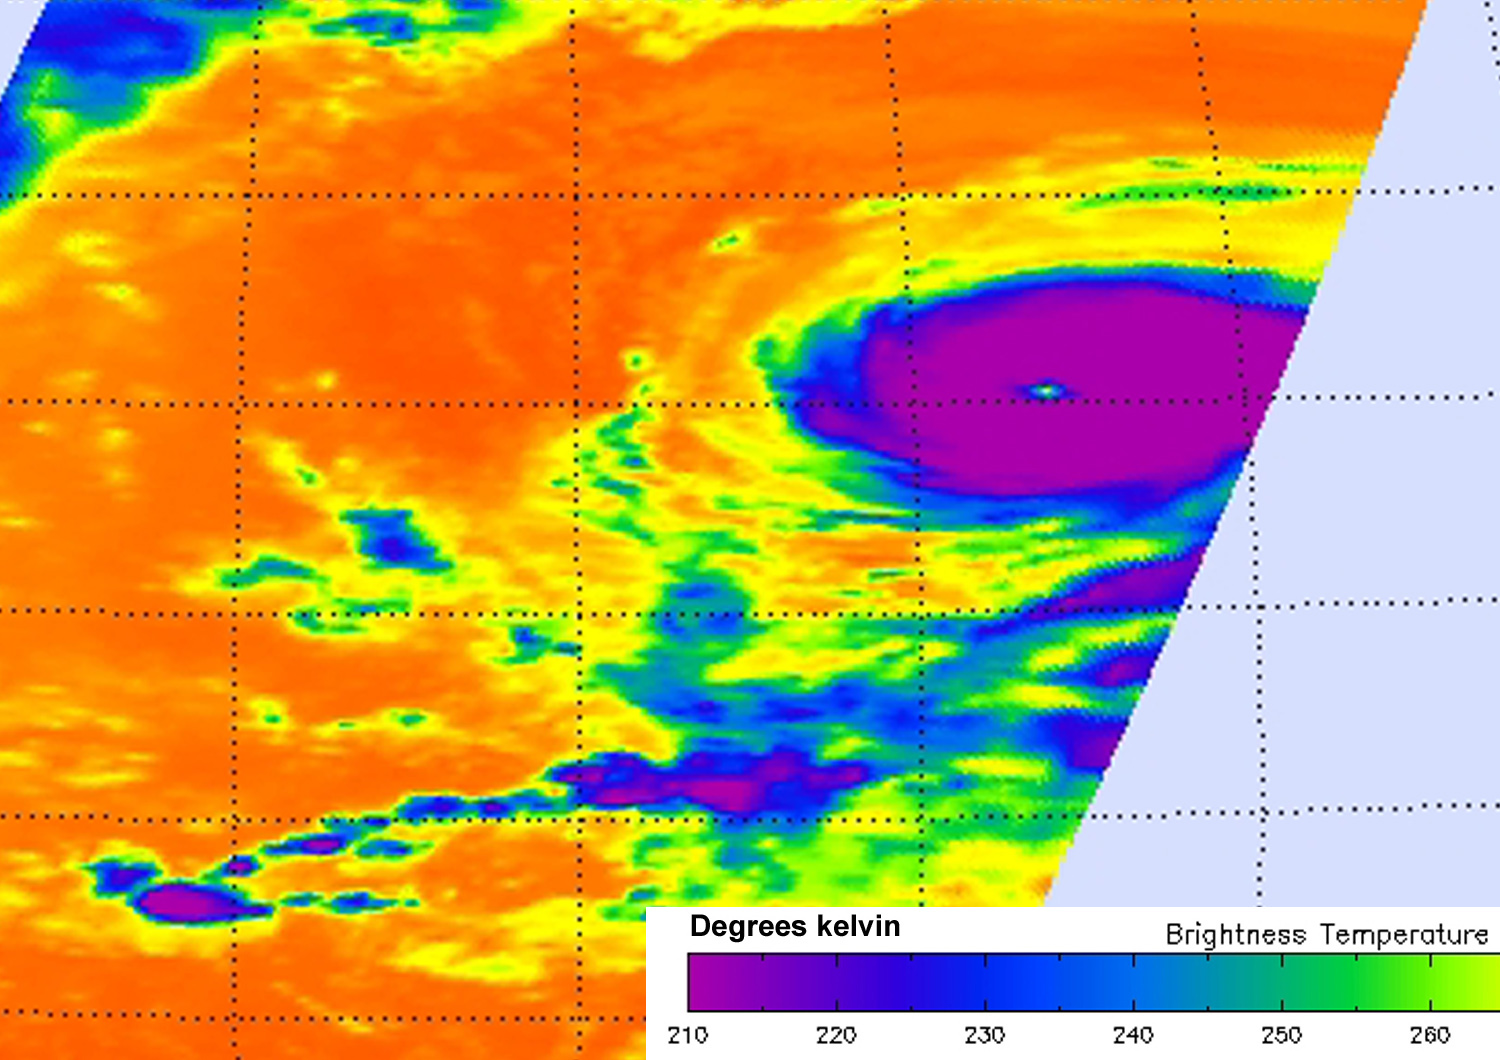
Strong vertical wind shear has been affecting Tropical Storm Jimena in the Central Pacific and pushing the clouds and storms west of the center, as seen in infrared imagery from NASA’s Aqua satellite.
The Atmospheric Infrared Sounder or AIRS instrument that flies aboard NASA’s Aqua satellite gathers infrared data that reveals temperatures. When NASA’s Aqua satellite passed over Tropical Storm Jimena on September 8 at 1147 UTC (7:47 a.m. EDT), the AIRS data and showed some highest, coldest, strongest thunderstorms with cloud top temperatures near -63F/-53C were being pushed west of the center.
Forecasters at NOAA’s Central Pacific Hurricane Center noted that “Jimena is in an increasingly hostile west to southwest [vertical] shear environment…ranging from 24 knots to 32 knots.
Vertical wind shear means the change of winds with height. Those winds interact dynamically with thunderstorms to either help or diminish the strength of vertical updrafts of rising air that forms the thunderstorms that make up a tropical cyclone.
At 11 a.m. EDT (5 a.m. HST/1500 UTC) the center of Tropical Storm Jimena was located near latitude 26.5 north and longitude 152.7 west. About 485 miles (785 km) northeast of Honolulu, Hawaii. Jimena was moving toward the west near 8 mph (13 kph) and is expected to turn toward the west-southwest on Sept. 9 and 10.
Maximum sustained winds are near 50 mph (85 kph) and the Central Pacific Hurricane Center (CPHC) expects Jimena to gradually weaken through Thursday, September 9. The estimated minimum central pressure is 996 millibars.
CPHC said that Jimena is forecast to gradually weaken through the next five days, becoming an extratropical low pressure area by September 12.
Rob Gutro
NASA’s Goddard Space Flight Center
Sep. 04, 2015 – NASA-NOAA’s Suomi NPP Sees a Weaker Hurricane Jimena
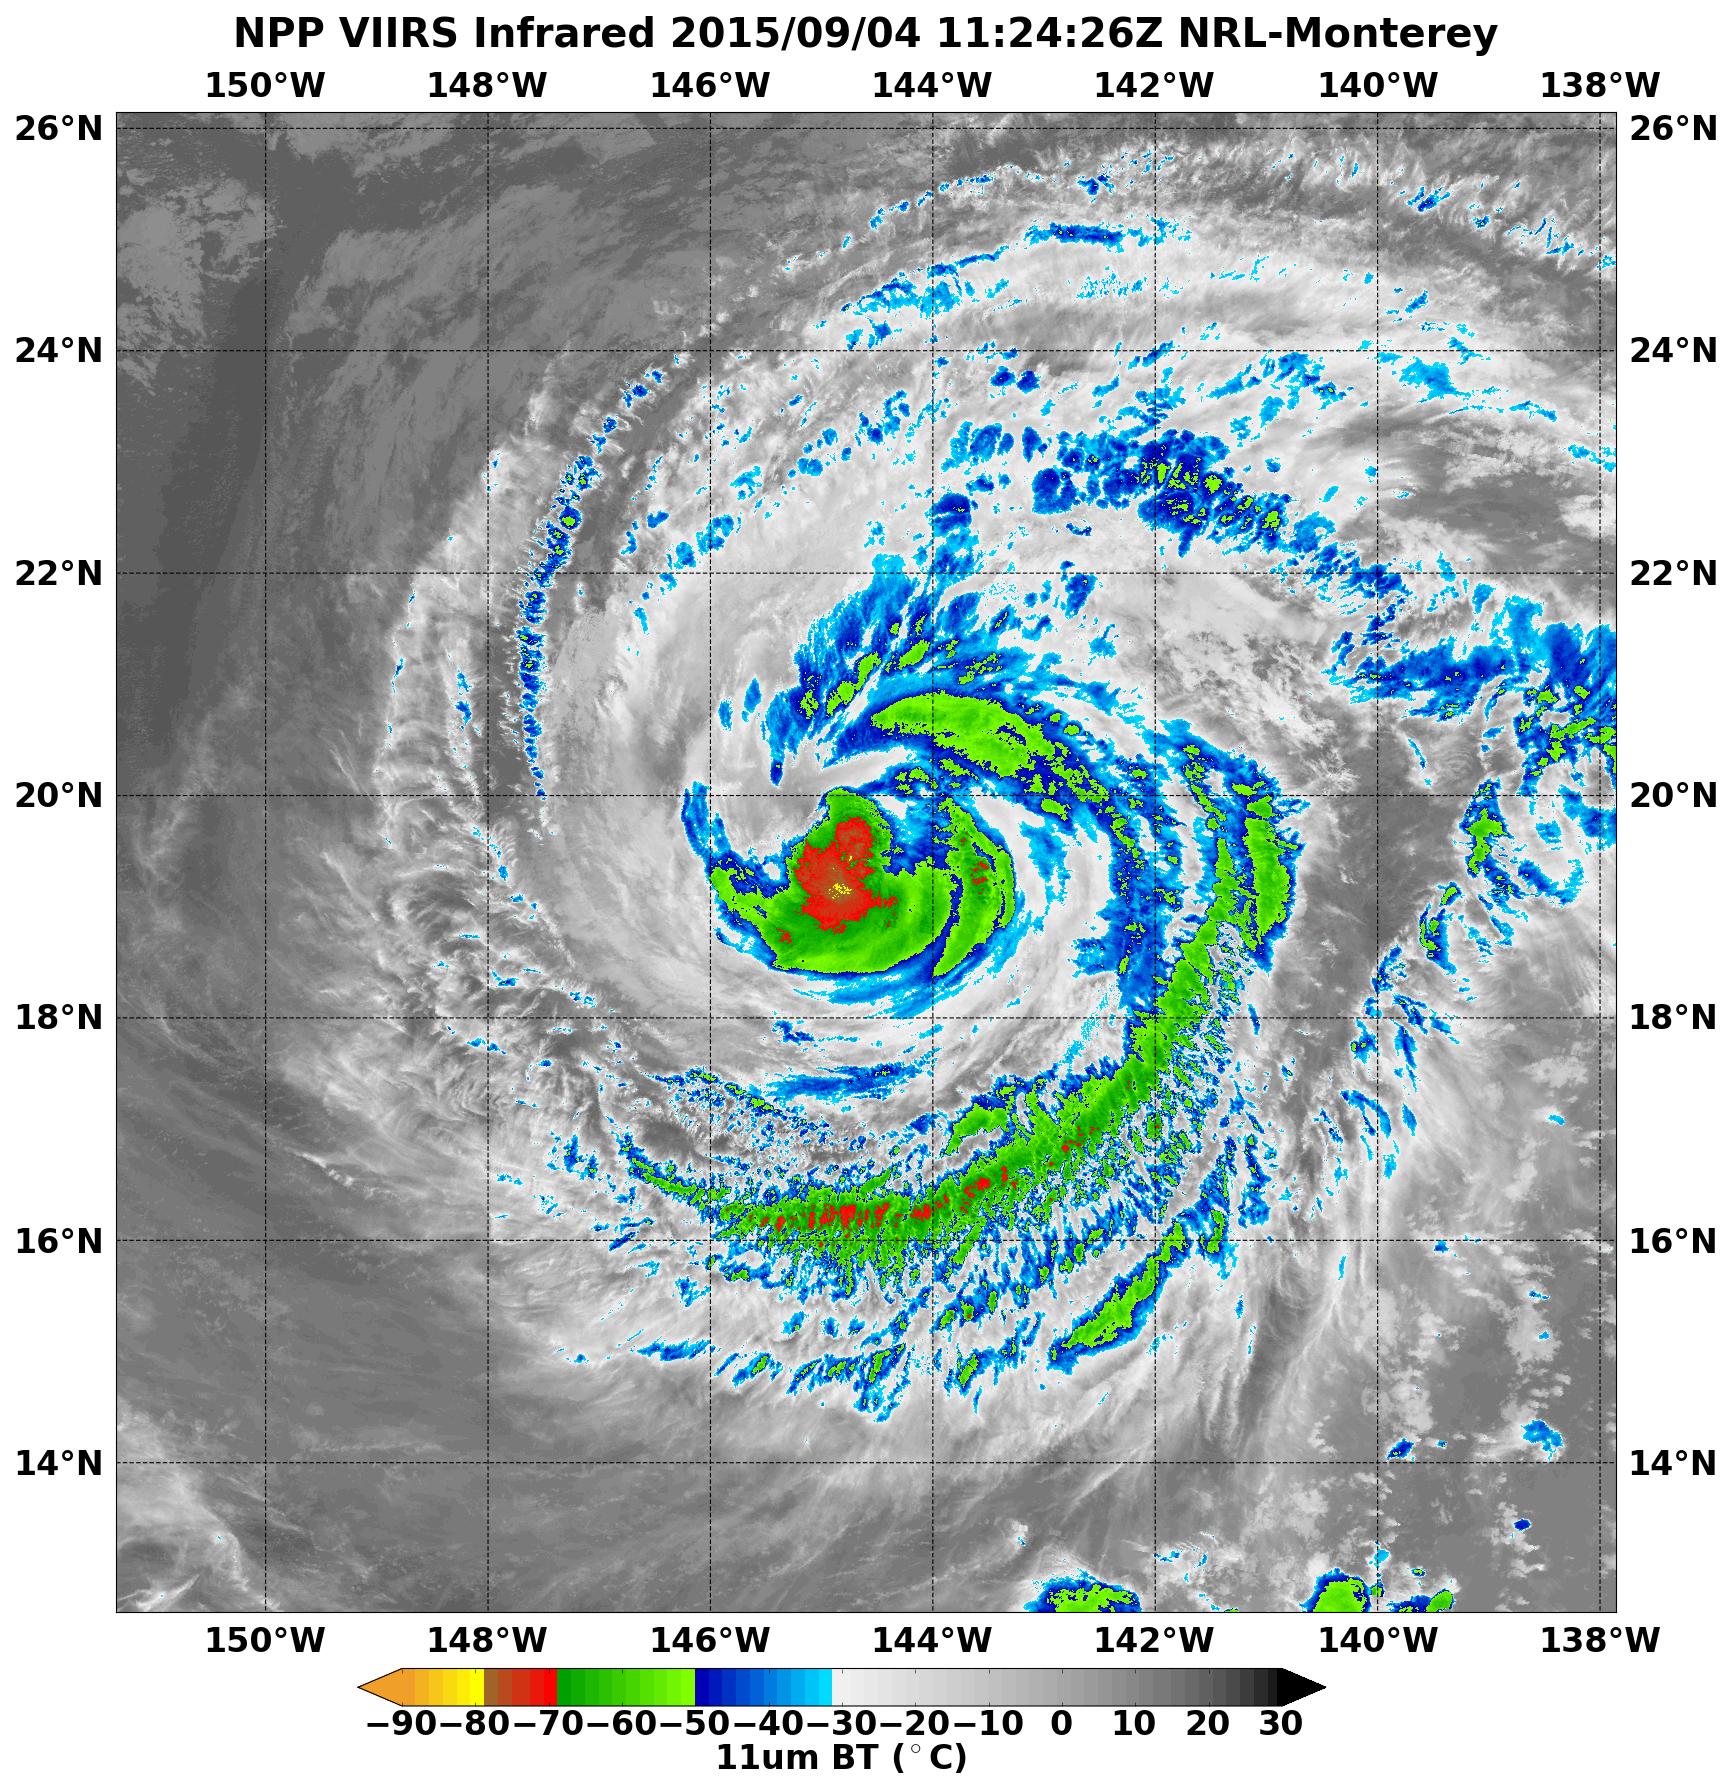
Hurricane Jimena is on a downward spiral and is expected to continue weakening. NASA-NOAA’s Suomi NPP satellite flew over Hurricane Jimena and saw the strongest thunderstorms were on its southern and northeastern sides. Jimena is expected to bring rough surf to the Hawaiian Islands over the weekend of Sept. 5 and 6.
The Visible Infrared Imaging Radiometer Suite or VIIRS instrument aboard the satellite provided infrared data of the storm that showed the coldest cloud top temperatures, which indicate the strongest thunderstorms were in Jimena’s northern quadrant. Cloud top temperatures there were as cold as -80 Celsius (-112 Fahrenheit) indicating strong storms with the potential for heavy rainfall.
NOAA’s Central Pacific Hurricane Center (CPHC) said that water vapor imagery strongly suggests that very dry is being drawn into the system which will diminish the development of thunderstorms. In addition, CPHC noted that the outflow (air at the top of the storm being pushed to the fringes of the hurricane from the center) was “showing some restrictions in the western quadrant.” In the VIIRS image, the western quadrant lacked strong thunderstorms.
VIIRS is a scanning radiometer that collects visible and infrared imagery and “radiometric” measurements. Basically it means that VIIRS data is used to measure cloud and aerosol properties, ocean color, and ocean and land surface temperatures.
On September 4, 2015, Jimena was far to the northwest of Hawaii. At 11 a.m. EDT (5 a.m. HST/1500 UTC) Jimena’s center was located near latitude 19.7 north and longitude 145.1 west. That’s about 650 miles (1,045 km) east of Hilo, Hawaii and 835 miles (1,345 km) east of Honolulu.
Despite the distance from Hawaii, the CPHC expects rough surf to continue affecting Hawaii. CPHC said “large and powerful long-period swells generated by Hurricane Jimena will produce hazardous and potentially damaging surf in the main Hawaiian islands through this weekend (Sept. 5 and 6), primarily along east facing shores.
Maximum sustained winds are near 85 mph (140 kph) and gradual weakening is expected. The estimated minimum central pressure is 975 millibars. Jimena was moving toward the northwest near 5 mph (7 kph) and is expected to move to the north-northwest. For updated forecasts visit NOAA’s Central Pacific Hurricane Center at: http://www.prh.noaa.gov/cphc.
The CPHC noted that by Monday and Tuesday, Sept. 7 and 8, an elongated area of high pressure in the middle-atmosphere situated north of Jimena is forecast to strengthen. As a result, it will likely push the storm in a westward direction. CPHC forecasts steady weakening over the next several days and by Sept. 9, expect Jimena to be a depression.
Rob Gutro
NASA’s Goddard Space Flight Center
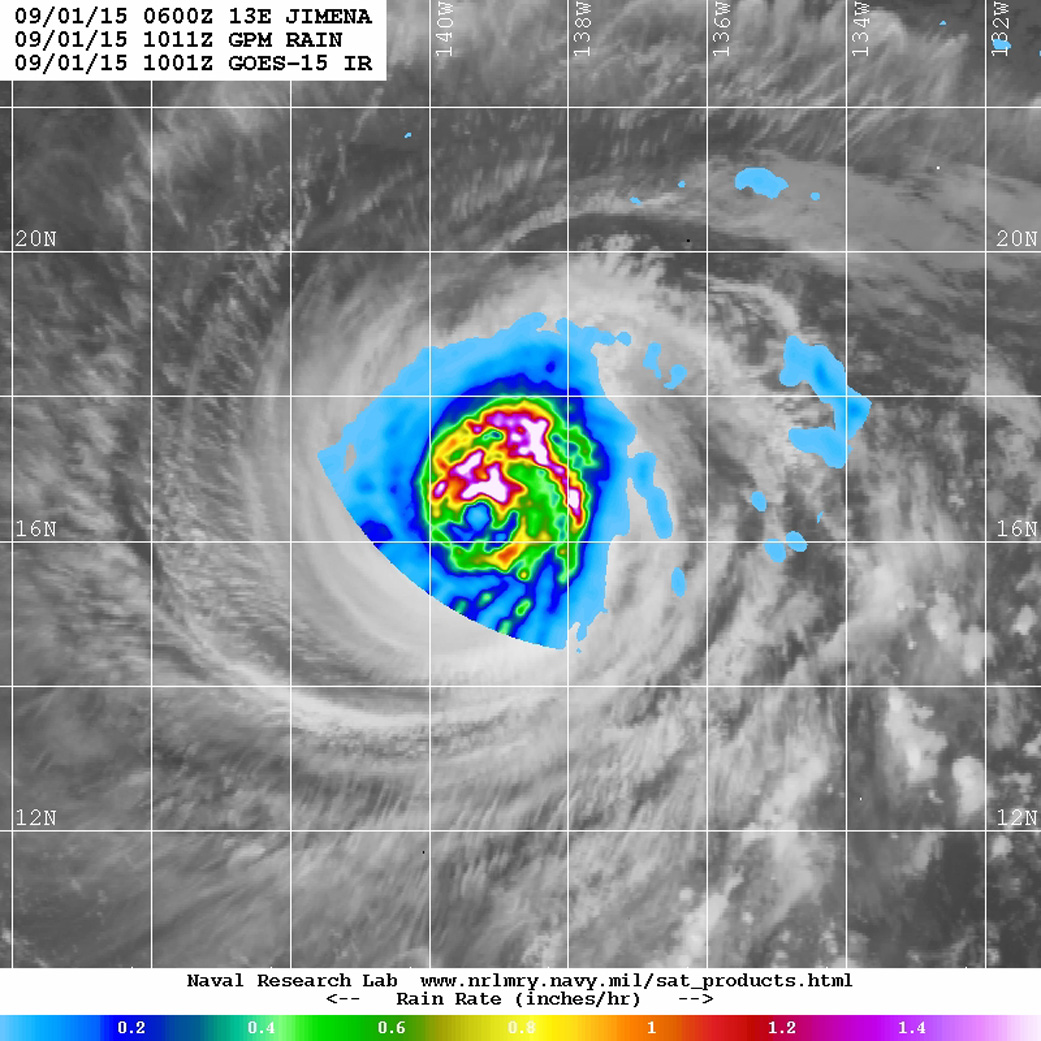
Sep. 03, 2015 – NASA’s GPM Sees Hurricane Jimena’s Eroding Eyewall
Credits: NASA/JAXA/SSAI, Hal Pierce
Hurricane Jimena, a once powerful Category 4 storm with maximum sustained winds estimated at 140 mph by the National Hurricane Center, has continued to weaken well east of Hawaii. The Global Precipitation Measurement or GPM core satellite analyzed rainfall rates and saw the eyewall was eroding.
The eyewall of a hurricane contains a storm’s most damaging winds and intense rainfall. It consists of a vertical wall of powerful thunderstorms circling a hurricane’s open eye.
GPM is a joint mission between NASA and the Japanese space agency JAXA. GPM captured data on Jimena on Thursday, September 3, 2015 at 10:01 UTC (6:01 a.m. PDT). At the time Jimena, which began to recurve to the northwest yesterday, steering it away from the Hawaiian Islands, was located about 750 east of Hilo, Hawaii and was moving slowly towards the northwest at 3 mph with maximum sustained winds estimated at 110 mph by the central Pacific Hurricane Center. GPM shows that Jimena’s eyewall continued to erode away on the southern side. Most of the rain bands south of the center have also greatly diminished.
Jimena is forecast to continue to weaken and take a more north-northwest track over the next few days. NOAA’s Central Pacific Hurricane Center noted that large swells from Jimena will produce hazardous surf along east facing shores of the main Hawaiian Islands. Surf produced by these swells will build and continue through the weekend of September 5 and 6.
Steve Lang
SSAI/NASA’s Goddard Space Flight Center
Sep. 2, 2015 – NASA’s GPM Sees Hurricane Jimena’s Intense Eyewall
NASA’s Global Precipitation Measurement or GPM core satellite passed over Hurricane Jimena and saw an intense eyewall with heaviest rainfall occurring in the northern and eastern sides of the storm.
GPM captured an image of Hurricane Jimena at 10:11 UTC (3:11 a.m. PDT) on September 1, 2015. GPM showed that Jimena was still a very strong system. An intense eyewall was seen around the northern half the still visible eye, though the southern half of the eyewall appeared to be eroded away. GPM saw a nearly circular rain band surrounding the center that completely wrapped around the storm and appears to be a possible secondary eyewall trying to form outside of the inner eyewall. Other tightly curved rainbands north and east of the center reflect Jimena’s still powerful cyclonic circulation.
At the time of the GPM image the center of the storm was located about 1,060 miles east of Hilo, Hawaii, and NHC estimated Jimena’s maximum sustained winds to be at 130 mph. GPM is a joint mission between NASA and the Japanese space agency, JAXA.
By September 2 at 1500 UTC (11 a.m. EDT), Jimena’s eye was less apparent in infrared satellite imagery, which NOAA’s Central Pacific Hurricane Center noted may be because the eyewall is in a replacement cycle (another eye wall is building behind the current eyewall, which is eroding).
At that time the center of Hurricane Jimena was located near latitude 17.7 north and longitude 142.8 west. That’s about 815 miles (1,315 km) east of Hilo, Hawaii and 1,015 miles (1,630 km) east of Honolulu.
Maximum sustained winds were near 110 mph (175 kph) making Jimena a category three hurricane on the Saffir-Simpson Hurricane Wind Scale. Gradual weakening is forecast through Thursday night, September 2.
Jimena was moving toward the west-northwest near 8 mph (13 kph) and is expected to continue in that direction before turning to the northwest on September 3.
The hurricane is close enough to the Hawaiian Islands to cause large ocean swells. CPHC noted that large swells from Hurricane Jimena will produce hazardous surf along east facing shores of the main Hawaiian Islands. The surf will build today (September 2) and continue through the weekend of September 5 and 6).
CPHC noted that environmental conditions are expected to produce only slow weakening during the next 48 hours. After 72 hours, cooler sea surface temperature values and increasing shear are expected to produce more rapid weakening.
Stephen Lang
SSAI/NASA Goddard Space Flight Center
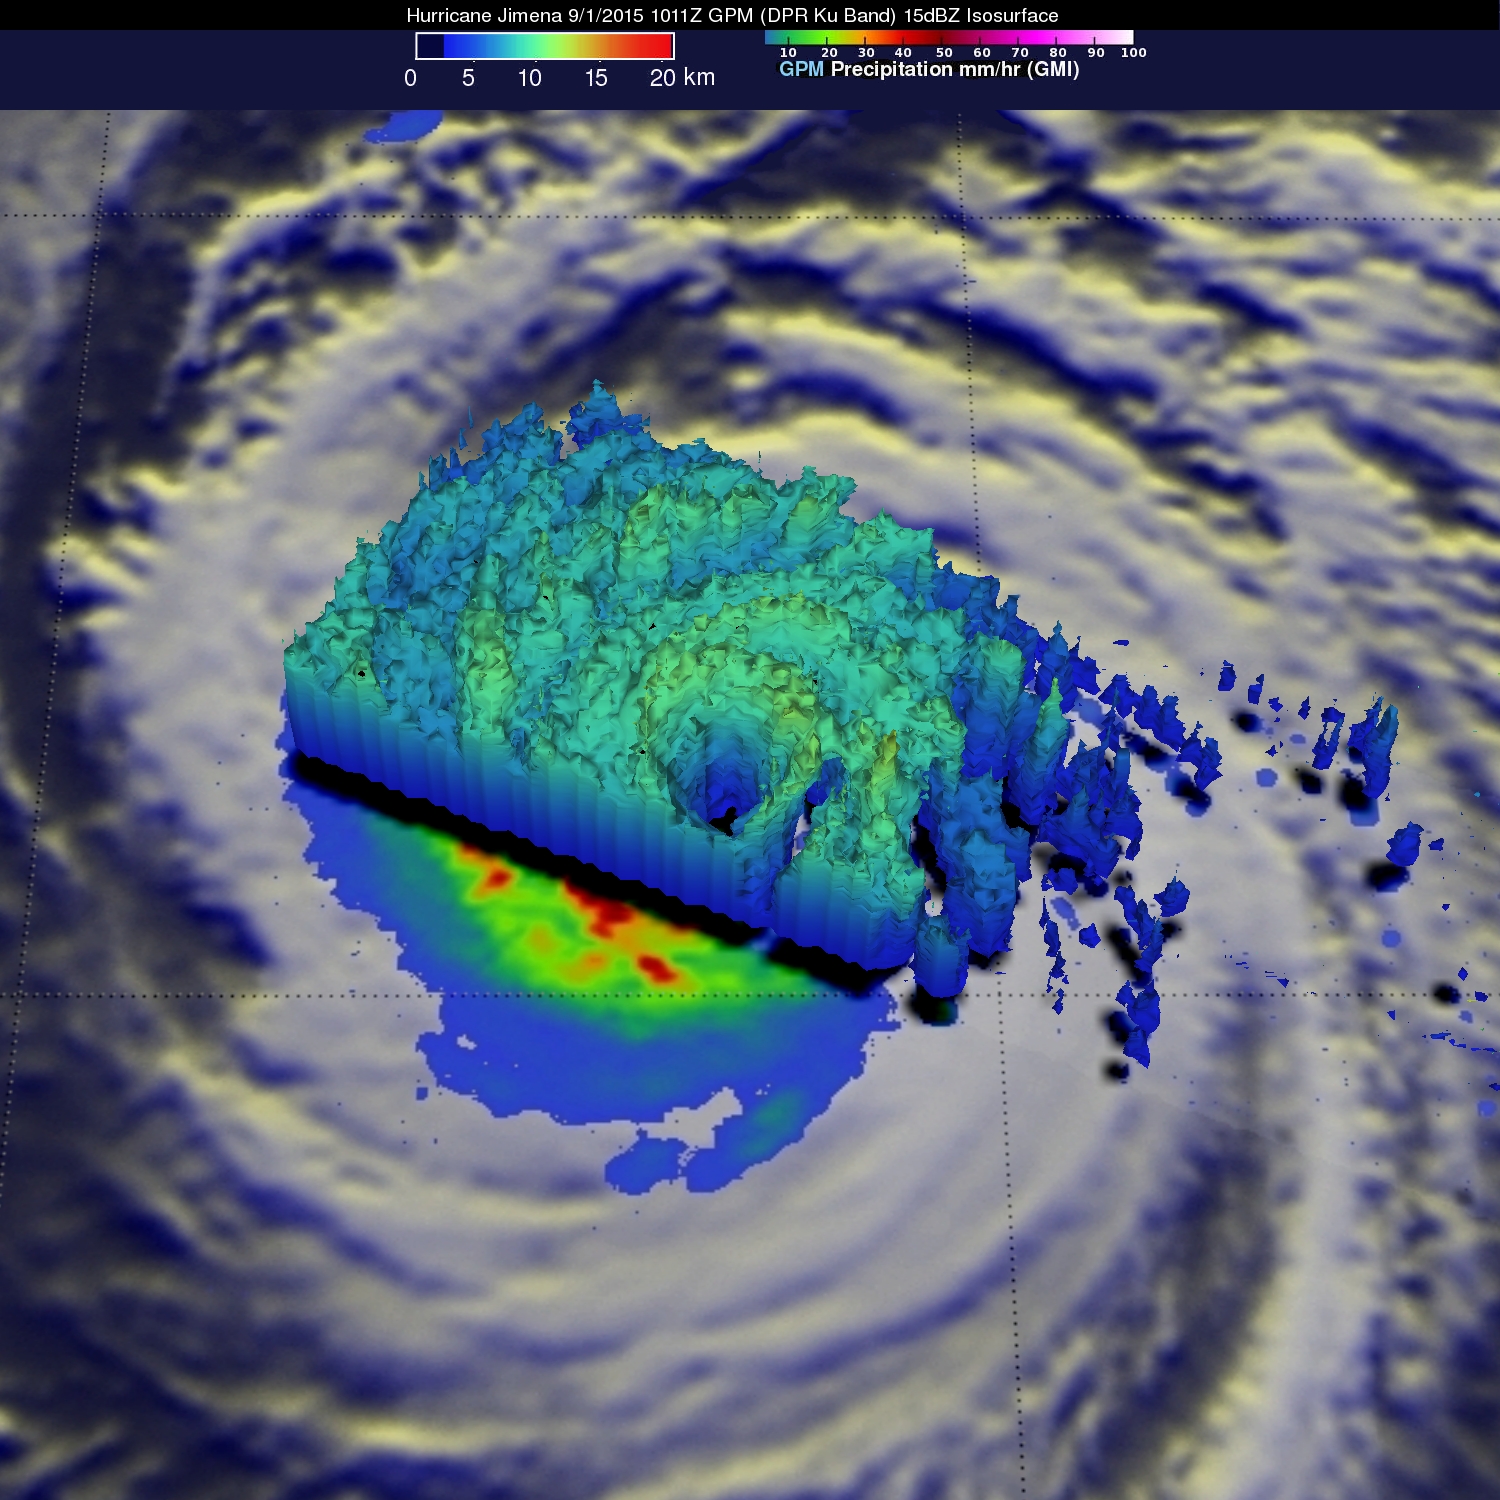
Sept. 01, 2015 – NASA’s GPM Satellite Shows Double Eyewall in Hurricane Jimena
The Global Precipitation Measurement or GPM core satellite showed a double eyewall in Hurricane Jimena on September 1 as it moved through the Eastern Pacific and into the Central Pacific Ocean.
The GPM satellite is a shared satellite between NASA and the Japan Aerospace Exploration Agency. GPM can measure rainfall rates from space and determine the heights of thunderstorms that make up a hurricane like Jimena. Very heavy rainfall was occurring in the powerful thunderstorms circling Jimena’s eye.
National Hurricane Center (NHC) forecaster Roberts noted in the 11 a.m. EDT discussion that “Enhanced infrared images and an earlier microwave overpass from the Global Precipitation Measurement satellite continue to show the presence of a double eyewall structure with evidence of erosion of Jimena’s inner eyewall in the southern portion. Since the overall presentation reveals decay of the eyewall, the initial intensity is lowered to 105 knots.”
On September 1 at 5 a.m. EDT (0900 UTC), the eye of Hurricane Jimena was located near latitude 16.4 North and longitude 139.1 West. That’s about 1,075 miles (1,730 km) east of Hilo, Hawaii. Maximum sustained winds remained near 130 mph (215 kph) and Jimena is a category 4 hurricane on the Saffir-Simpson Hurricane Wind Scale. The National Hurricane Center expects slow weakening during the next two days.
Jimena was moving toward the west near 13 mph (20 kph). A turn toward the west-northwest is expected later on September 1. The estimated minimum central pressure is 948 millibars.
Jimena has moved into the Central Pacific basin, so the Central Pacific Hurricane Center will take over forecasting for this storm.
The NHC noted that sea surface temperatures are expected to remain relatively warm ahead of Jimena for several days and wind shear doesn’t appear to be a factor affecting the storm. Jimena is expected to move in a northwesterly direction for the next couple of days.
Rob Gutro
NASA’s Goddard Space Flight Center
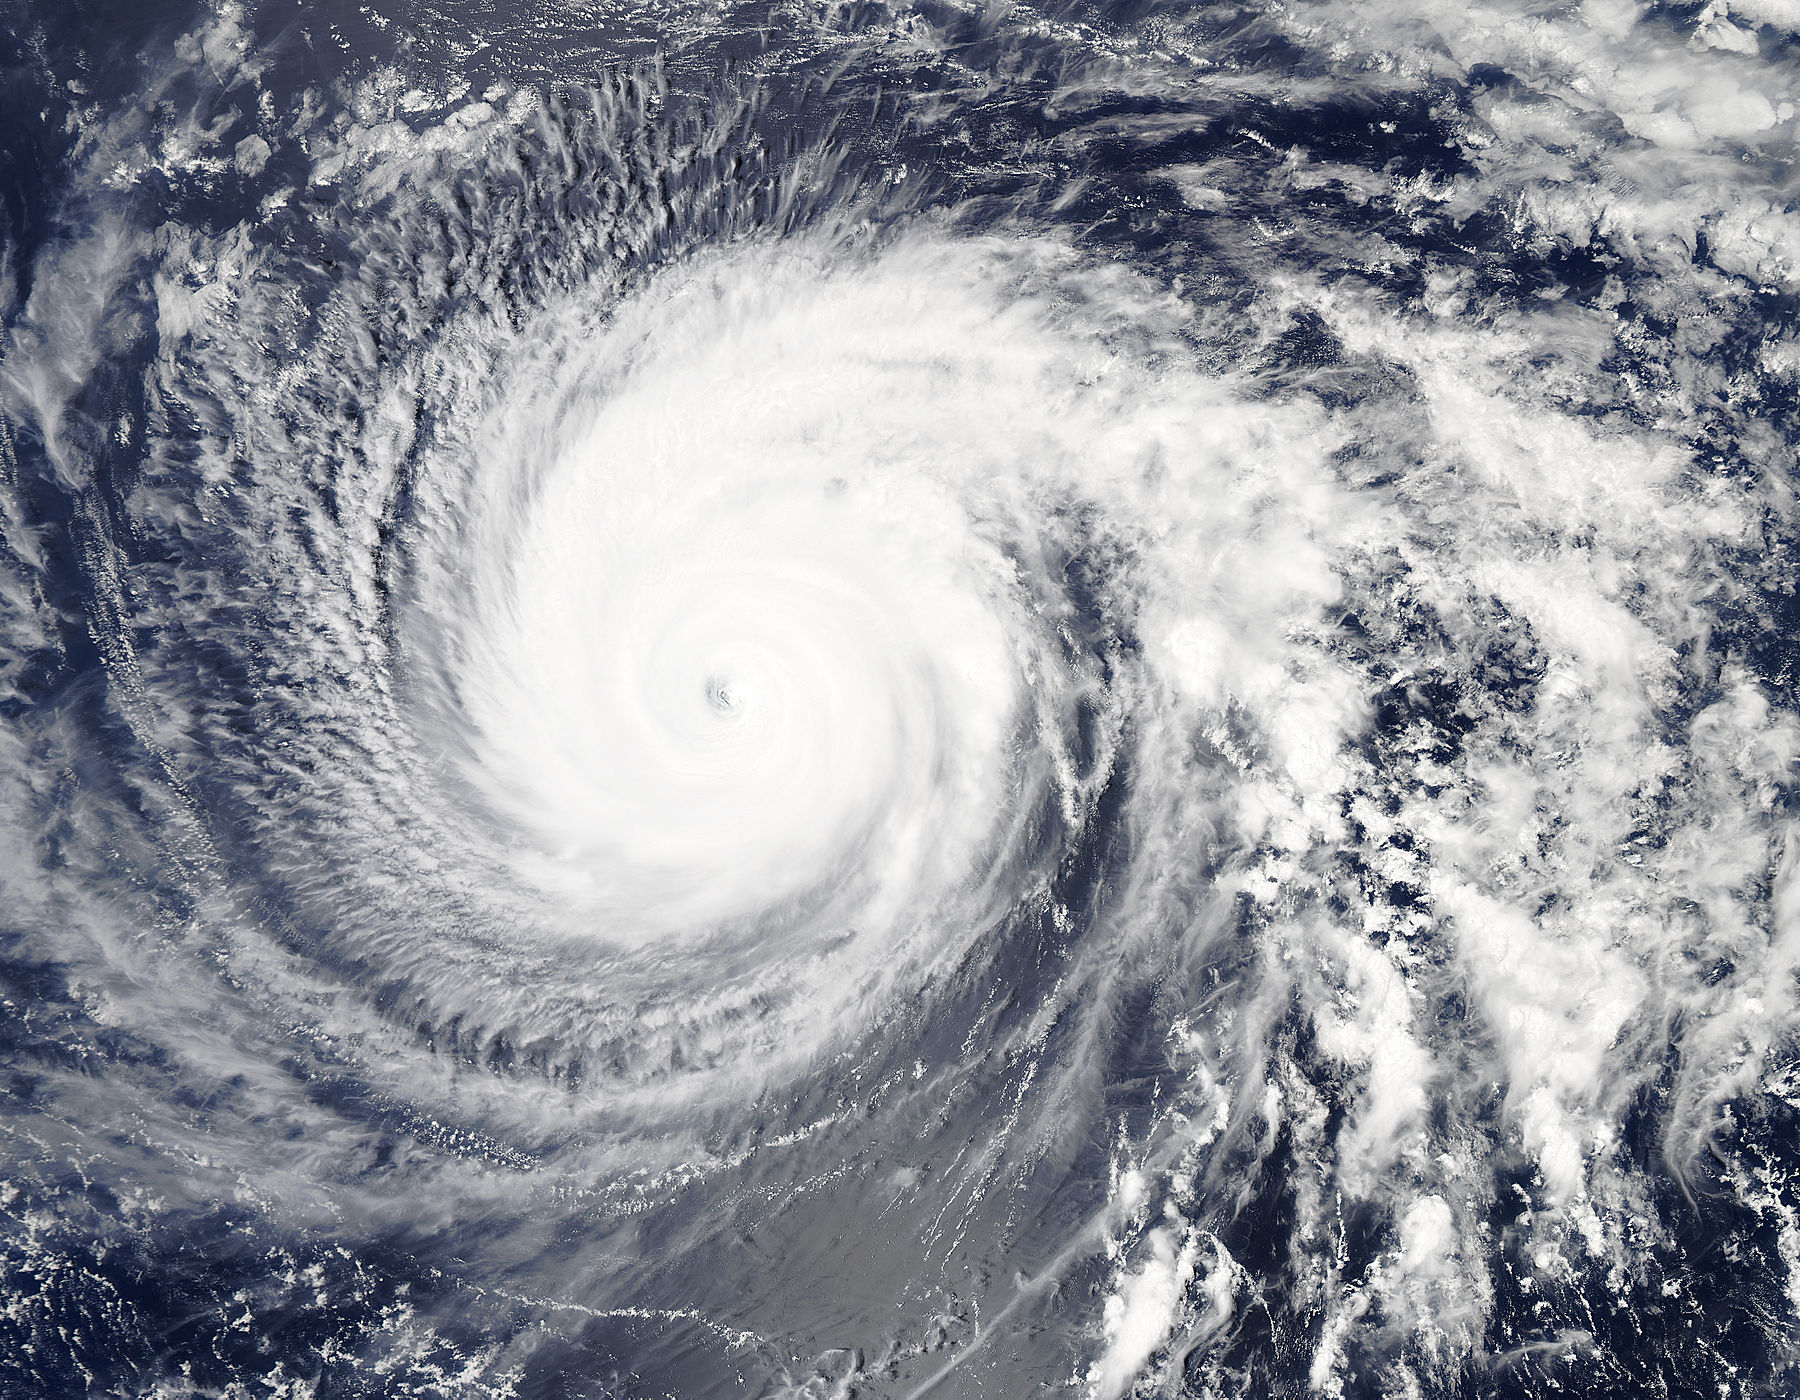
Aug. 31, 2015 – NASA Sees Hurricane Jimena’s Large Eye
NASA’s Aqua satellite and NOAA’s GOES-East satellites provided views of Hurricane Jimena that showed it maintained a large eye and powerful thunderstorms around it. On August 31, Jimena continued moving through the Eastern Pacific as a major hurricane.
An infrared image from NOAA’s GOES-West satellite on August 31 at 8:00 a.m. EDT revealed that Hurricane Jimena’s wide-eye continued to be cloud free. The GOES image also showed thick bands of powerful thunderstorms circling the eye.
The Atmospheric Infrared Sounder or AIRS instrument aboard Aqua gathers infrared data that shows temperatures. Data taken on August 31 at 10:59 UTC (6:59 a.m. EDT) was made into a false-colored image that revealed powerful thunderstorms with cloud top temperatures in excess of -81F/-63C/210K around the center of Hurricane Jimena. NASA research has shown that thunderstorms with cloud tops that cold and high in the troposphere have the potential to generate heavy rainfall.
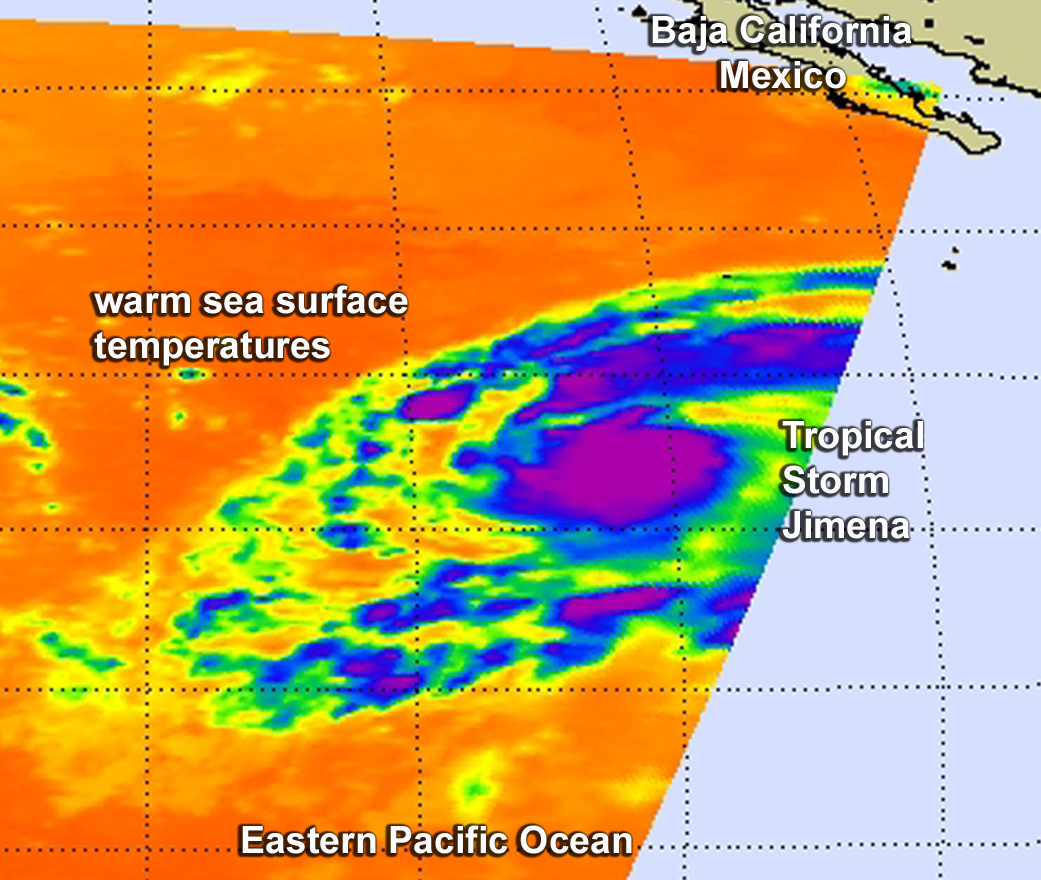
The AIRS data also showed that sea surface temperatures around Jimena were warmer than 28 degrees Celsius (82.4 Fahrenheit). Warmer sea surface temperatures can help a storm intensify because they can increase evaporation and thunderstorm development. As the warm, moist air evaporates and rises, it condenses into clouds. In a hurricane, air rotates inward toward the storm’s center then rises to higher altitudes. As the air rises it cools and condenses into clouds and rain, releasing heat (called latent heat). It is the cycle of evaporation and condensation powers a tropical cyclone.
NHC forecaster Cangialosi noted “Jimena is expected to more or less maintain its intensity during the next day or so while it remains over 28C water and in a very low wind shear environment.” Tropical cyclones need sea surface temperatures of at least 26.6C/80F to maintain intensity.
NOAA’s National Hurricane Center (NHC) on-line discussion said “the eye of the hurricane remains distinct and has a diameter of about 20 nautical miles, and the convective pattern is slightly asymmetric with cloud tops slightly warmer west of the eye.
On August 31 at 1500 UTC (11 a.m. EDT/5 a.m. HST), the center of Hurricane Ignacio was located near latitude 15.6 North and longitude 135.3 West. That’s about 1,330 miles (2,145 km) east of Hilo, Hawaii. The estimated minimum central pressure is 936 millibars.
NHC reported Jimena’s maximum sustained winds were near 150 mph (240 kph). Jimena is a category 4 hurricane on the Saffir-Simpson Hurricane Wind Scale. Little change in strength is expected during the next day or so, followed by slow weakening.
Jimena was moving toward the west near 16 mph (26 kph) and is forecast to turn to the west-northwest with a decrease in forward speed during the next couple of days.
For updated forecasts, visit NOAA’s NHC website: www.nhc.noaa.gov.
Rob Gutro
NASA’s Goddard Space Flight Center
Aug. 28, 2015 – Suomi NPP Satellite Sees Rapidly Intensifying Hurricane Jimena
NASA-NOAA’s Suomi NPP satellite flew over Hurricane Jimena in the Eastern Pacific and saw the strongest thunderstorms building up quickly, especially in the northern quadrant of the storm. Jimena intensified rapidly overnight on August 27 and early August 28 and the National Hurricane Center expects it to become a major hurricane.
The Visible Infrared Imaging Radiometer Suite or VIIRS instrument aboard the satellite provided infrared data of the storm that showed the coldest cloud top temperatures, which indicate the strongest thunderstorms were in Jimena’s northern quadrant. Cloud top temperatures there were colder than -63 Fahrenheit (-53 Celsius).
VIIRS is a scanning radiometer that collects visible and infrared imagery and “radiometric” measurements. Basically it means that VIIRS data is used to measure cloud and aerosol properties, ocean color, and ocean and land surface temperatures.
Forecaster Berg at the National Hurricane Center (NHC) noted that microwave data has shown an eye beneath the central dense overcast, and a more definitive eye is just now becoming apparent in infrared satellite imagery.
At 11 a.m. EDT (8 a.m. PDT)/1500 UTC on August 28, the center of Hurricane Jimena was located near latitude 12.4 North and longitude 122.0 West. That puts the center about 1,075 miles (1,720 km) southwest of the southern tip of Baja California, Mexico.
Jimena was moving toward the west near 12 mph (19 kph), and this motion is expected to continue through early Saturday, August 29. The estimated minimum central pressure is 979 millibars.
The NHC noted that Jimena has been rapidly intensifying, and maximum sustained winds had increased to near 90 mph (150 kph) with higher gusts. Additional strengthening is forecast during the next 48 hours, and Jimena is expected to become a major hurricane tonight, August 28.
A peak intensity is expected in about 48 hours, when NHC expects Jimena’s maximum sustained winds to reach 145 mph (125 knots), making it a powerful Category 4 hurricane on the Saffir-Simpson Scale. Thereafter, Jimena will gradually weaken due to a slightly drier environment and lower oceanic heat content values.
Rob Gutro
NASA’s Goddard Space Flight Center
Aug. 27, 2015 – Two Satellites See Newborn Tropical Storm Jimena Consolidating
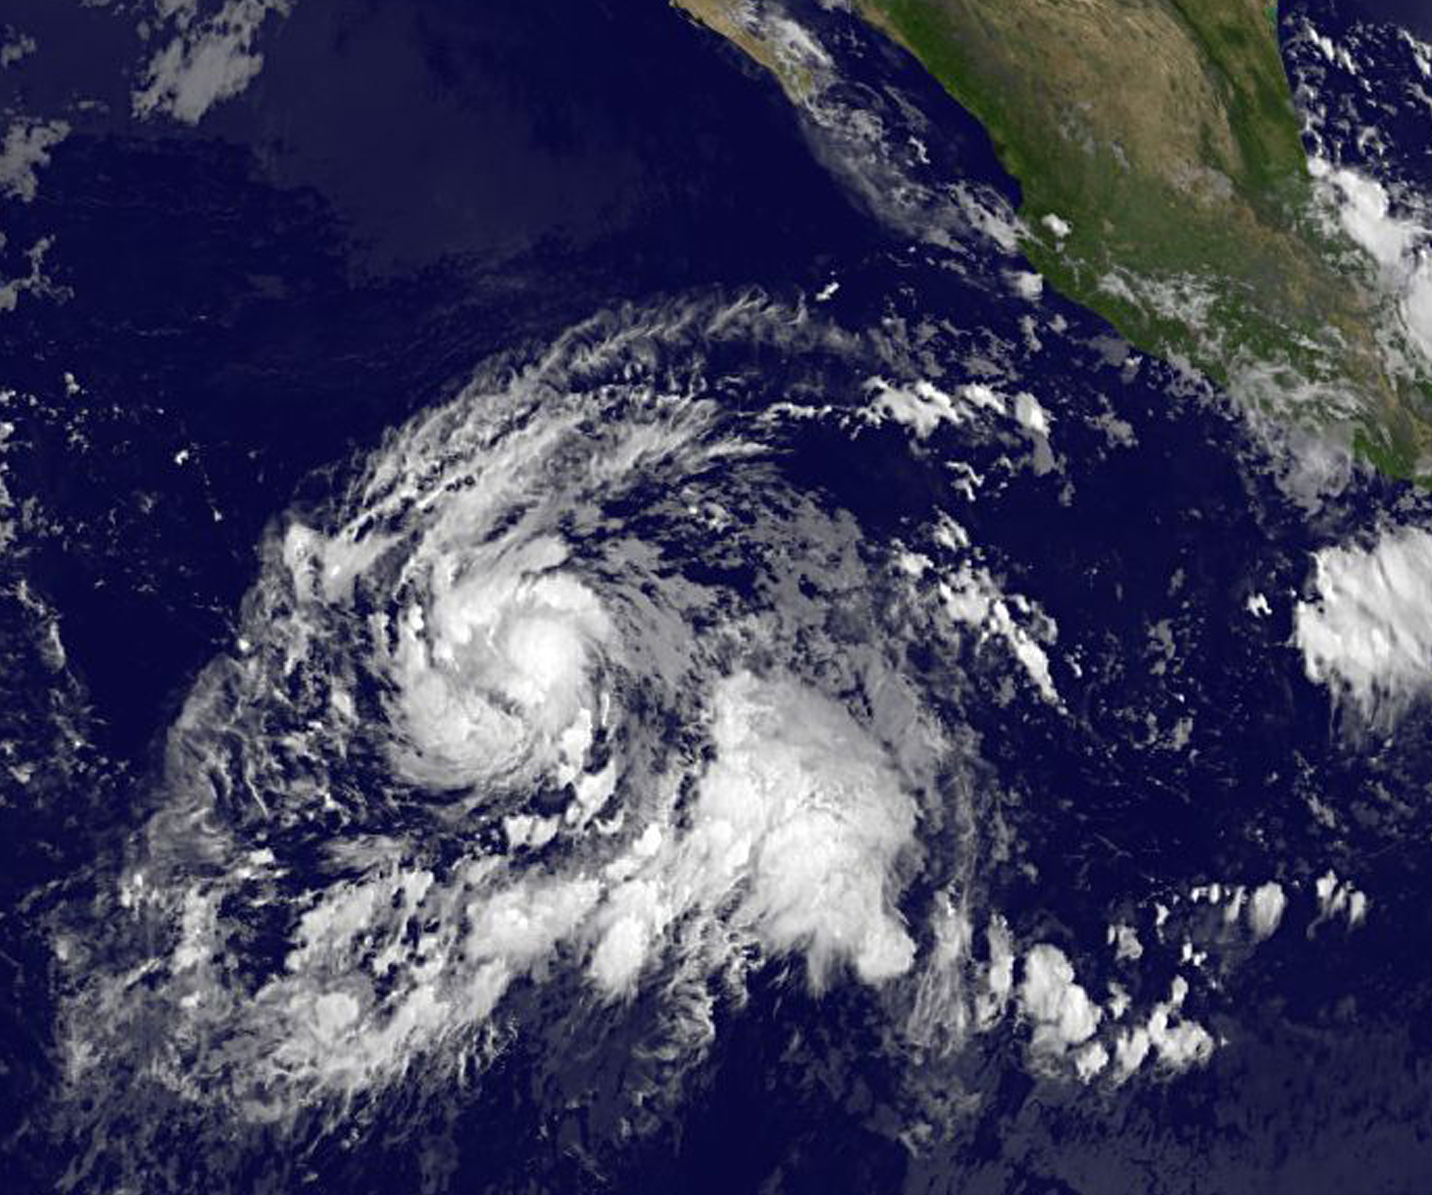
NASA’s Aqua satellite and NOAA’s GOES-West satellite provided temperature and cloud data on newborn Tropical Storm Jimena in the Eastern Pacific Ocean. Data from both satellites show the storm continues to consolidate.
Tropical Depression 13E formed about 865 miles (1,390 km) south-southwest of the southern tip of Baja California, Mexico at 5 p.m. EDT (2100 UTC) on August 26. Six hours later, the depression strengthened into Tropical Storm Jimena at 11 p.m. EDT.
A false-colored infrared image from Aug. 27 at 09:47 UTC (4:57 a.m. EDT) showed high, cold, strong thunderstorms surrounding the center of Tropical Storm Jimena. AIRS imagery also showed a thick band of thunderstorms spiraling into the northern quadrant of the storm from the east. Coldest cloud top temperatures were as cold as -63F/-53C around the center of the tropical storm. NASA research has shown that thunderstorms with cloud tops that cold and high in the troposphere have the potential to generate heavy rainfall.
At 11 a.m. EDT on August 27, Forecaster Berg of the National Hurricane Center noted that Jimena is steadily becoming better organized with deep convection persisting near the center and more pronounced banding developing around the circulation.
NOAA’s GOES-West satellite captured imagery of Tropical Storm Jimena’s clouds at 8 a.m. EDT on Aug. 27. The image showed a tight circular area of thunderstorms around the center of circulation and bands of thunderstorms from the northern and southern quadrants wrapping into the center.
On August 27 at 11 a.m. EDT (8 a.m. PDT/1500 UTC), the center of Tropical Storm Jimena was located near latitude 12.4 North, longitude 117.7 West. That’s about 890 miles (1,430 km) southwest of the southern tip of Baja California, Mexico. Jimena was moving toward the west-northwest near 17 mph and is expected to turn west and slow down later in the day. Maximum sustained winds had increased to near 45 mph (75 kph). The estimated minimum central pressure is 1003 millibars.
Credits: NASA/NOAA GOES Project
Berg’s forecast discussion noted that “rapid intensification is a distinct possibility during the next 24 hours.” Jimena is forecast to become a hurricane on August 27.