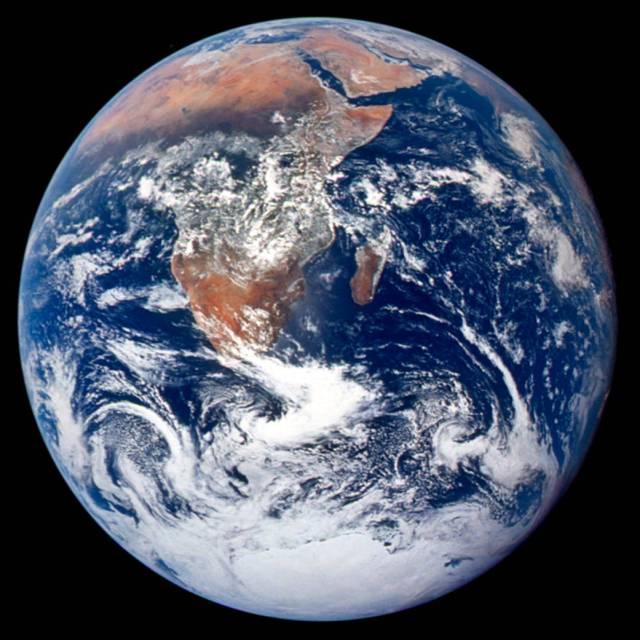


This winter, weather patterns may be fairly different than what’s typical—all because of unusually warm ocean water in the east equatorial Pacific, an event known as El Niño. Because of El Niño, California is expected to get more rain while Australia is expected to get less. Since this El Niño began last summer, the Pacific Ocean has already experienced an increase in tropical storms and a decrease in phytoplankton.
El Niño is an irregularly occurring weather phenomenon created through an abnormality in wind and ocean circulation. While it originates in the equatorial Pacific Ocean, El Niño has wide-reaching effects. In a global context, it affects rainfall, ocean productivity, atmospheric gases and winds across continents. At a local level, it influences water supplies, fishing industries and food sources.
With its scientific expertise and more than a dozen Earth-observing satellites, NASA is a leader in observing the local and global effects of El Niño. NASA data helps scientists learn more about the mechanics of an El Niño event, the interconnectedness of Earth’s climate and weather systems and how our daily lives are affected by this periodic climate event.
Discover some of El Niño’s key impacts and how NASA studies them from space:
Rainfall
El Niño often spurs a change in rainfall patterns that can lead to major flooding, landslides and droughts across the globe.
In normal, non-El Niño conditions, Pacific trade winds near the equator blow from east to west—from South America to Southeast Asia—moving warm surface water with them. The warm ocean water evaporates, adds moisture to the air and produces annual monsoons in the South Asian region. When the trade winds stop and move back east during an El Niño, water near Southeast Asia and Australia is cooler than normal, often leading to drought. Water also remains warm near South America and often spurs storms and flooding. During an El Niño, California and the Southern United States also tend to receive more rain.
The Global Precipitation Measurement mission (GPM), a joint effort of NASA and Japan Aerospace eXploration Agency, tracks precipitation worldwide and creates global precipitation maps updated every half-hour using data from a host of satellites. Scientists use the satellite data to study changes in rain and snow patterns and gain a better understanding of Earth’s climate and weather systems.
Hurricanes
El Niño also influences the formation of tropical storms. El Niño events are associated with fewer hurricanes in the Atlantic but more hurricanes and typhoons in the Pacific.
Tropical cyclones typically grow stronger as they travel over warm water and dissipate over cold water. During El Niño, normal upwelling—the processes that brings colder, deeper water to the ocean surface—is suppressed in the east equatorial Pacific. As a result, the average temperature in the Pacific is warmer than normal and aids the formation of tropical storms.
The 2015 hurricane season in the North Pacific was particularly busy, partially due to this year’s El Niño. NASA has a suite of instruments in space that can study various aspects of storms, such as rainfall activity, cloud heights, surface wind speed and ocean heat. The Moderate Resolution Imaging Spectroradiometer (MODIS) instrument on NASA’s Terra satellite captured an image of Hurricane Patricia— the ninth hurricane in the eastern Pacific to reach category 4 or 5 status during the 2015 season.

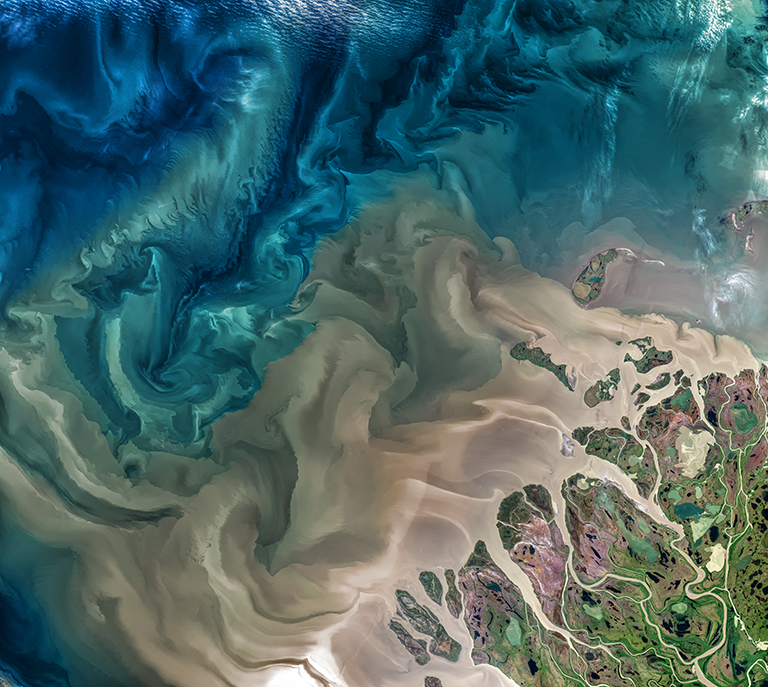
Ocean ecology
While El Niño affects land, it also impacts the marine food web, as evidenced in the color of the ocean— the hue of the water hue influenced by the presence of tiny plants, sediments and colored dissolved organic material. During El Niño, fisheries collapse and animals up the food chain starve, specifically in the east equatorial Pacific Ocean.
Under normal, non-El Niño conditions, deep ocean waters upwell in the eastern Equatorial Pacific bringing nutrient-rich, cold water to the surface. When the water reaches the surface, this combination of abundant nutrients and sunlight helps phytoplankton—microscopic algae that form the base of the marine food web— to grow. During El Niño conditions, upwelling is suppressed and the deep, nutrient-rich waters no longer reach the surface, causing less phytoplankton productivity. With less food, the fish population declines, severely affecting fishing industries.
NASA satellites measure the color of the ocean to derive surface chlorophyll, a pigment in phytoplankton vital for photosynthesis, and observe lower total chlorophyll amounts during El Niño events in the equatorial Pacific Ocean. In the visualization below from NASA’s Sea-Viewing Wide Field-of-View Sensor (SeaWIFS) instrument, there is a decline in phytoplankton during the El Niño of 1997-‘98 and an increase during the La Niña event of 1998-99. Scientists will continue to use SeaWIFS to monitor the ocean color during this current El Niño season.
Ozone
El Niño also influences ozone— a compound that plays an important role in the Earth system and human health. At ground level, ozone affects air quality. Higher in Earth’s atmosphere in a layer known as the troposphere, ozone is a greenhouse gas, which stops some of the heat from escaping to space and keeps the surface warm.
When a strong El Niño occurs, there is a substantial change in the major east-west tropical circulation, causing a significant redistribution of atmospheric gases like ozone. These changes occur vertically throughout the troposphere and cause higher ozone levels over Indonesia and lower levels over much of the tropical central and eastern Pacific Ocean during an El Niño.
Scientists use NASA’s Aura satellite to measure ozone concentrations in the troposphere. With more than a decade of Aura data, researchers are able to separate the response of ozone concentrations to an El Niño from its response to changes in human activity, such as manmade fires.
Most ozone is found in Earth’s stratosphere—higher than where most planes fly—where it acts as a shield that absorbs and screens humans from most harmful ultraviolet light from the sun. NASA has been monitoring stratospheric ozone and the ozone layer via satellite starting in the late 1970s and continues to make measurements with the Aura satellite as well as Suomi National Polar-orbiting Partnership, a joint satellite mission with the National Oceanic and Atmospheric Administration. Although El Niño has a greater effect on ozone in the troposphere, scientists are learning how it also modifies ozone concentrations in the stratosphere, sometimes changing concentrations in the tropics by about 15 percent.
Fires
El Niño conditions shift patterns of rainfall and fire across the tropics. During El Niño years, the number and intensity of fires increases, especially under drought conditions in regions accustomed to wet weather. During past El Niño events, Indonesia, Central America and the southern and central Amazon experienced more fire activity than normal.
While fires damage rainforests, croplands and grazing lands, they also emit greenhouse gases—carbon dioxide and methane—that trap heat in the atmosphere and contribute to global warming. For instance, during the 2002 and 2006 El Niño events, fire emissions in equatorial Asia increased by a factor of 10 compared to normal years.
NASA’s MODIS instruments on Aqua and Terra satellites provide a global picture of fire activity. MODIS was specifically designed to observe fires, allowing scientists to discern flaming from smoldering burns. The long time series of MODIS data (2000-present) now covers a strong El Niño event, linking estimates of changing fire activity to the amounts of particles and gases that fires release into the atmosphere.
For updates, visit NASA Center for Climate Sciences: El Nino Observations page:
http://climatesciences.jpl.nasa.gov/enso
For the latest imagery, visit NASA’s El Nino/La Nina Watch page: