


Satellite Movie Sees Bonnie’s Remnants Fizzle in Atlantic
The National Hurricane Center in Miami, Florida, issued their final advisory on former Tropical Cyclone Bonnie on Sunday, June 5, 2016 at 0300 UTC (Sat. June 4 at 11 p.m. EDT). An animation of satellite imagery from NOAA’s GOES-East satellite from June 4 to June 6 showed Bonnie being torn apart by wind shear.
Credits: NASA/NOAA GOES Project
On Sunday, June 5, 2016 at 0300 UTC (Sat. June 4 at 11 p.m. EDT), Post-Tropical Cyclone Bonnie’s center was located near 34.7 degrees north latitude and 63.6 degrees west longitude in the western Atlantic Ocean. The low pressure area was moving toward the east-southeast or 105 degrees at 14 knots. Estimated minimum central pressure was 1009 millibars, and maximum sustained winds were near 30 knots (35 mph). However, the winds and seas varied greatly in each quadrant.
Bonnie had moved away from the coast and was not generating any high waves along the Eastern Seaboard, so there were no coastal watches or warnings in effect.
By 9 a.m. EDT on June 5, the GOES-East satellite imagery showed the storm had been sheared apart as Tropical Storm Colin formed in the western Caribbean Sea.
Rob Gutro
NASA’s Goddard Space Flight Center, Greenbelt, Md.
June 2, 2016 – NASA’s GPM Satellite Sees Some Heavy Rainfall in Tropical Depression Bonnie
The Global Precipitation Measurement mission known as GPM passed over Tropical Depression Bonnie and found heavy rainfall from a few thunderstorms within.
Tropical Storm Bonnie weakened to a tropical depression on May 29, 2016. The circulation was labeled as “post-tropical” and has been moving very slowly to the northeast near the Carolinas coastline. Bonnie developed organized convection near the center and on June 2 the system was again labeled a tropical depression.
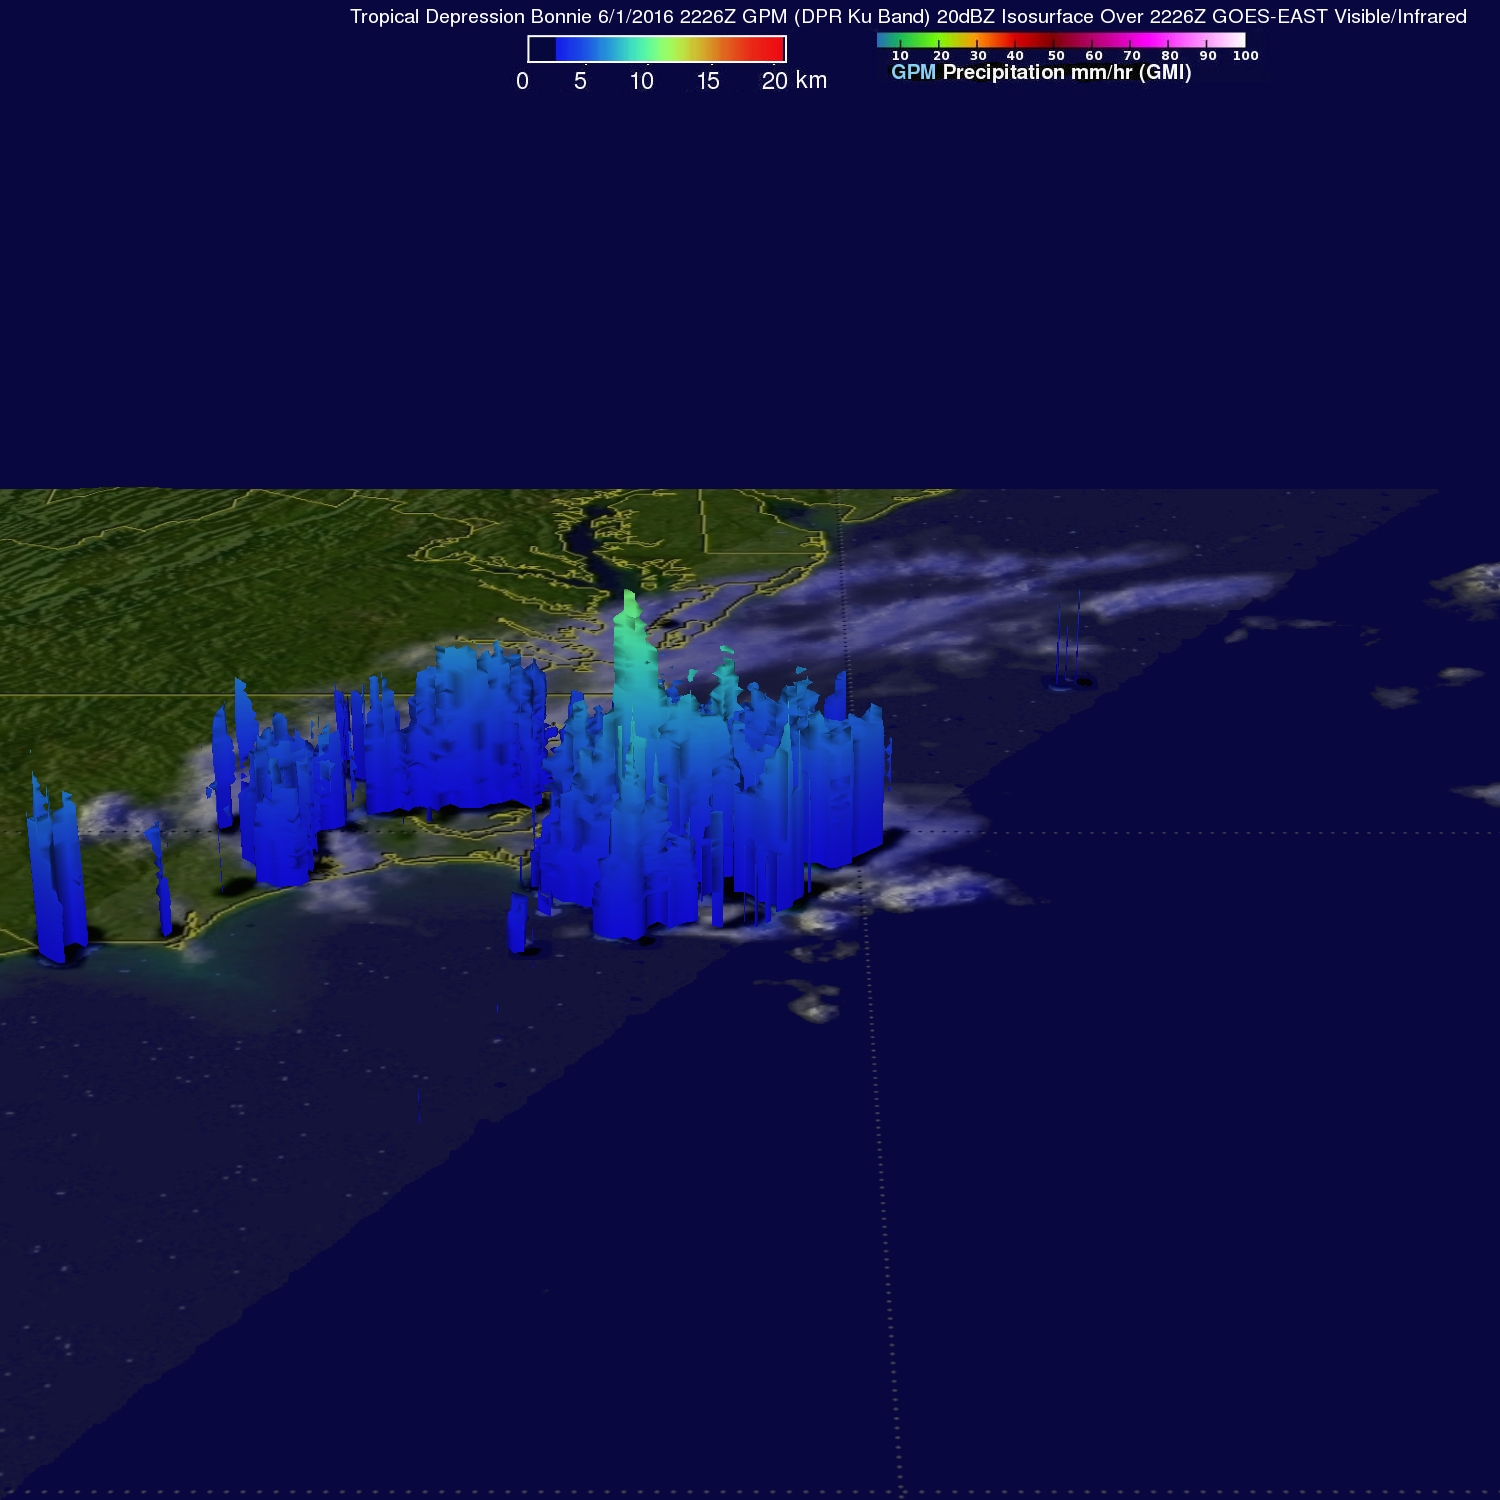
The GPM Core Observatory satellite saw Tropical Depression Bonnie on June 1, 2016, at 6:26 p.m. EDT (22:26 UTC). GPM’s Microwave Imager (GMI) and Dual-Frequency Precipitation Radar (DPR) instruments measured precipitation in a few powerful convective thunderstorms falling at a rate of almost 4.9 inches (124 mm) per hour. Storm top heights of more than 9.3 miles (15 km) were found by GPM’s Radar (Ku Band). GPM is a joint mission between NASA and the Japan Aerospace Exploration Agency (JAXA).
On June 3, the National Hurricane Center (NHC) noted that although Bonnie is pulling away from the U.S. East Coast, dangerous surf conditions are still possible along portions of the North Carolina coast, including the Outer Banks, through today. There are no coastal watches or warnings in effect.
At 5 a.m. EDT (9:00 UTC) on June 3 the center of Tropical Depression Bonnie was located near 35.8 degrees north latitude and 73.3 degrees west longitude. That puts the center about 130 miles (210 km) east-northeast of Cape Hatteras, North Carolina.
The NHC said that depression was moving toward the east-northeast near 8 mph (13 kph), and a turn toward the east with increasing forward speed is expected over the next 48 hours. Maximum sustained winds are near 35 mph (55 kph) with higher gusts. NHC said that some strengthening is possible today, and Bonnie could again become a tropical storm. Weakening should begin by tonight, however, and Bonnie is forecast to become a post-tropical cyclone on Saturday. The estimated minimum central pressure is 1,006 millibars.
By June 4, 2016, increased vertical shear and colder sea surface temperatures are expected to cause Bonnie to again weaken to post-tropical remnants.
Hal Pierce and Rob Gutro
NASA’s Goddard Space Flight Center, Greenbelt, Md.
NASA Sees a Redeveloped Tropical Depression Bonnie Over North Carolina
On the morning of June 2, the National Hurricane Center reported that post-tropical cyclone Bonnie has redeveloped into a tropical depression and was moving over the North Carolina Outer Banks. NASA-NOAA’s Suomi NPP Satellite and NOAA’s GOES-East satellite captured imagery and an animation that showed the movement of the storm.
Bonnie continues to pose a threat of heavy rain that is expected to continue today, June 2, in eastern North Carolina. The National Weather Service issued a flood watch and flood advisory for a small portion of the North Carolina Outer Banks.
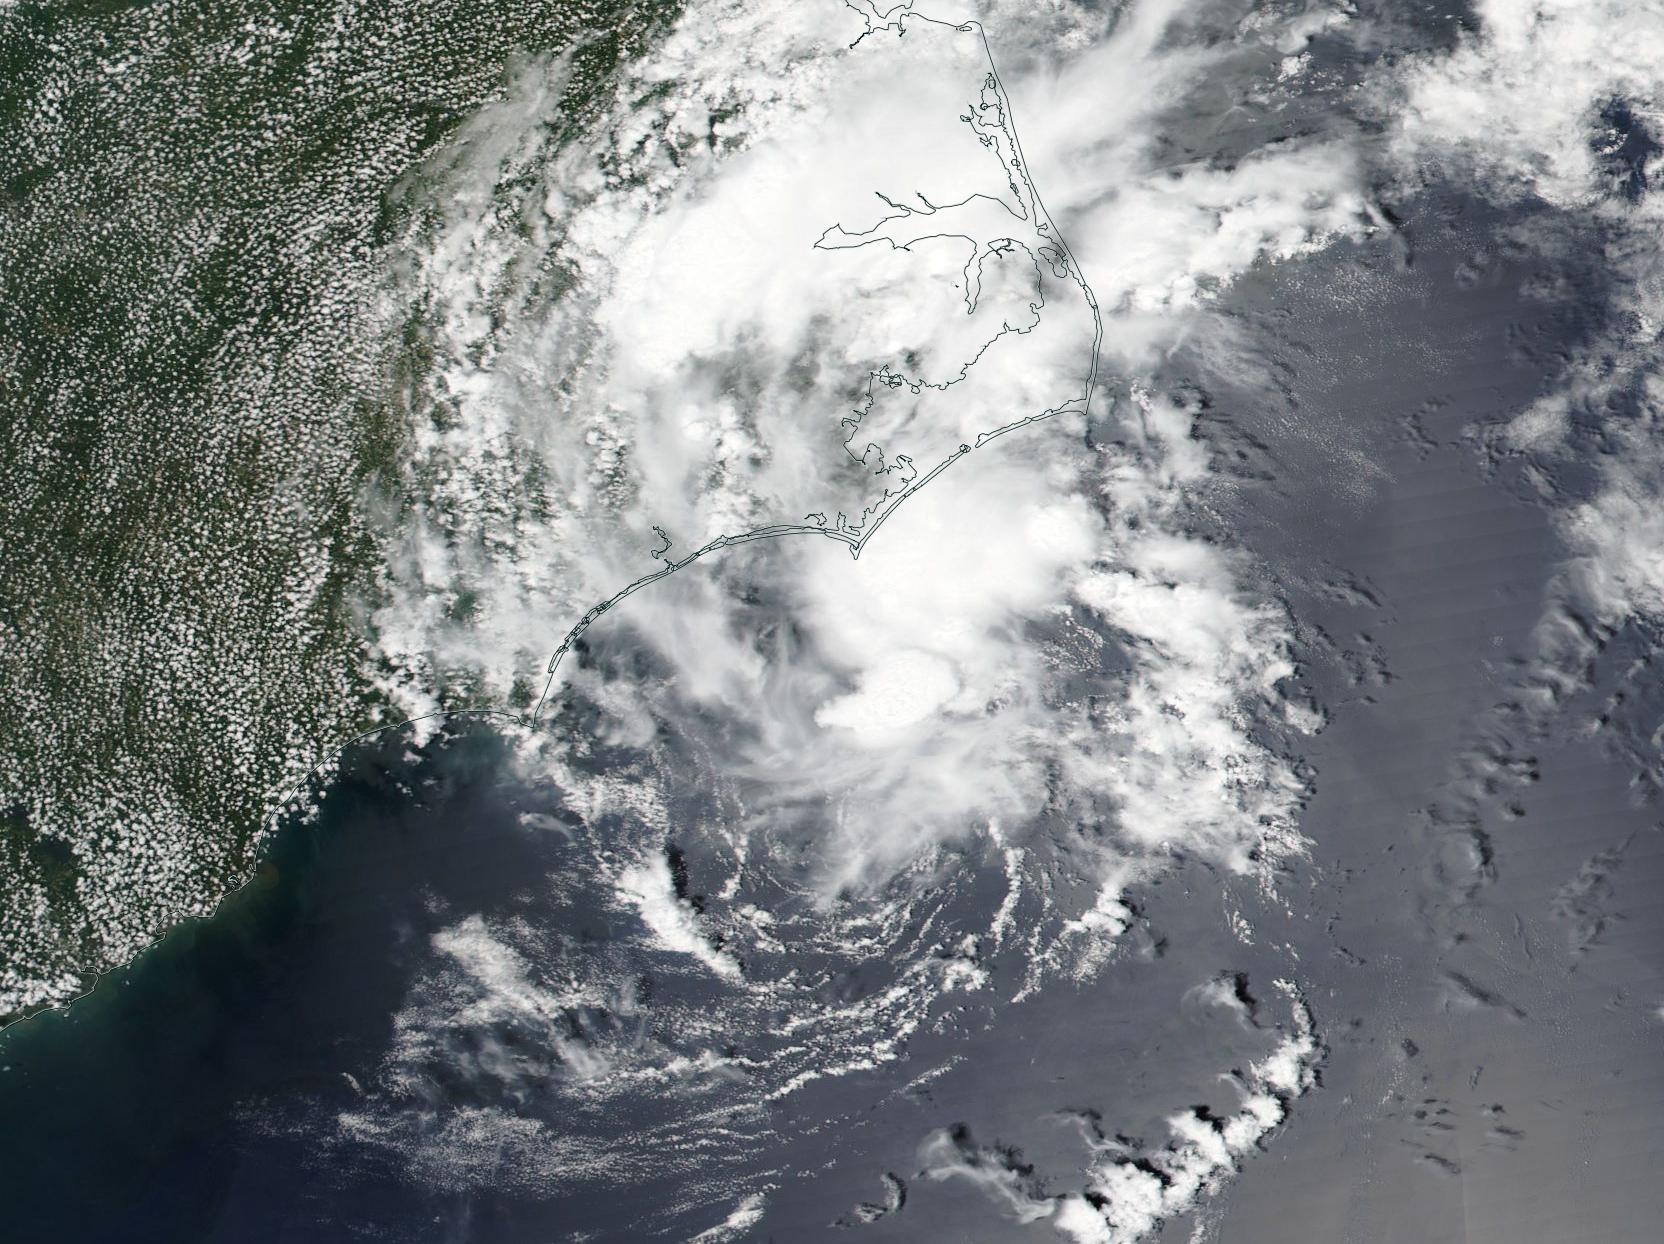
A visible image of Bonnie was taken from the Visible Infrared Imaging Radiometer Suite (VIIRS) instrument aboard NASA-NOAA-DOD’s Suomi NPP satellite on June 1, 2016. The image showed Bonnie when it was a post-tropical cyclone, moving over southeastern North Carolina. The strongest thunderstorms were northwest of the center of circulation over land and southeast of the center, over the Atlantic Ocean.Bonnie strengthened back to a depression early on June 2.
Credits: NASA/NOAA GOES Project
An animation NOAA’s GOES-East satellite imagery from May 31 to June 2 was created at NASA’s GOES Project at NASA’s Goddard Space Flight Center in Greenbelt Maryland. The animation shows the slow northerly movement of Bonnie from South Carolina to North Carolina as it strengthened from a post-tropical cyclone back into a depression. NOAA manages the GOES-East satellite and the NASA GOES Project uses the satellite data to create images and animations.
The National Hurricane Center (NHC) said that at 11 a.m. EDT (1500 UTC) the center of Tropical Depression Bonnie was located near latitude 35.1 degrees north and longitude 75.1 degrees west. That puts the center of the redeveloped depression about 25 miles (40 km) east-southeast of Cape Hatteras, North Carolina. NHC said that Bonnie is moving toward the northeast near 7 mph (11 kph). A turn toward the east-northeast and an increase in forward speed are expected later today. On the forecast track, the center of Bonnie should/pre> move away from the coast of North Carolina this afternoon and tonight. Maximum sustained winds are near 30 mph (45 km/h) with higher gusts. Some slight strengthening is possible during the next 24 hours. After that time, Bonnie is expected to again become a post-tropical low.
For updates from the NHC, visit: www.nhc.noaa.gov
Rob Gutro
NASA’s Goddard Space Flight Center, Greenbelt, Md.
June 01, 2016 – NASA Watching Slow-Moving Post-Tropical Cyclone Bonnie’s Remnants
NASA and NOAA satellites continue to keep track of Post-Tropical Cyclone Bonnie’s remnants. NOAA’s GOES-East satellite provided a visible look at the system showing it just off North Carolina’s coast.
The center of Post-Tropical Cyclone Bonnie is now meandering off Cape Fear, North Carolina, and the heavy rain threat expected to continue today in the eastern part of the state.
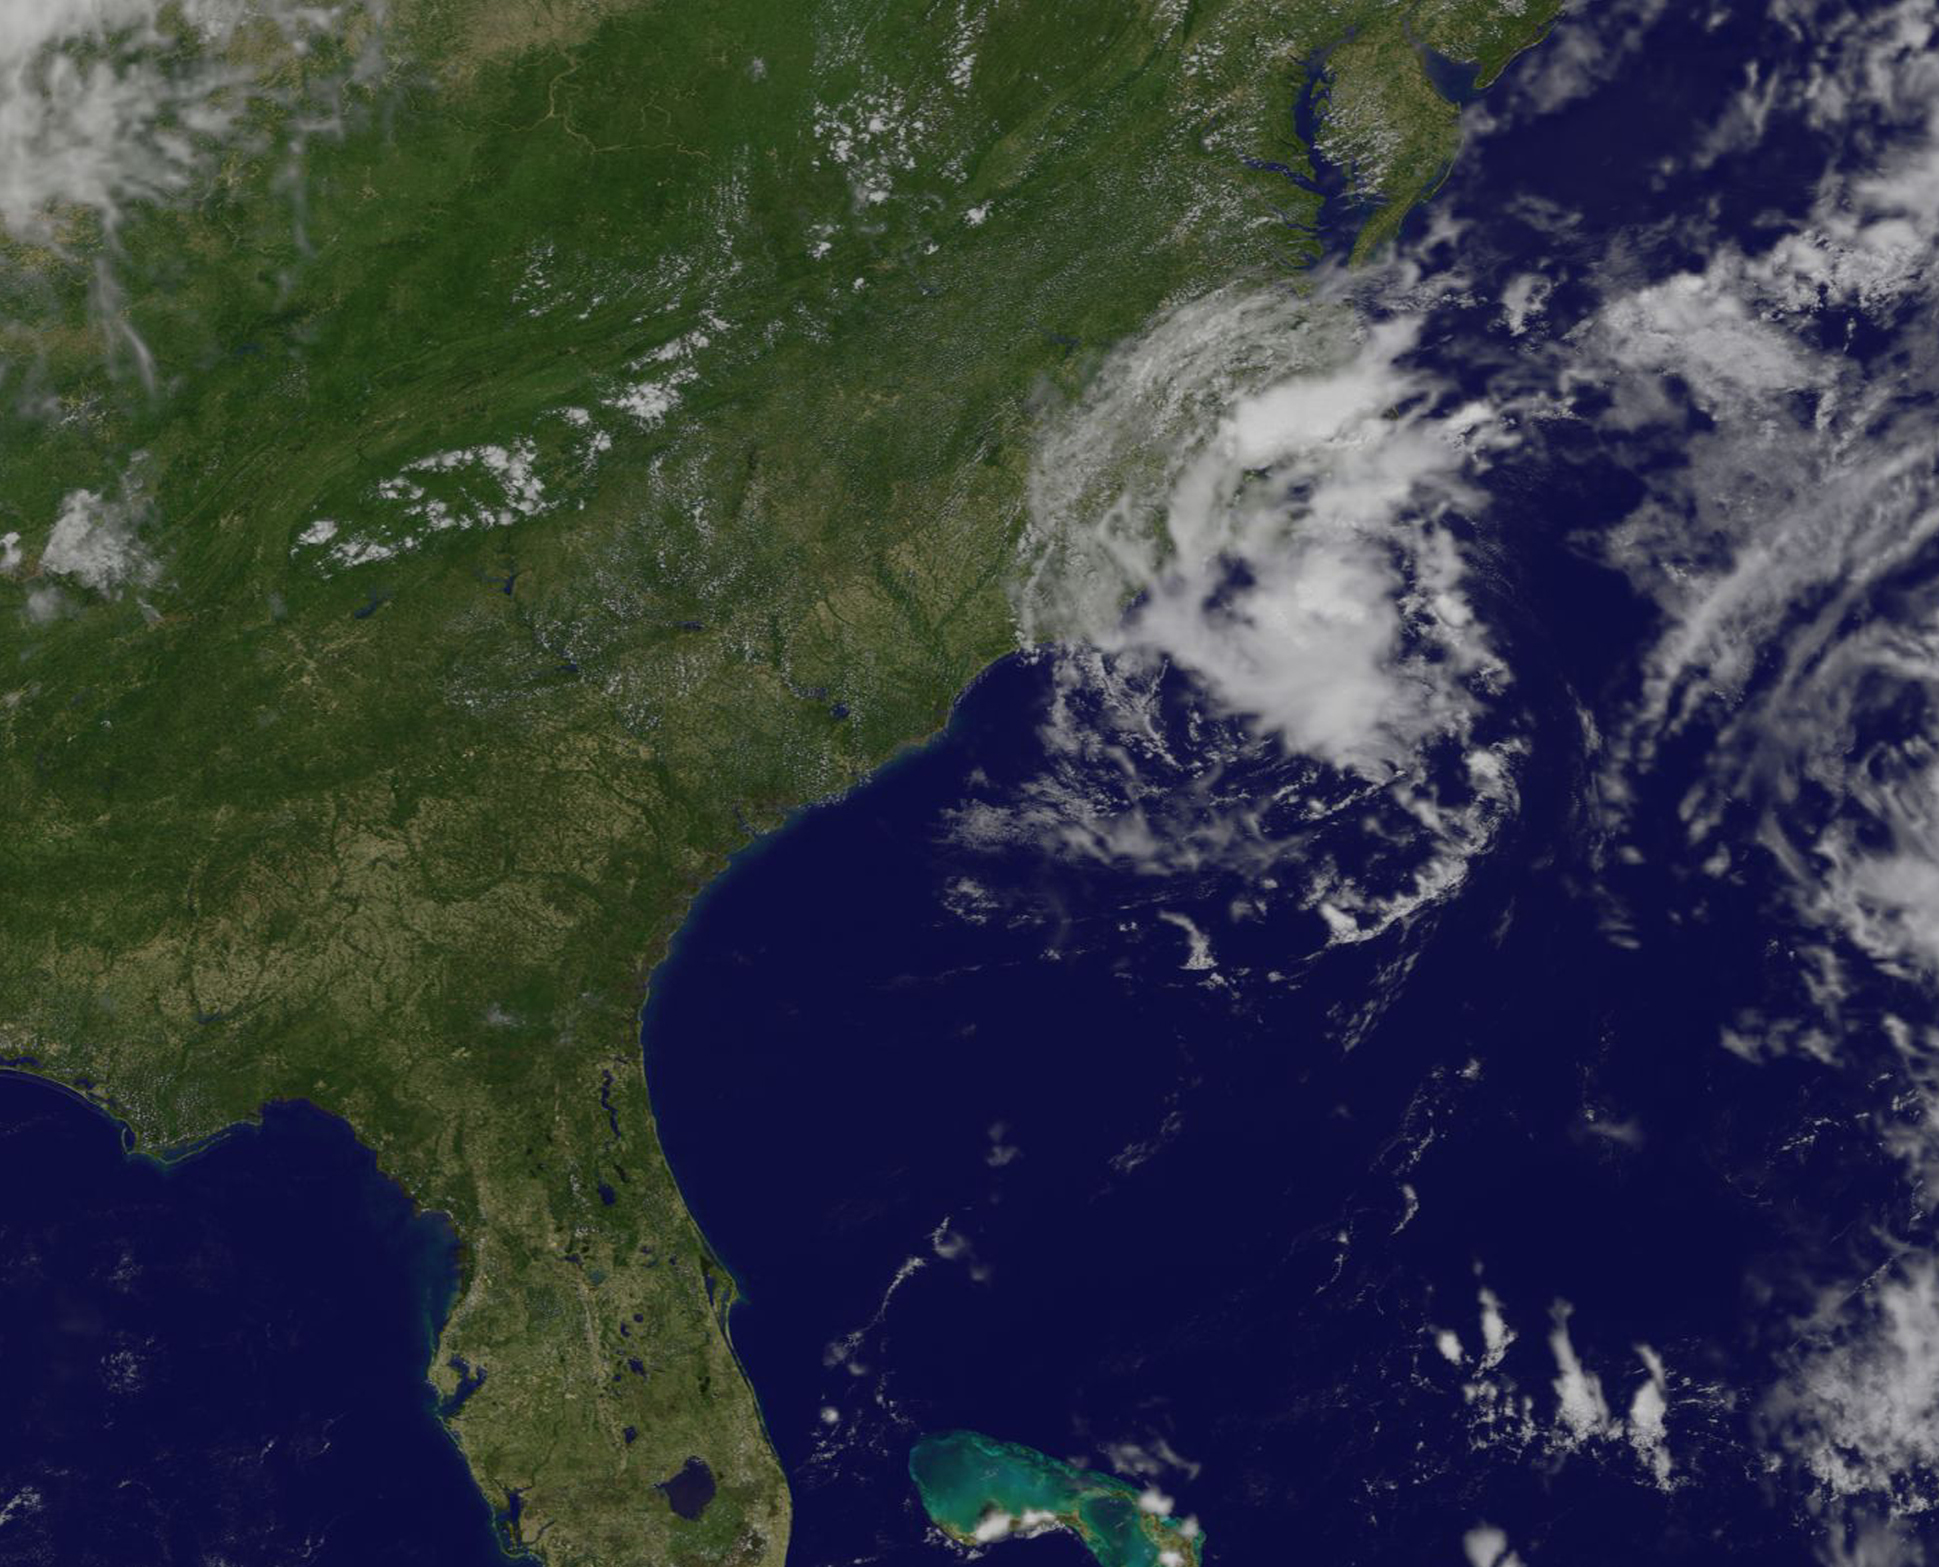
On June 1 at 12:25 p.m. EDT (1625 UTC), NOAA’s GOES-East satellite captured a visible image of Bonnie’s remnants just off-shore from Cape Fear, North Carolina. Bonnie’s clouds and rain stretched over the Carolinas today. The image was created by NASA/NOAA’s GOES Project at NASA’s Goddard Space Flight Center in Greenbelt, Maryland.
At 11 a.m. EDT (1500 UTC) the center of Bonnie was located near latitude 33.4 degrees north and longitude 76.6 degrees west. That’s about 90 miles (145 km) southeast of Wilmington/New Hanover, North Carolina. Bonnie’s center lingered off Cape Fear overnight on May 31 to June 1. The National Hurricane Center noted that Bonnie appears to be moving in a general east-northeast direction.
Bonnie’s maximum sustained winds have increased to 25 mph (40 kph) with higher gusts. The National Hurricane Center noted that the best estimate of the central pressure, based on recent buoy observations near the center, was about 1010 millibars. The remnant circulation of Bonnie is expected to resume a general east-northeastward motion today, passing near the Outer Banks of North Carolina tonight before moving off into the Atlantic on Thursday, June 2.
The main threat with Bonnie will continue to be moderate to heavy rain over the eastern part of North Carolina through tonight, June 1. For updates from the National Hurricane Center, visit: www.nhc.noaa.gov.
Rob Gutro
NASA’s Goddard Space Flight Center, Greenbelt, Md.
May 31, 2016 – NASA Sees Post-Tropical Cyclone Bonnie Lingering Along Coast
Bonnie is now a post-tropical storm, and continues to linger along the coast of South Carolina. NASA’s RapidScat analyzed the winds of the storm, while NOAA’s GOES-East provided a visible look at the storm’s location and extent.
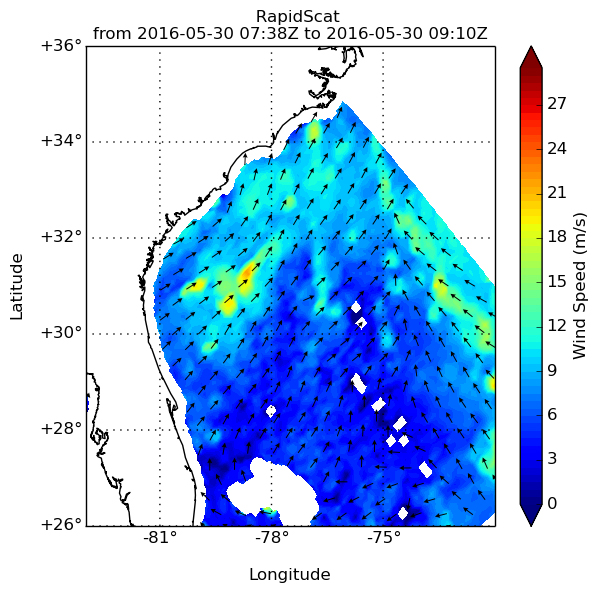
On May 30 at 4:40 a.m. EDT (0840 UTC) RapidScat saw strongest sustained winds near 18 meters per second (40 mph/64 kph) east of the center of Post-Tropical Storm Bonnie (the center was over land). Sustained winds were much weaker around the rest of the system. RapidScat flies aboard the International Space Station and can measure winds on the ocean’s surface. Forecasters are able to use RapidScat data to pinpoint the strongest winds within a storm, as they are not always equally distributed.
At 5 a.m. EDT on Tuesday, May 31, 2016 Bonnie’s center of circulation was located near latitude 33.3 north…and longitude 78.9 west. That’s about 29 miles (47 km) south of Myrtle Beach and about 65 miles (105 km) north-northeast of Charlestown municipal airport, South Carolina. Bonnie continued to produce light showers along the U.S. East Coast.
Winds are not the problem with Bonnie. NHC reported maximum sustained winds were near 15 mph (25 k). Minimum central pressure was 1009 millibars.
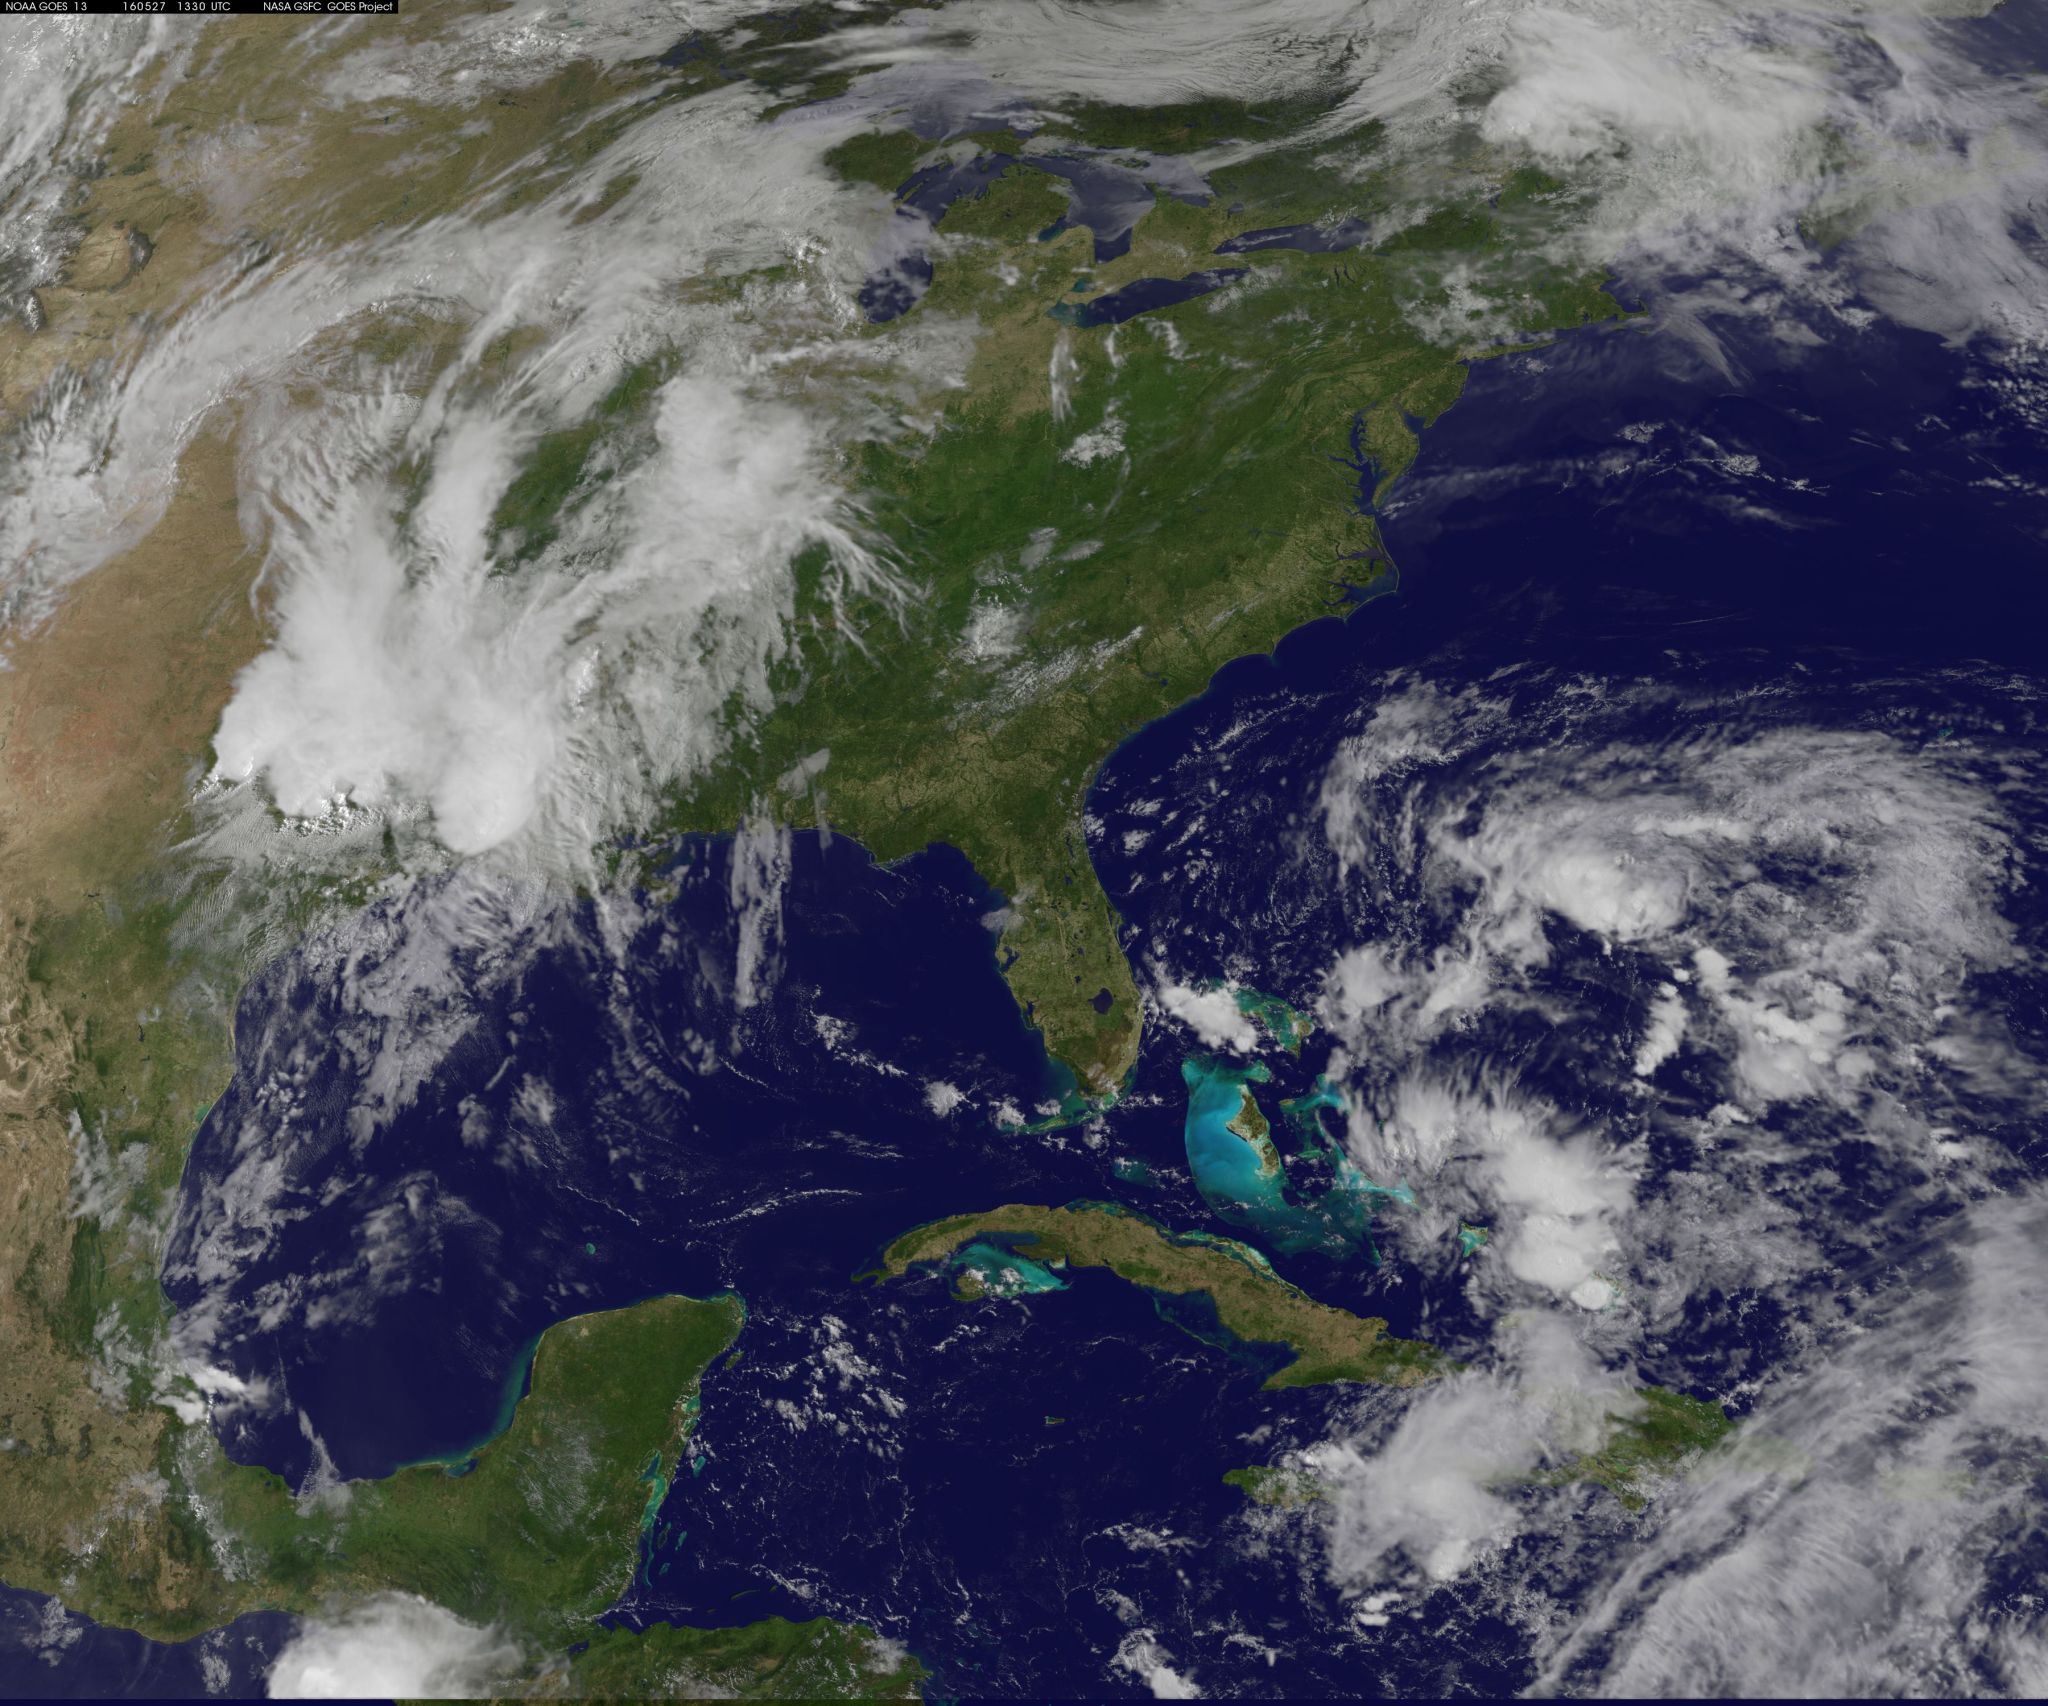
On May 31 at 1330 UTC (9:30 a.m. EDT), NOAA’s GOES-East satellite captured a visible image of Bonnie that showed the center just off-shore from the Carolinas. Bonnie’s clouds and rain stretched from the Carolinas, north to New England. The image was created by NASA/NOAA’s GOES Project at the NASA Goddard Space Flight Center in Greenbelt, Maryland.
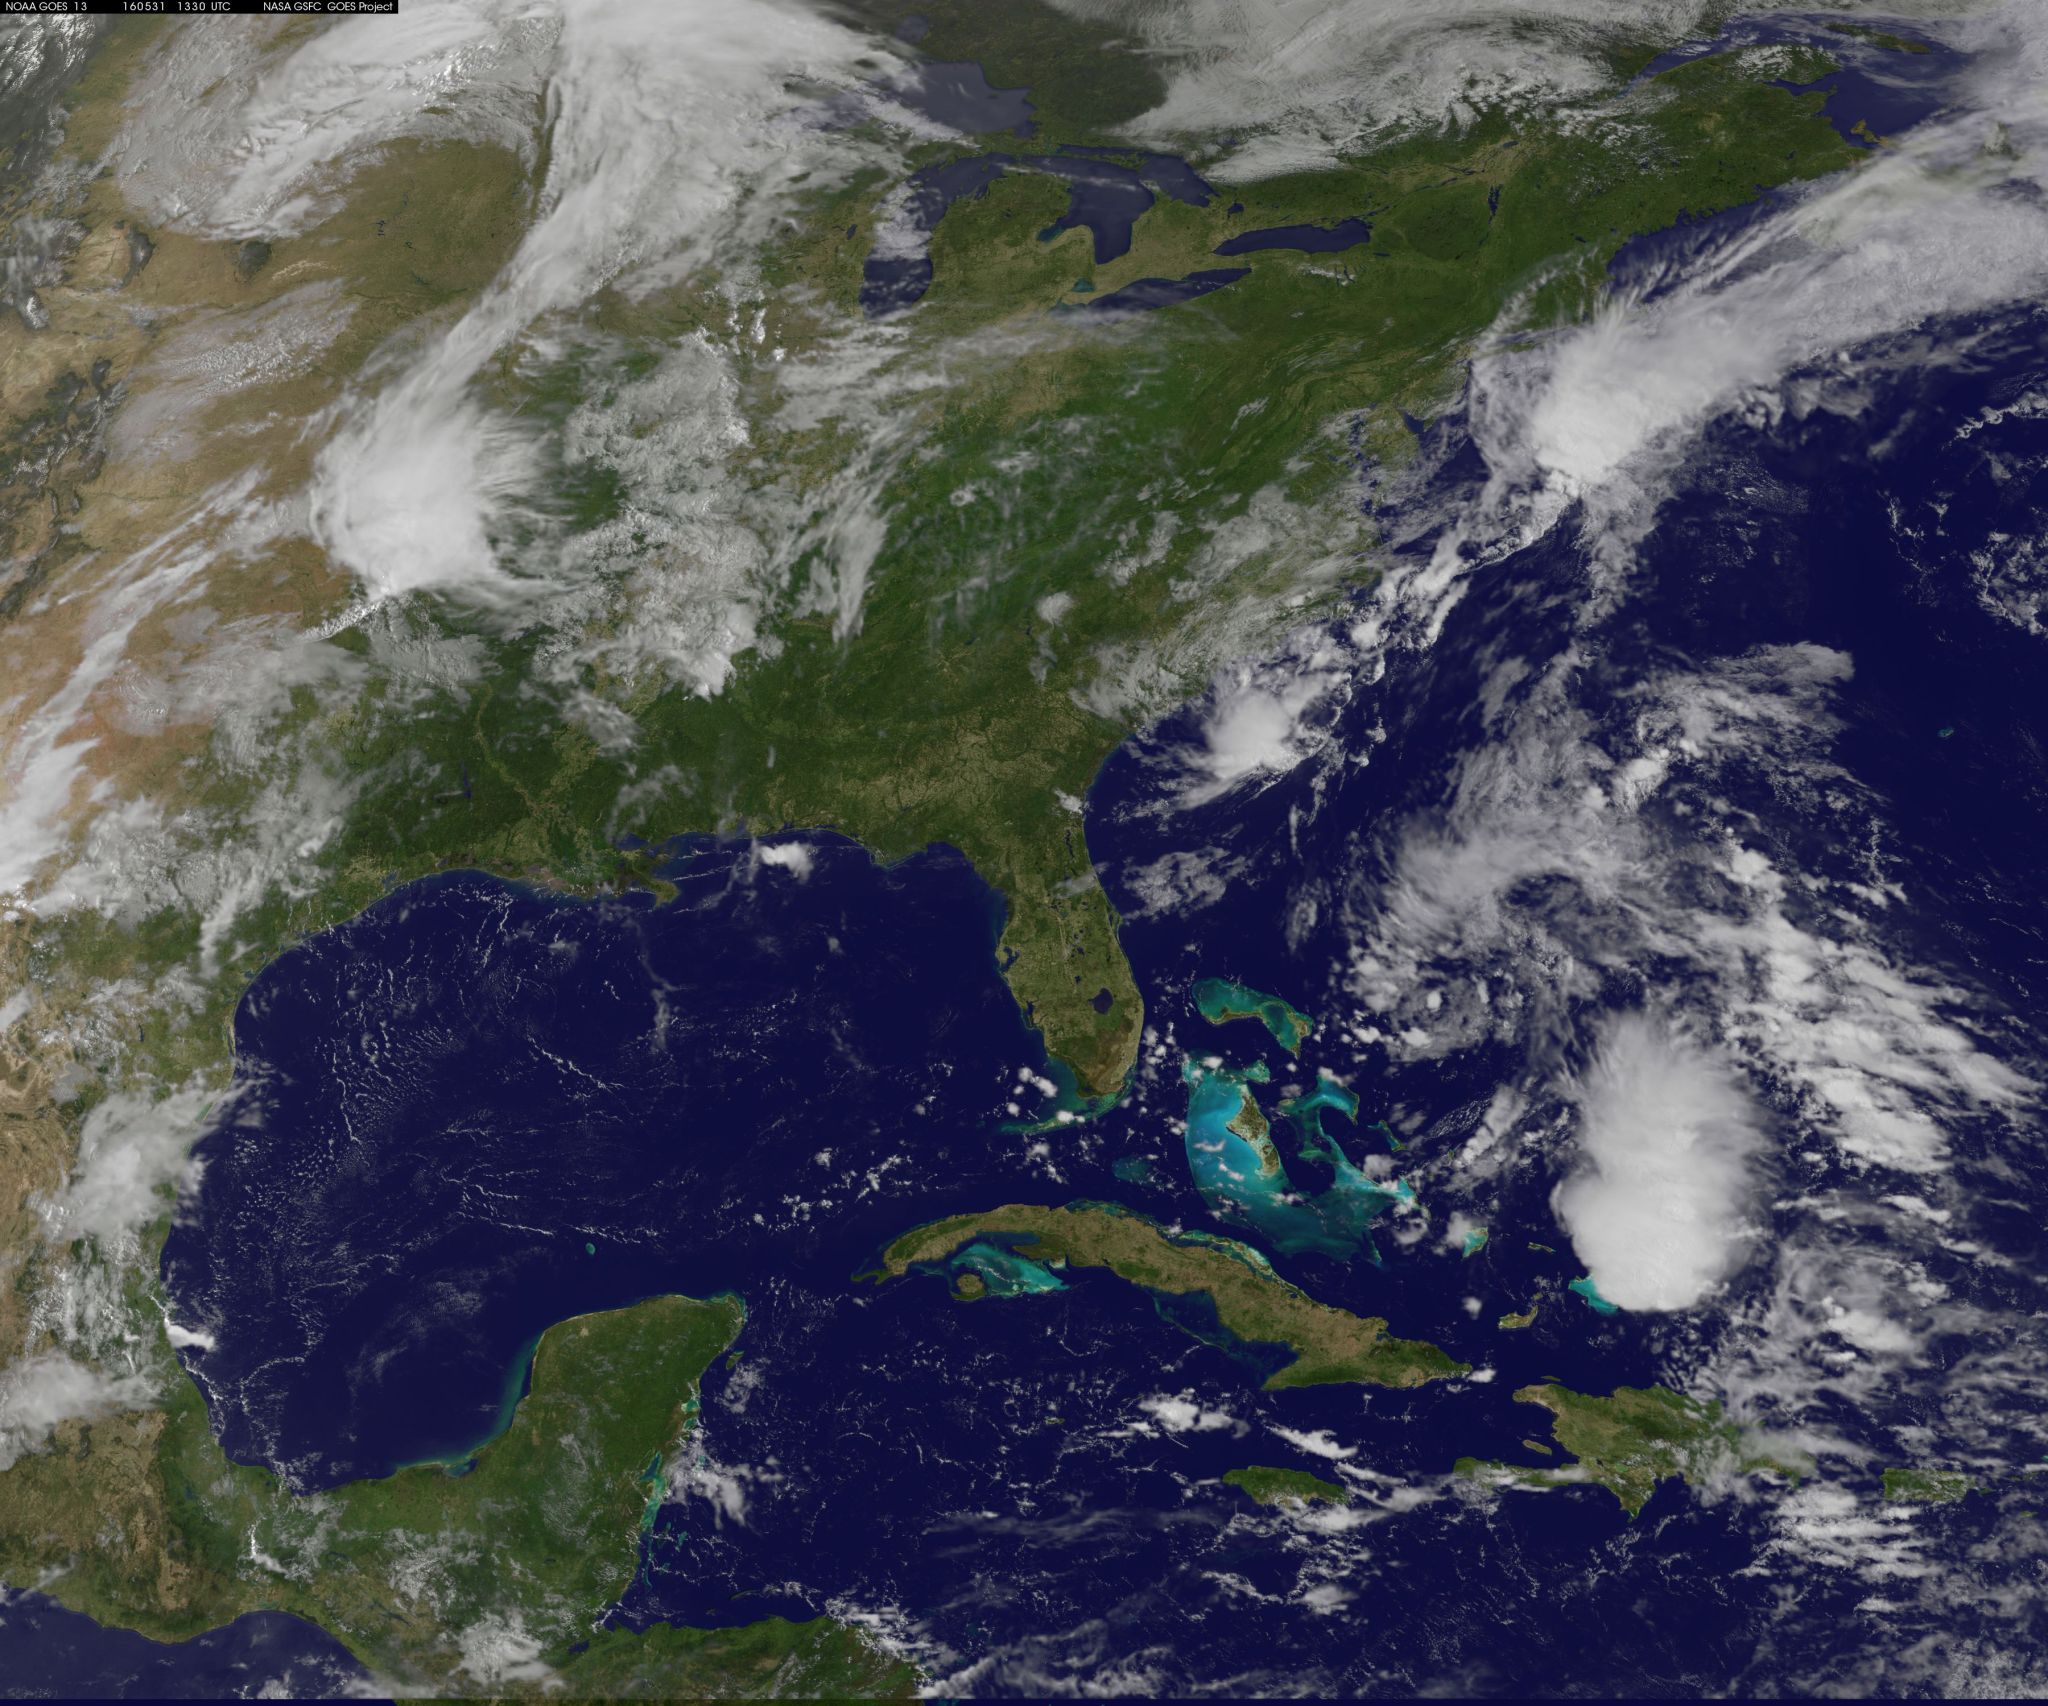
The National Hurricane Center noted that over the next day and a half Bonnie is expected to drift to the northeast and then track offshore of the Mid-Atlantic later in the week. The main threat with this storm is moderate to heavy rain…which will continue to impact mainly the eastern Carolinas over the next couple of days.
Below are rainfall totals accumulated by the National Weather Service’s Weather Prediction Center in College Park, Maryland.
Rob Gutro
NASA’s Goddard Space Flight Center, Greenbelt, Md.
Selected Storm Total Rainfall in Inches through 2 a.m. EDT
Delaware
- Wilmington 2 NW 2.23
- New Castle 1.94
- Dover Air Force Base 1.50
Georgia
- Burtons Ferry Landing 8.85
- Oliver 2 SW 7.74
- Augusta/Bush Field 2.69
- Savannah Muni Arpt 1.57
Massachusetts
- Plymouth Muni Arpt 2.31
- New Bedford Arpt 1.59
- Boston/Logan 1.13
Maryland
- Galena 3.51
- Ocean City Muni Arpt 2.77
- Salisbury Rgnl Arpt 1.38
North Carolina
- Hatteras/Billy Mitchell Apt 7.72
- Erwin/Harnett County Arpt 2.50
- Raleigh/Durham Intl Arpt 2.45
New Jersey
- Hamilton Twp 4.52
- Trenton 5 ESE 3.16
- Atlantic City Intl Airport 1.81
New York
- New York City 1.65
- New York/La Guardia 1.53
Pennsylvania
- Jonas 3.49
- Philadelphia/Ne Phil. Arpt 2.35
- Pittsburgh/Allegheny Co. Arpt 2.32
Rhode Island
- Providence/Po Warwick 1.50
- Westerly State Arpt 1.34
South Carolina
- Old House 1 SSE 10.36
- Lena 4 ENE 9.03
- Charleston Airport 4.84
Virginia
- Wakefield Muni Arpt 2.56
- Richmond 2.35
- Wallops Island 2.02
May 30, 2016 – NASA’s GPM Examines Tropical Depression Bonnie in the Carolinas
NASA measured rainfall at an inch per hour as Tropical Depression Bonnie continued to linger along the South Carolina coast. On May 30, Bonnie continued moving along the coastline near Charleston, South Carolina and additional heavy rainfall expected over the Carolinas. There are no coastal watches or warnings in effect.
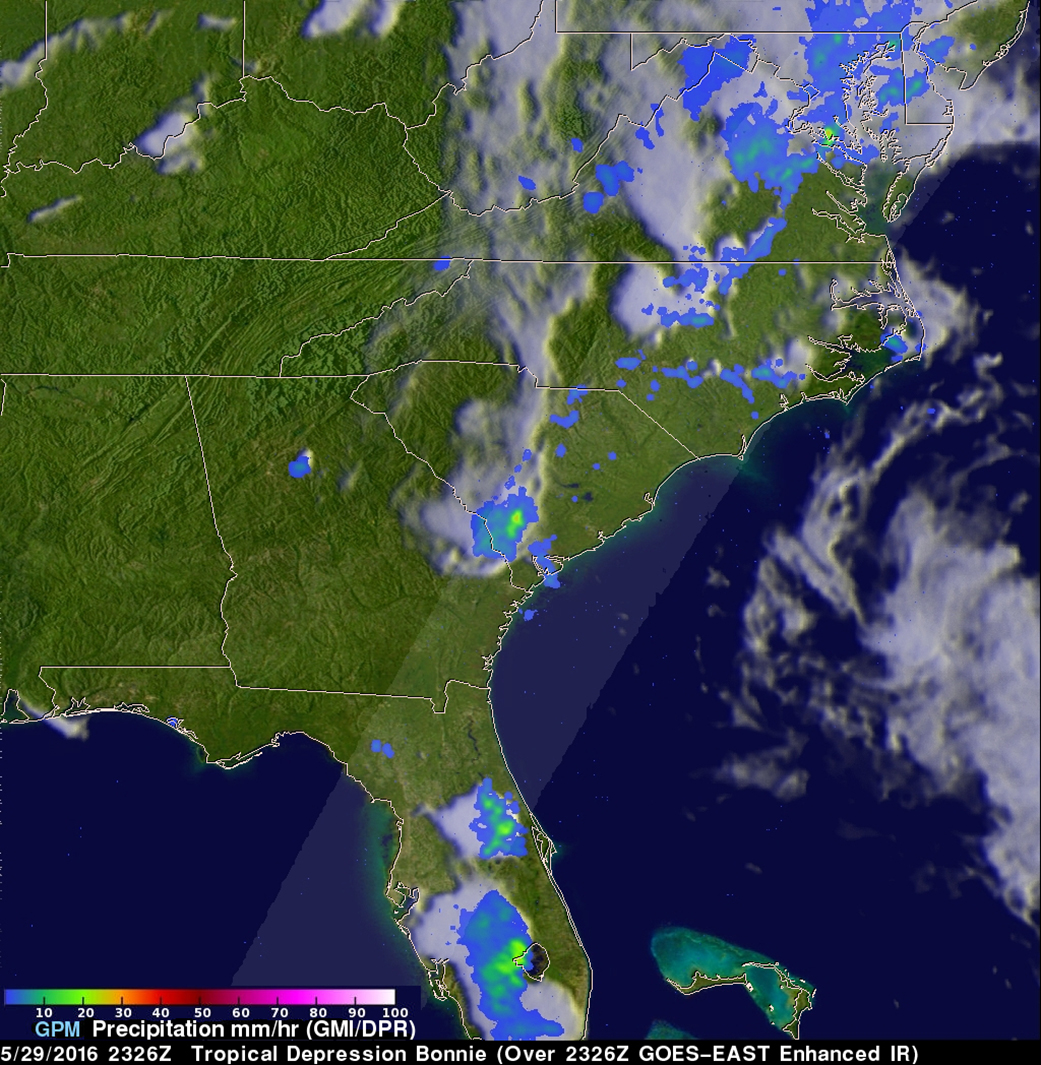
The Global Precipitation Measurement mission or GPM satellite that co-managed between NASA and the Japan Aerospace Exploration Agency had an excellent view of Tropical Depression Bonnie as it flew over the southeastern United States on May 29, 2016 at 2326 UTC (7:26 p.m. EDT). Rainfall was analyzed using data collected by GPM’s Microwave Imager (GMI) and and Dual-Frequency Precipitation Radar (DPR) instruments. GPM’s radar (DPR) showed rain falling at a rate of over 25.4 mm (1 inch) per hour in South Carolina.
GPM’s Radar (DPR Ku Band) was able to see through cloud cover in the tropical depression and show the vertical shape of rain within storms. GPM’s DPR calculated the heights of storm tops, showing where the highest, strongest thunderstorms were within Bonnie.
Location on May 30, 2016 at 8 a.m. EDT
At 5 a.m. EDT (0900 UTC), the center of Tropical Depression Bonnie was located by NOAA Doppler radar and surface observations near latitude 33.0 North, longitude 79.5 West. The depression is moving toward the northeast near 3 mph (6 kph). The National Hurricane Center forecast calls for a slow northeastward or east-northeastward motion for the next couple of days. On the forecast track, the center of Bonnie is expected to move near or along the South Carolina coast today and the North Carolina coast on Tuesday and Wednesday.
Maximum sustained winds are near 30 mph (45 kph) with higher gusts. Little change in strength is forecast during the next 48 hours. The estimated minimum central pressure based on nearby surface observations is 1011 millibars.
What to Expect
The National Hurricane Center (NHC) expect Bonnie to produce additional rainfall accumulations of 1 to 2 inches across east-central Georgia, central and eastern South Carolina, and eastern North Carolina with isolated maximum amounts near 4 inches. Farther north, the moisture from Bonnie will produce additional rainfall amounts of up to 2 inches across eastern portions of the mid-Atlantic region into southern New England through Wednesday. Bonnie is expected to produce dangerous surf and rip current conditions along portions of the southeastern United States coast through Monday.
Total rainfall of more than 8 inches has already occurred over large portions of south-central South Carolina.
The National Hurricane Center predicts that Bonnie will move very slowly along the Atlantic coast over the next few days.
Hal Pierce/Rob Gutro
NASA’s Goddard Space Flight Center
May 29, 2016 – NASA Analyzes Wind, Rain, Clouds in South Carolina’s Tropical Storm Bonnie
NASA satellites and instruments are providing a lot of data on Tropical Storm Bonnie to the forecasters at the National Hurricane Center. RapidScat showed where the strongest winds are located, GPM satellite data measured rainfall, and NASA’s Terra satellite provided a visible look at the extent of the storm. Bonnie made landfall in South Carolina and weakened to a tropical depression on Sunday, May 29, 2016.
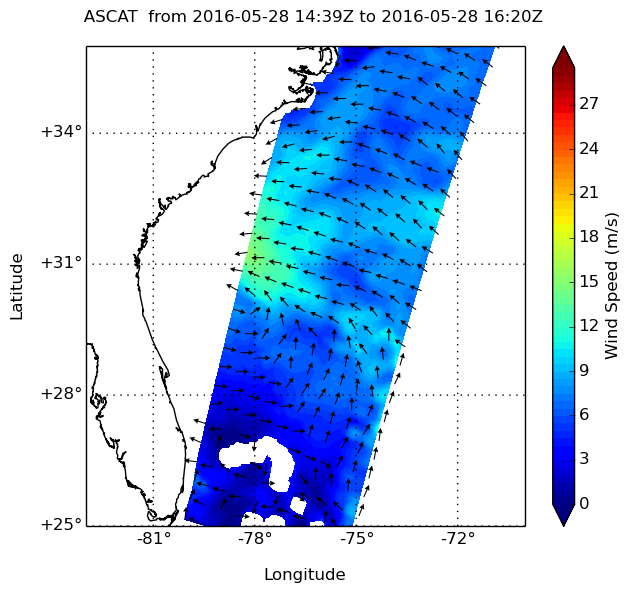
NASA’s RapidScat instrument and the European Space Agency’s ASCAT scatterometer spied the strongest winds on the northern side of the Tropical Storm Bonnie on May 28. RapidScat saw strongest sustained surface winds north of the center of circulation near 21 meters per second (46.9 mph/75.6 kph). RapidScat flies aboard the International Space Station. Both RapidScat and ASCAT measures surface wind speeds and direction over open waters of oceans.
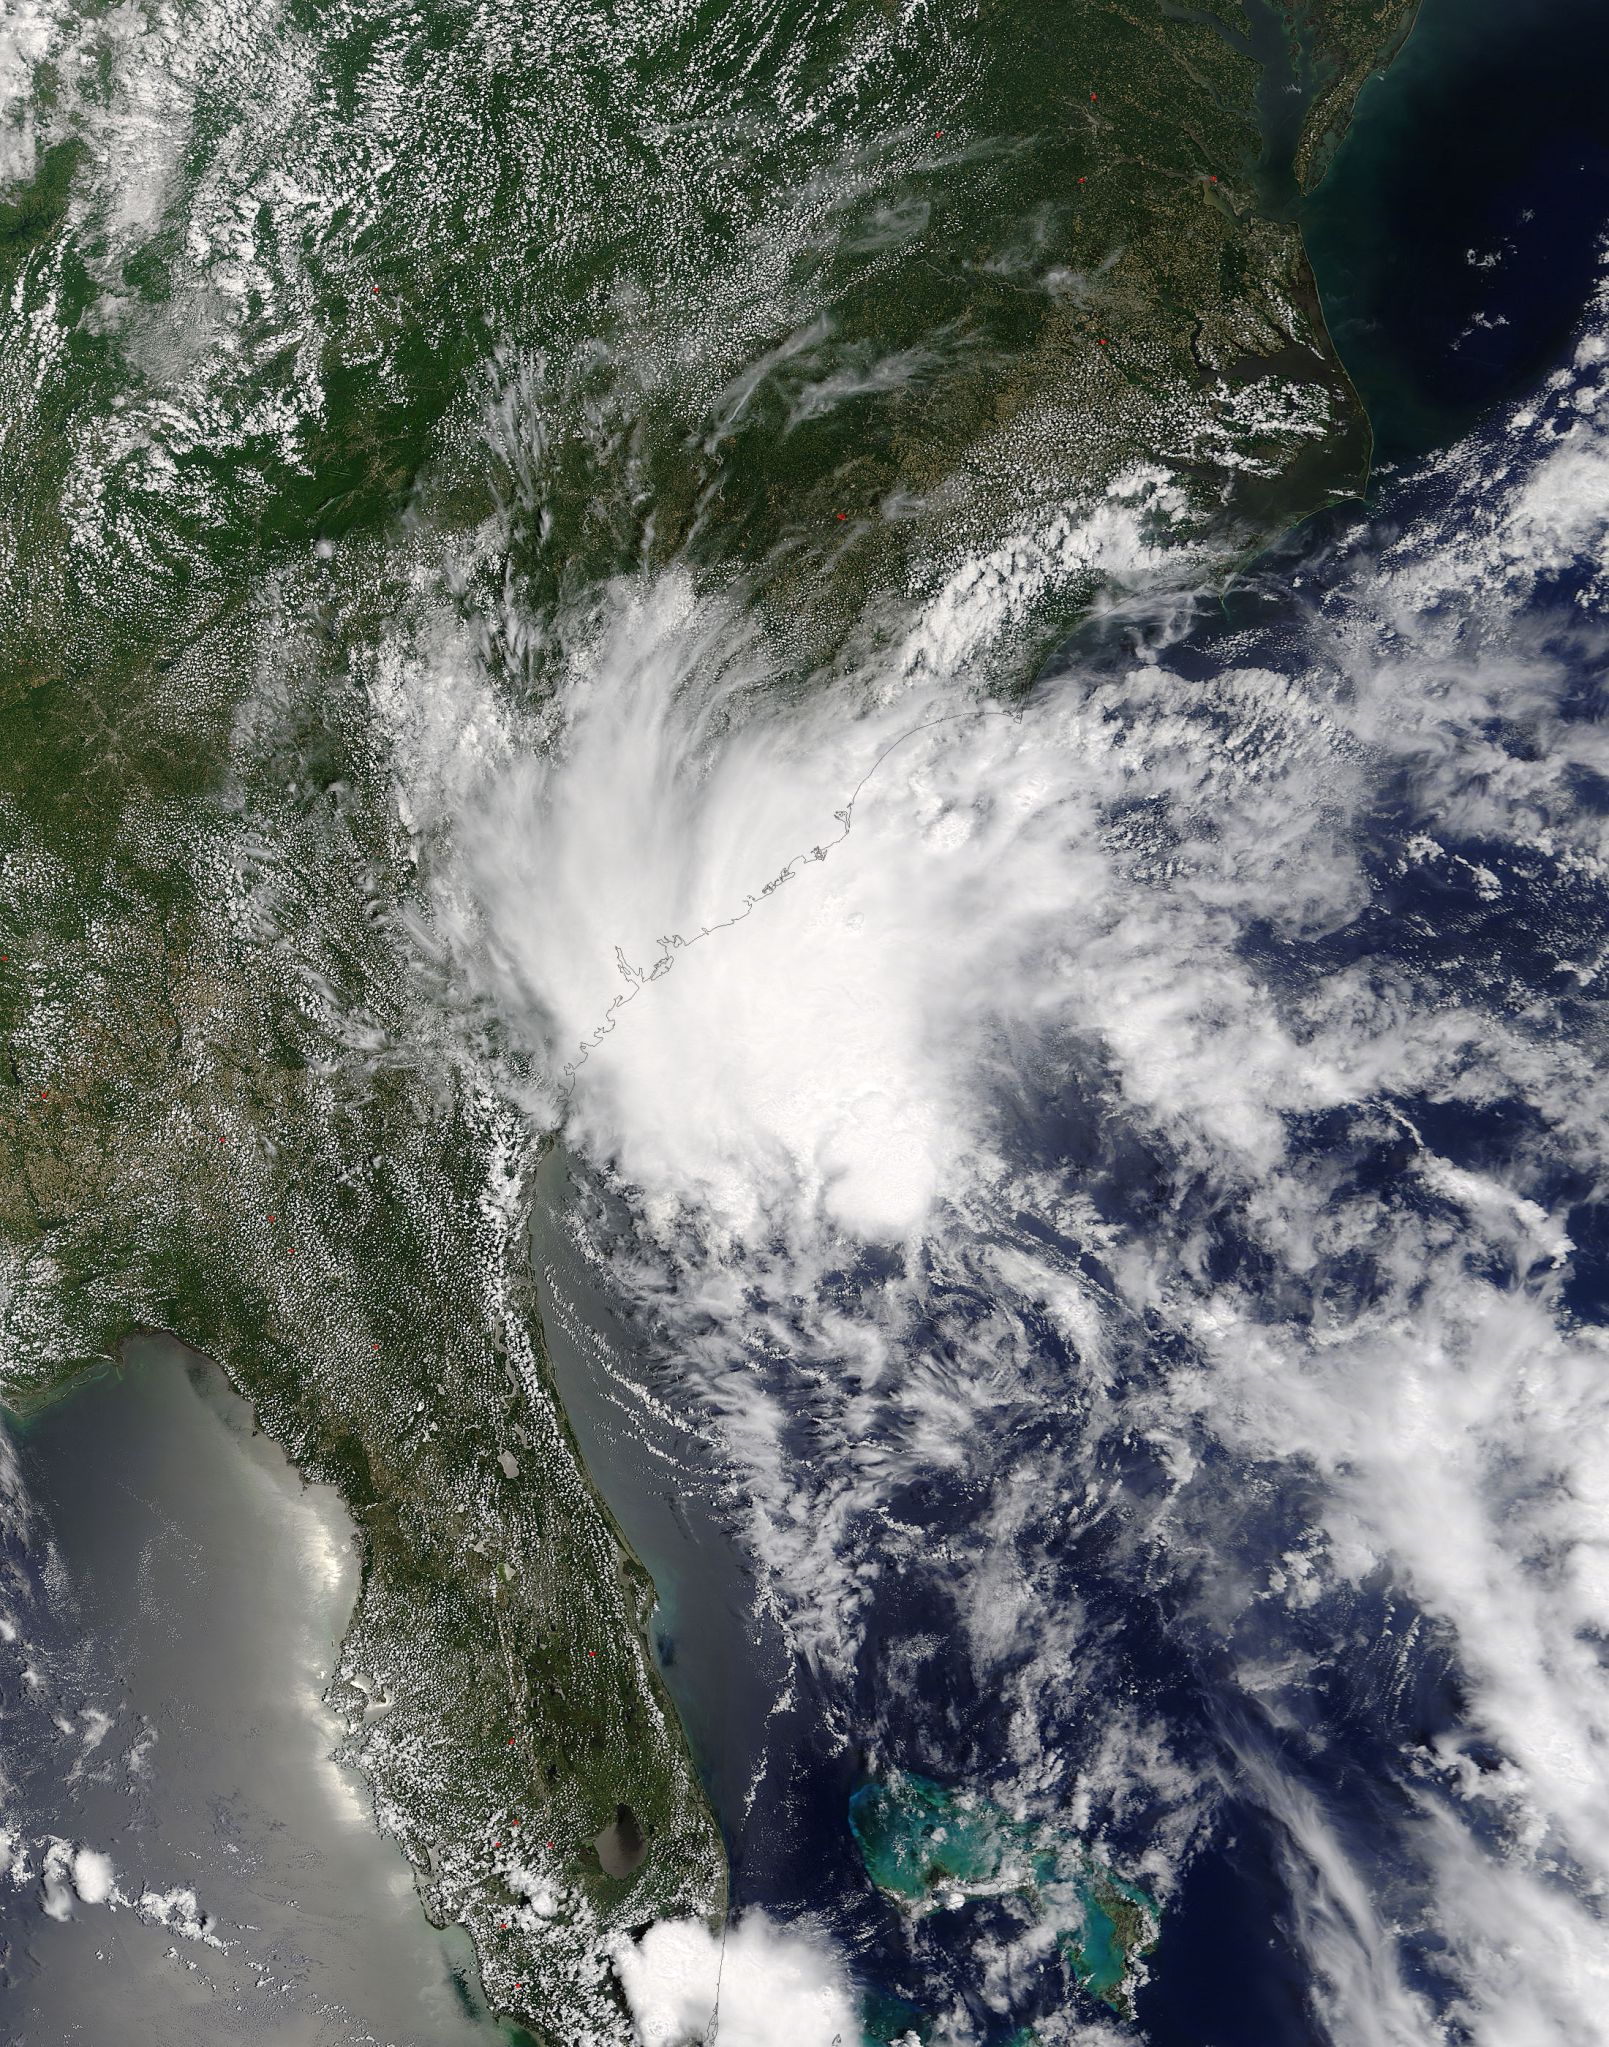
The MODIS instrument aboard NASA’s Terra satellite captured an image of the extent of Tropical Storm Bonnie’s clouds and storms as it was making landfall in South Carolina at 16:25 UTC (12:25 p.m. EDT) on May 28.
NASA also provided a look at the liquid precipitation in Bonnie using merged satellite rainfall data from the TRMM Multi-satellite Precipitation Analysis (TMPA) using satellites like the Global Precipitation Measurement Mission. The analysis showed that rainfall totals over parts of South Carolina were already reaching over 127 mm (5 inches).
By 8 a.m. EDT on Sunday, May 29, 2016, Bonnie weakened to a tropical depression near the coast and heavy rains were affecting much of eastern Georgia and portions of the Carolinas, according to the National Hurricane Center (NHC). All Tropical Storm Warnings have been discontinued. There are no coastal watches or warnings in effect.
NHC’s 8 a.m. EDT (1200 UTC) update said “the center of Tropical Depression Bonnie was located near latitude 32.7 North, longitude 79.6 West. The estimated minimum central pressure is 1009 millibars.
Bonnie is moving toward the north near 9 mph (15 kph), and this general motion is expected to continue today. On the forecast track, the center of Bonnie is expected to move onshore near the south-central coast of South Carolina this morning. A slow northeastward motion near the coast of northeastern South Carolina is expected by tonight and on Monday, May 30.
Data from an Air Force reconnaissance aircraft indicate that the maximum sustained winds have decreased to near 35 mph (55 kph) with higher gusts. Little change in strength is forecast during the next 24 hours, followed by slow weakening on Monday.
The biggest threat from Bonnie is the rainfall. NHC noted that Bonnie is expected to produce total rainfall accumulations between 2 to 4 inches with isolated maximum amounts of 6 inches from central and eastern South Carolina to the Georgia border, and 1 to 3 inches farther north across southeastern North Carolina. Heavy rain is expected to develop well north of Bonnie’s main circulation into parts of the Mid-Atlantic region and the Northeast with total accumulations of 1 to 2 inches through Monday and isolated maximum amounts of 4 inches.
For updated forecasts, visit NHC: www.nhc.noaa.gov
Rob Gutro
NASA’s Goddard Space Flight Center
May 28, 2016 – NASA Analyzes Rainfall in Strengthening Tropical Depression 2
On Saturday May 28, 2016 Tropical Depression 2 continued to get better organized and is predicted by the National Hurricane Center (NHC) to become tropical storm Bonnie later in the day. The Global Precipitation Measurement or GPM core satellite, managed by NASA and the Japanese Space Agency found heaviest rainfall rates north of the center.
At 8 a.m. EDT on May 28, A Tropical Storm Warning was in effect from the Savannah River to Little River Inlet South Carolina. A Tropical Storm Warning means that tropical storm conditions are expected somewhere within the warning area, in this case within 24 hours.
Credits: NASA/JAXA/SSAI, Hal Pierce
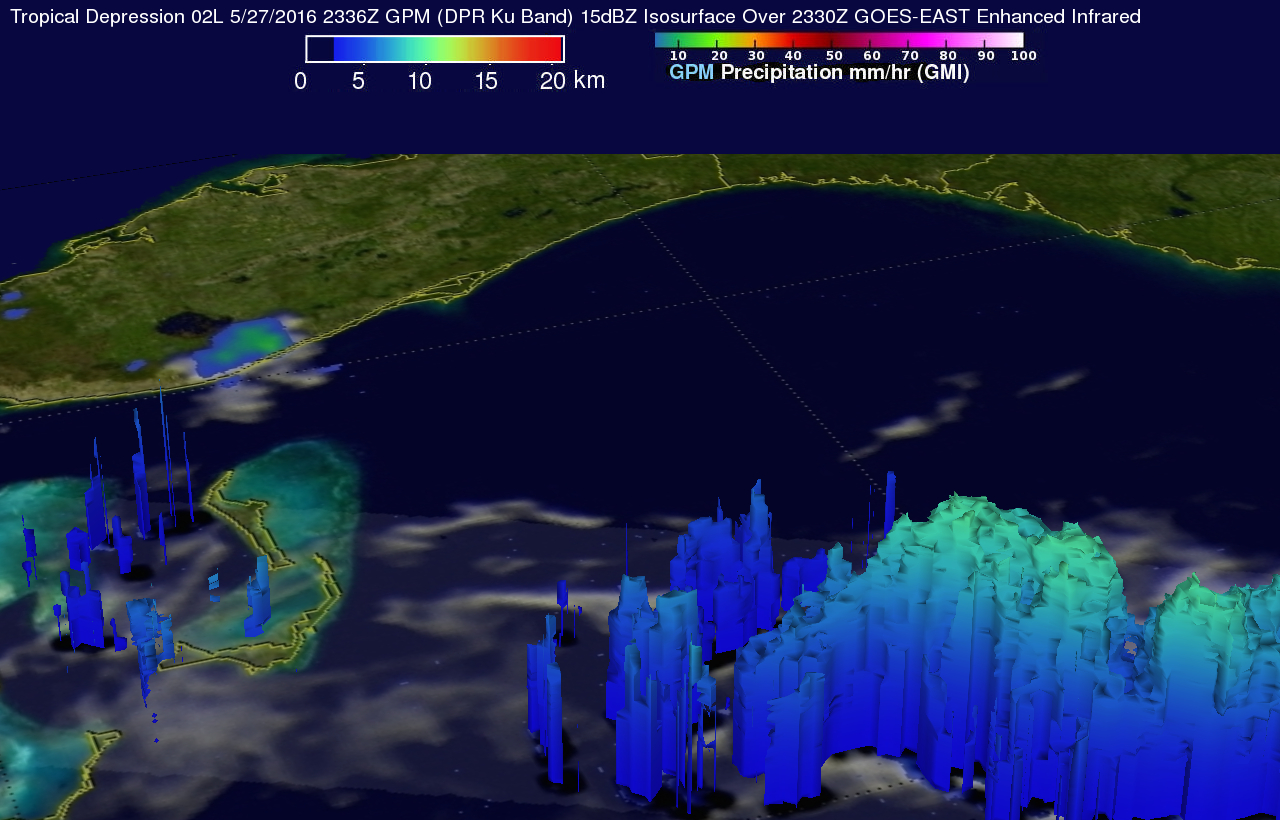
Looking at Rainfall and Cloud Heights
The GPM core observatory satellite saw Tropical Depression 2 on May 27, 2016 at 2336 UTC (7:37 p.m. EDT). GPM’s Microwave Imager (GMI) and Dual-Frequency Precipitation Radar (DPR) instruments measured precipitation around the tropical depression. Rain was measured by GPM’s radar (DPR) falling at a rate of over 57 mm (1.3 inches) per hour in an area north of TD2’s center. Data from GPM’s DPR were used to indicate the 3-D vertical structure of rainfall within powerful thunderstorms associated with the tropical depression. Some storm top heights in an area of heaviest rainfall northeast of the tropical depression’s center were found by DPR to reach heights of well above 13 km (8 miles).
Location and Strength of TD2 at 8 a.m. EDT on May 28
At 8 a.m. EDT (1200 UTC), on Saturday morning, May 28, the center of Tropical Depression Two was estimated by an Air Force Reserve reconnaissance aircraft to be near latitude 30.0 North, longitude 78.0 West. The depression is moving toward the northwest near 14 mph (22 kph). A decrease in forward speed is expected later today and on Sunday as the system nears the coast within the warning area.
The National Hurricane Center reported that the maximum sustained winds are near 35 mph (55 kph) with higher gusts. Reports from the reconnaissance aircraft indicate that the tropical cyclone is just below tropical storm strength. The estimated minimum central pressure is 1009 millibars.
What the Warning Area Can Expect
The National Hurricane Center noted that the coast can expect tropical storm conditions to reach the warning area later tonight or early Sunday. The depression is expected to produce total rainfall accumulations of 1 to 3 inches from eastern South Carolina through southeastern North Carolina.
In addition, storm surge inundation of 1 to 2 feet above ground level is possible within the tropical storm warning area. Tropical Depression 2 is also expected to produce life-threatening surf and rip current conditions along portions of the southeastern United States coast through the weekend.
As Tropical Depression 2 travels over the warm waters of the Gulf Stream winds are predicted to increase to about 40 knots (46 mph), which will make it a tropical storm. Once it reaches that strength, it will be renamed “Bonnie.” The NHC expects the storm to become Tropical Storm Bonnie before making landfall in South Carolina. Bonnie is then expected to weaken while heading toward the northeast while hugging the coastline.
For updated forecasts, visit the National Hurricane Center page at: www.nhc.noaa.gov
Hal Pierce/Rob Gutro
NASA’s Goddard Space Flight Center
May 27, 2016 – NASA Looks at Winds in Developing Tropical Cyclone
The low pressure area located between Bermuda and the Bahamas, designated as System 91L became a little better defined today. NASA’s RapidScat analyzed the system’s winds, and NOAA’s GOES-East satellite provided a visible look at the developing system.
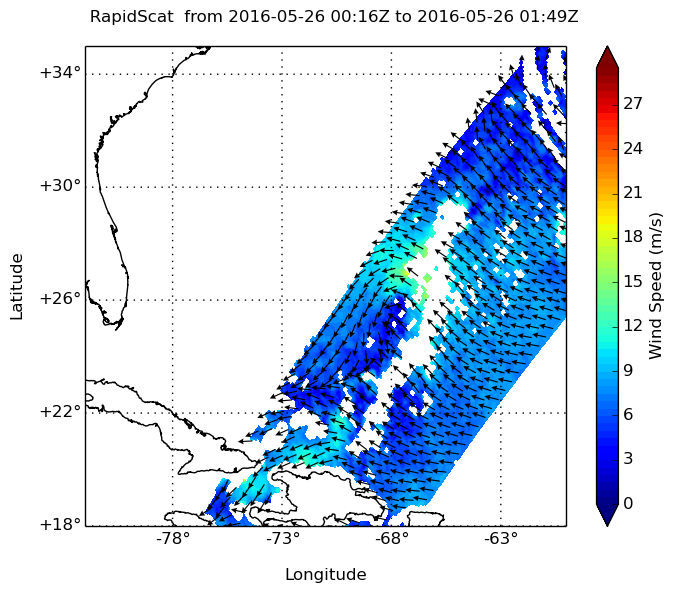
RapidScat is a scatterometer instrument that flies aboard the International Space Station. It measures surface wind speeds and direction over open waters of oceans. On May 26 at 0100 UTC (May 25 at 9 p.m. EDT) RapidScat saw strongest sustained surface winds northeast of the center in System 91L, the developing tropical cyclone, at a rate near 21 meters per second (46.9 mph/75.6 kph). Images from RapidScat data are made into images at NASA’s Jet Propulsion Laboratory in Pasadena, California where the mission is managed.
At 7:45 a.m. EDT on Friday, May 27, 2016, the National Hurricane Center (NHC) noted that the shower activity was showing signs of organization, and the circulation had become a little better defined overnight. NHC noted “Environmental conditions are generally conducive for a tropical or subtropical cyclone to form later today or Saturday while this system moves west-northwestward to northwestward toward the southeastern United States coast.
NOAA’s GOES-East satellite captured a daytime (visible) view of developing System 91L between the Bahamas and Bermuda on Friday, May 27 at 1430 UTC (10:30 a.m. EDT). The image showed the circulation of the low with thunderstorms wrapping around from the northern to the southeastern quadrant. NOAA manages the GOES-East satellite and the NASA/NOAA GOES Project at NASA’s Goddard Space Flight Center in Greenbelt, Maryland uses the satellite data to create images and animations.
Over the Memorial Day weekend, the NHC cautioned that all interests along the southeast coast from Georgia through North Carolina should monitor the progress of this low pressure area.
NHC noted that System 91L has a high chance, 90 percent, of becoming a tropical depression. When it does it would be designated Tropical Depression 2, since the first depression of the season actually formed in January and grew into Hurricane Alex. If System 91L strengthens enough to become a tropical storm, it would be named Bonnie.
For updated forecasts, visit: www.nhc.noaa.gov.
Rob Gutro
NASA’s Goddard Space Flight Center
May 26, 2016 – NASA’s GPM Satellite Sees Potential Atlantic Tropical Cyclone
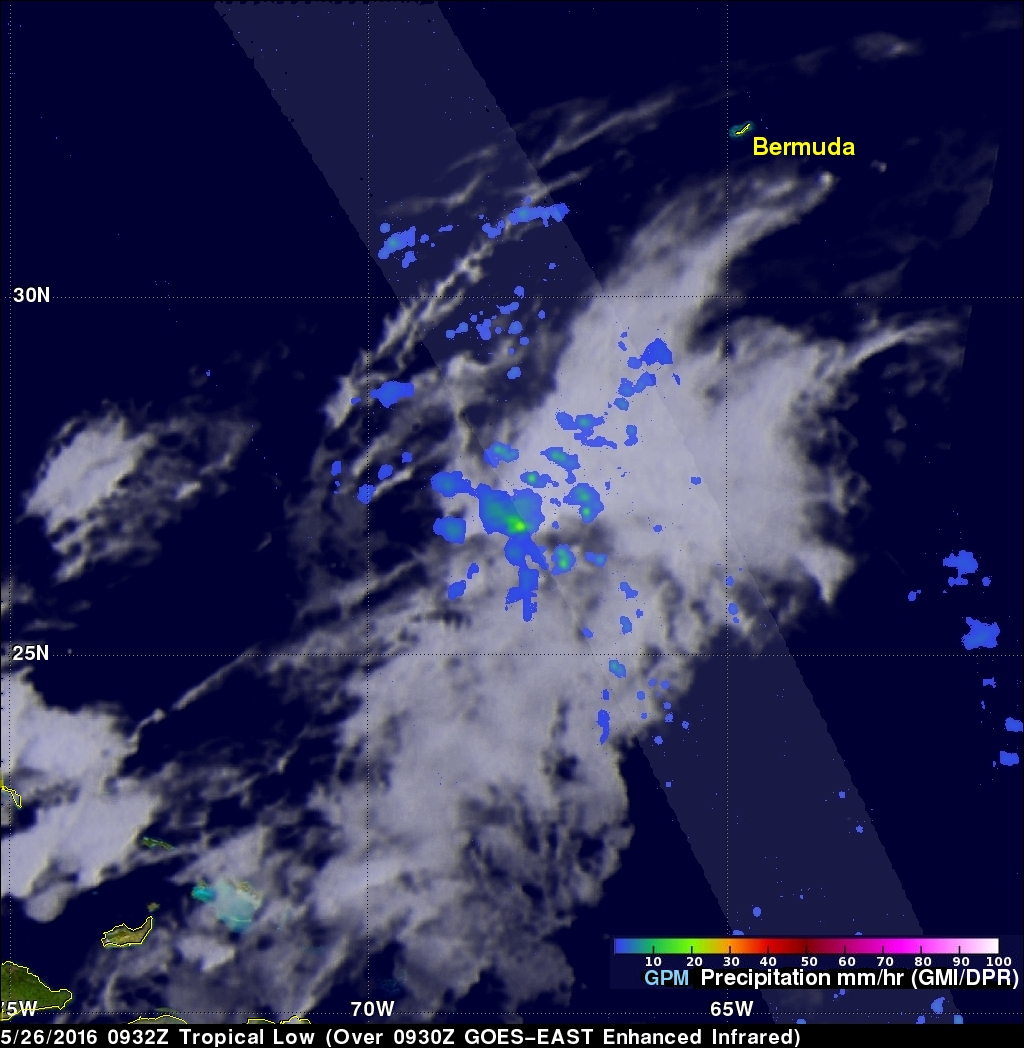
An area of low pressure designated as System 91L, located in the Atlantic Ocean between Bermuda and the Bahamas is being monitored today for possible development into a tropical or subtropical cyclone. The Global Precipitation Measurement (GPM) mission core observatory satellite flew over the developing low pressure area on May 26, 2016 at 0932 UTC (5:30 a.m. EDT).
Shower activity has increased in the area. NOAA’s National Hurricane Center (NHC) has advised interests along the southeastern coast of United States to monitor the progress of this low.
If System 91L develops into a tropical cyclone it would be the second in the North Atlantic this year. The first was Hurricane Alex that developed in January in the far eastern Atlantic.
GPM’s Microwave Imager (GMI) and Dual-Frequency Precipitation Radar (DPR) instruments measured precipitation around the low. Rain was measured by GPM’s radar (DPR) falling at a rate of almost 32 mm (1.3 inches) per hour in an area near the center of the low’s circulation. Increasing shower activity near the center of a tropical low can signal tropical cyclone development. Tropical cyclones derive energy from the heat generated by condensation that occurs within showers and thundershowers.
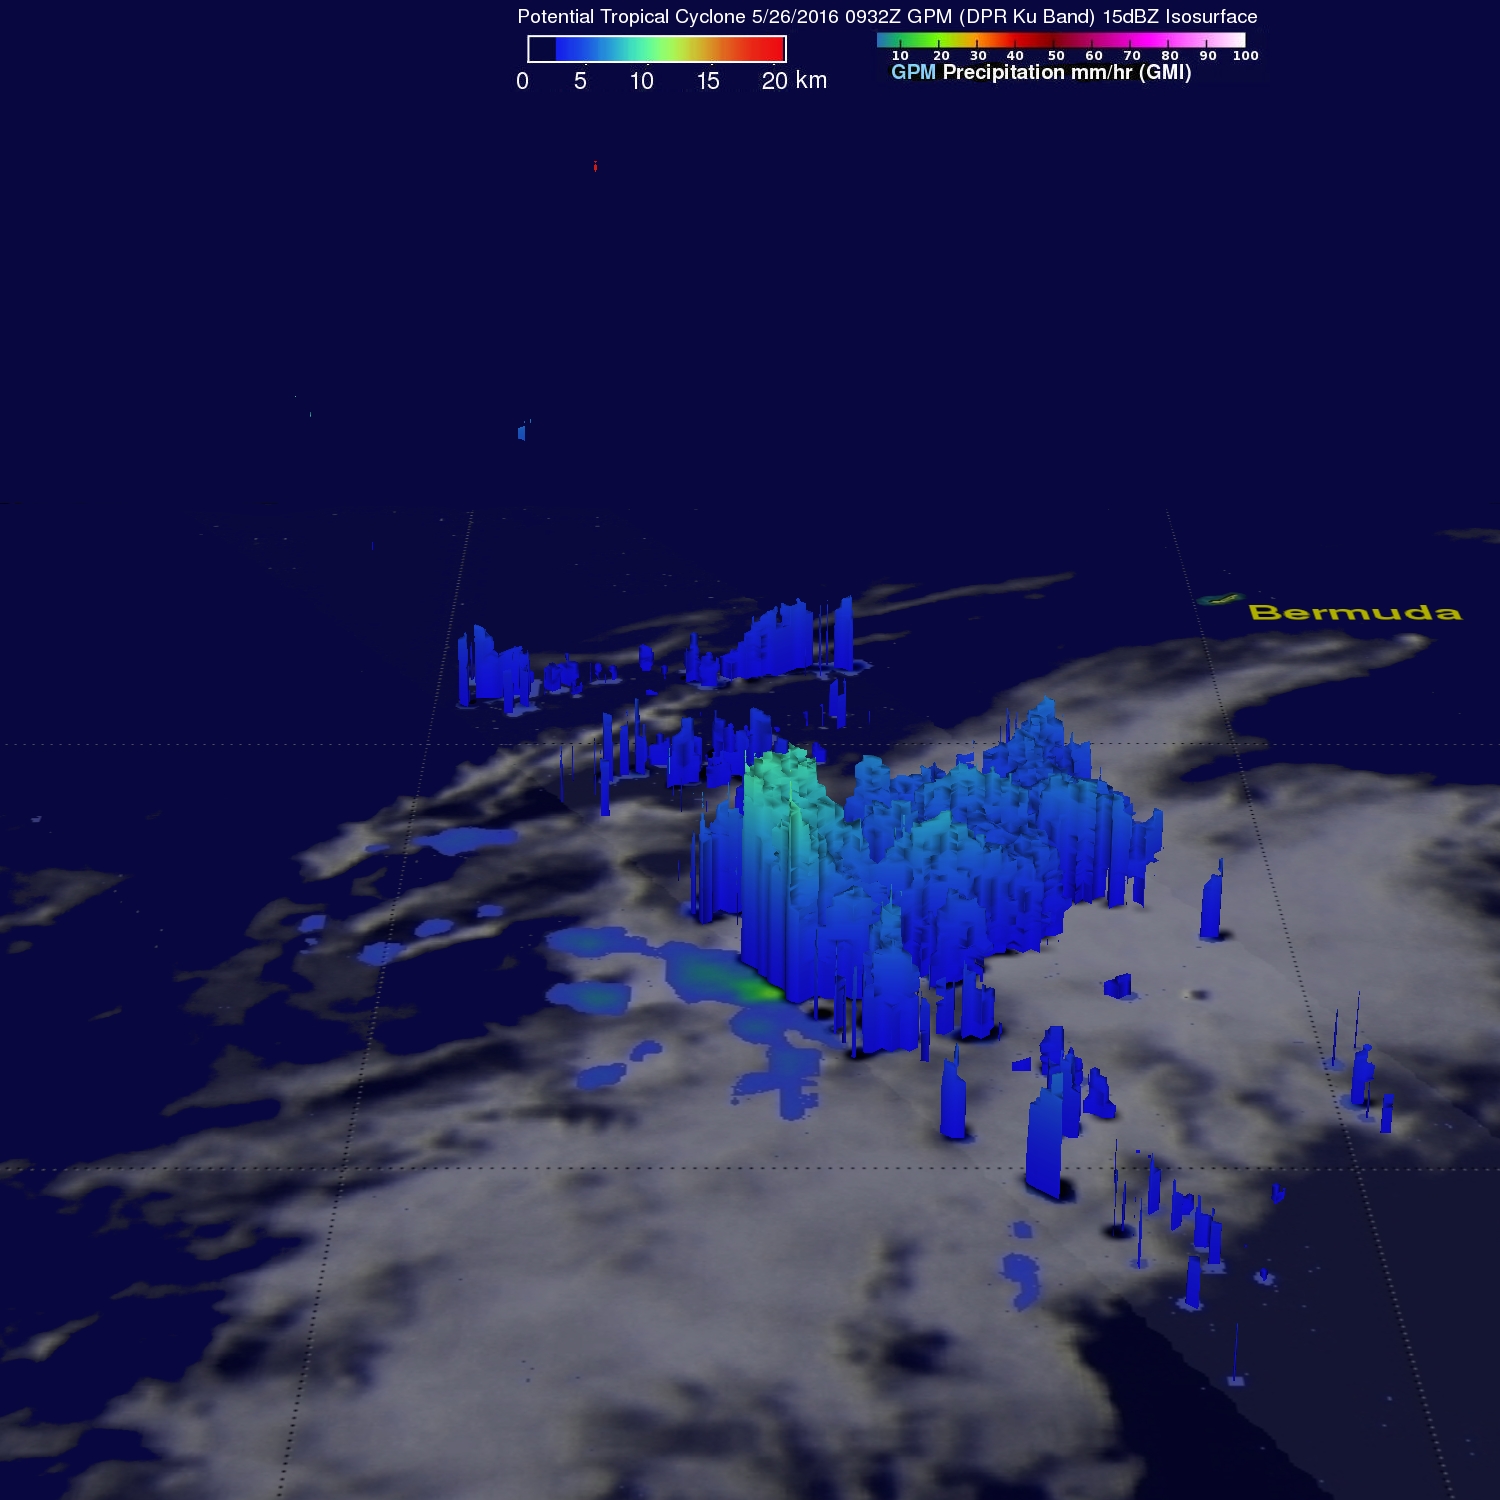
Data from GPM’s DPR was used to the show the 3-D vertical structure of rainfall within the potential cyclone. Some storm top heights in an area of heaviest rainfall were found to reach heights of over 13 km (8 mile). GPM is a joint missions between NASA and the Japanese space agency JAXA.
At 8:25 a.m. EDT on May 26, the National Hurricane Center (NHC) said that System 91L is centered between Bermuda and the Bahamas. NHC noted that the low is gradually becoming better defined while shower activity is increasing. Environmental conditions are expected to become more conducive for tropical or subtropical cyclone formation on Friday while the system moves west-northwestward or northwestward toward the southeastern United States coast.
NHC noted: “With the Memorial Day weekend approaching, all interests along the southeast coast from Georgia through North Carolina should monitor the progress of this low.” The system has a medium chance to develop in the next two days and a high chance to develop in to a subtropical or tropical cyclone over the next five days.
Harold F. Pierce / Rob Gutro
NASA’s Goddard Space Flight Center