


On Feb. 11, 2013, the Landsat 8 satellite rocketed into a sunny California morning onboard a powerful Atlas V and began its life in orbit. In the year since launch, scientists have been working to understand the information the satellite has been sending back. Some have been calibrating the data—checking it against ground observations and matching it to the rest of the 42-year-long Landsat record. At the same time, the broader science community has been learning to use the new data.
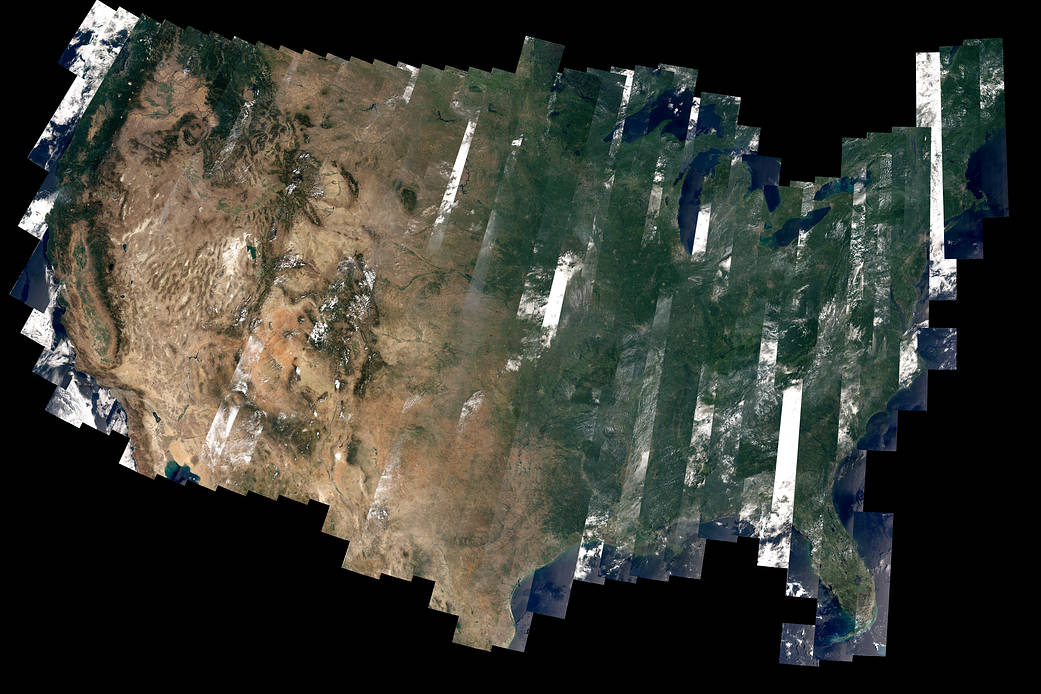
The map above—one of the first complete views of the United States from Landsat 8—is an example of how scientists are testing Landsat 8 data. David Roy, a co-leader of the USGS-NASA Landsat science team and researcher at South Dakota State University, made the map with observations taken during August 2013 by the satellite’s Operational Land Imager.
The strips in the image above are a result of the way Landsat 8 operates. Like its predecessors, Landsat 8 collects data in 185-kilometer (115-mile) wide strips called swaths or paths. Each orbit follows a predetermined ground track so that the same path is imaged each time an orbit is repeated. It takes 233 paths and 16 days to cover all of the land on Earth. This means that every land surface has the potential to be imaged once every 16 days, giving Roy two or three opportunities to get a cloud-free view of each pixel in the United States in a month.
Image Credit: NASA/David Roy