


![Request for Information – Potential [Placeholder for Prize]](https://assets.science.nasa.gov/dynamicimage/assets/science/psd/solar/2023/09/s/solarsystem_0.jpg?w=1024)


Operated by NASA and the French space agency, the Surface Water and Ocean Topography mission provides a new view of water on land, at the coast, and in the ocean.
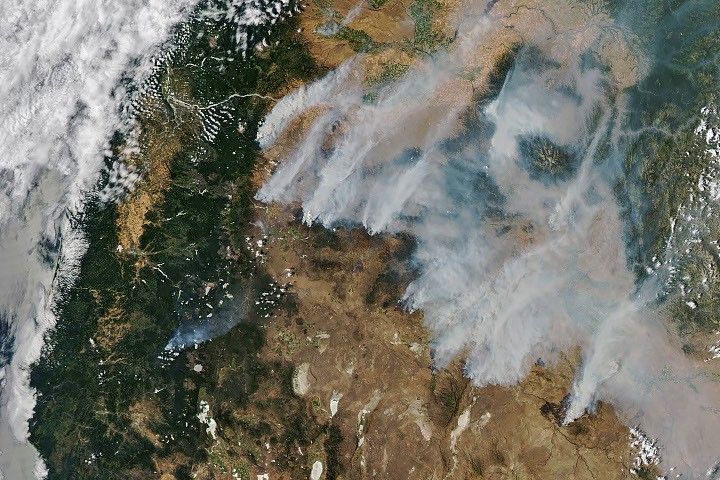
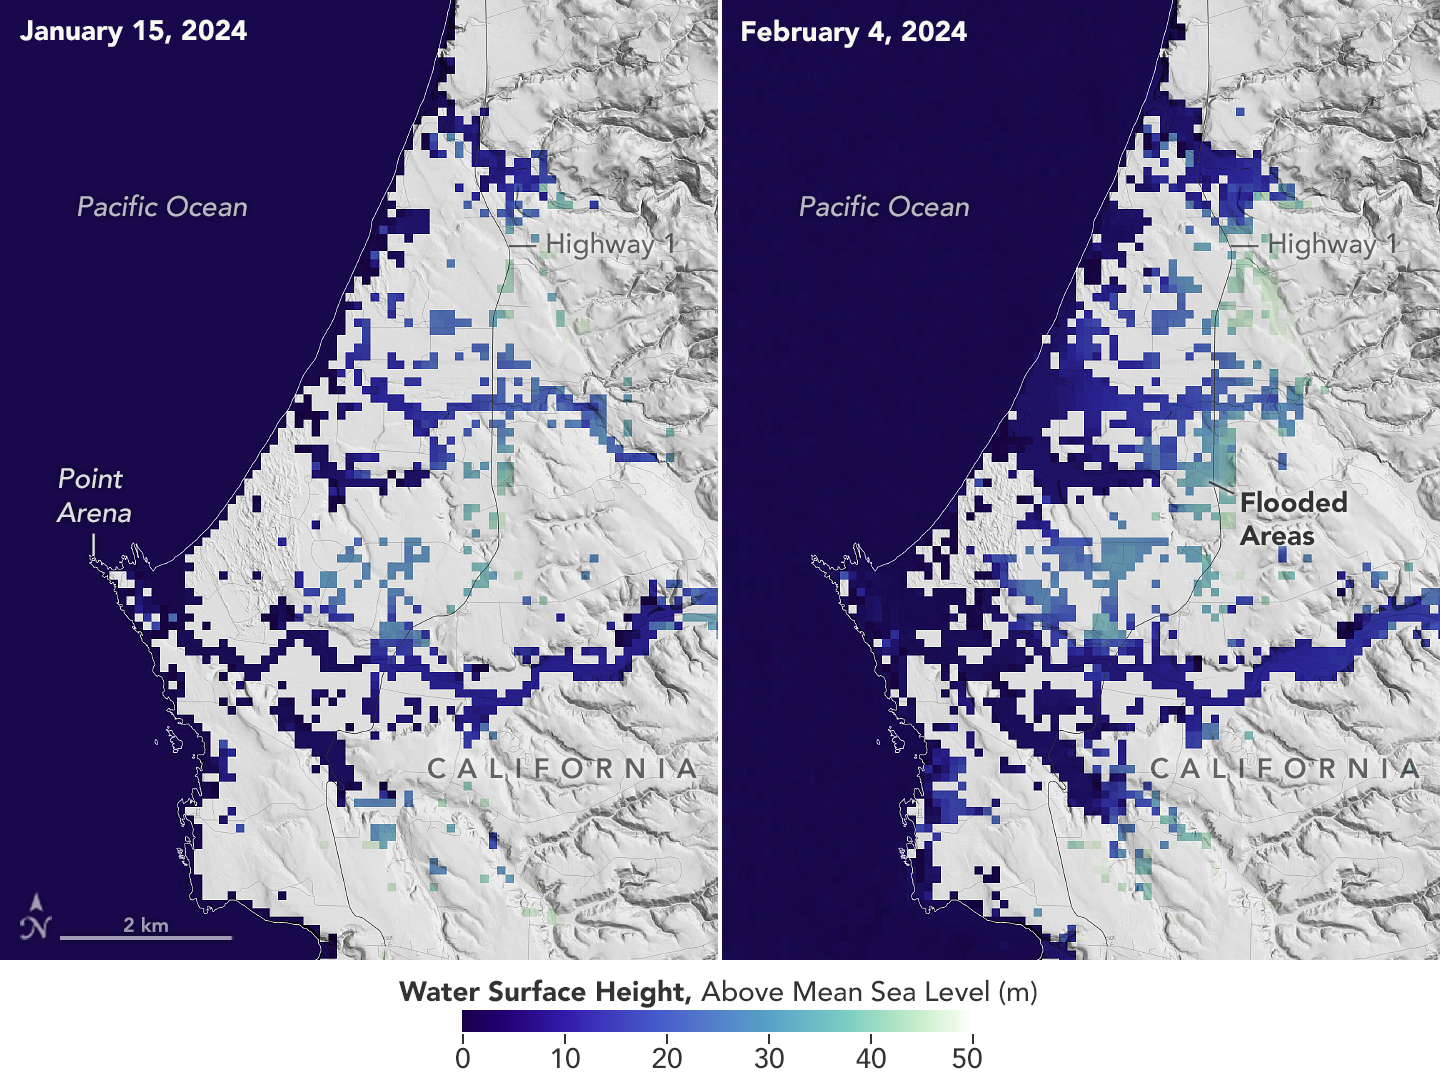
A series of atmospheric rivers drenched California in February, with record amounts of rainfall and hurricane-force winds sweeping across parts of the state. At one point, weather agencies posted flood watches for nearly the entirety of California’s coast. The Surface Water and Ocean Topography (SWOT) mission captured data on some of the flooding near the community of Manchester, roughly 105 miles (169 kilometers) north of San Francisco. The satellite is a collaboration between NASA and the French space agency, CNES (Centre National d’Études Spatiales).
The image above shows the area on Jan. 15, before the rain and snow from atmospheric rivers, and then again on Feb. 4, after the first in a series of storms soaked California. Water heights are shown in shades of green and blue, with lighter hues indicating the highest levels relative to mean sea level. (Data for inland areas includes the height of the floodwaters plus the ground elevation beneath it.) Some coastal areas were flooded by both ocean tides and heavy rain, while others were likely flooded only by precipitation. Each pixel in the image represents an area that is 330 feet by 330 feet (100 meters by 100 meters).
Since December 2022, SWOT has been measuring the height of nearly all water on Earth’s surface, developing one of the most detailed, comprehensive views yet of the planet’s oceans and freshwater lakes and rivers. Not only can the satellite detect the extent of the water on Earth’s surface, as other satellites can, but SWOT can also provide water level data. Combined with other types of information, SWOT measurements can yield water depth data in features like lakes and rivers.
“SWOT gives us information about flooding that we’ve never had before,” said Ben Hamlington, lead researcher for NASA’s sea level change team at the agency’s Jet Propulsion Laboratory in Southern California. Satellites can provide pictures showing how much of an area is flooded, but unless instruments are already installed on a river or at the coast, it’s difficult to know how conditions evolve during and after a flood. “Data from the SWOT satellite, combined with other information, is filling in this picture,” said Hamlington.
The SWOT science team made the measurements using the Ka-band Radar Interferometer (KaRIn) instrument. With two antennas spread 33 feet (10 meters) apart on a boom, KaRIn produces a pair of data swaths as it circles the globe, bouncing radar pulses off water surfaces to collect surface-height measurements.
More About the Mission
Launched in December 2022, from Vandenberg Space Force Base in central California, SWOT is now in its operations phase, collecting data that will be used for research and other purposes.
SWOT was jointly developed by NASA and CNES, with contributions from the Canadian Space Agency (CSA) and the UK Space Agency. NASA’s Jet Propulsion Laboratory, which is managed for the agency by Caltech in Pasadena, California, leads the U.S. component of the project. For the flight system payload, NASA provided the KaRIn instrument, a GPS science receiver, a laser retroreflector, a two-beam microwave radiometer, and NASA instrument operations. CNES provided the Doppler Orbitography and Radioposition Integrated by Satellite (DORIS) system, the dual frequency Poseidon altimeter (developed by Thales Alenia Space), the KaRIn radio-frequency subsystem (together with Thales Alenia Space and with support from the UK Space Agency), the satellite platform, and ground operations. CSA provided the KaRIn high-power transmitter assembly. NASA provided the launch vehicle and the agency’s Launch Services Program, based at Kennedy Space Center, managed the associated launch services.
To learn more about SWOT, visit:
News Media Contacts
Jane J. Lee / Andrew Wang
Jet Propulsion Laboratory, Pasadena, Calif.
818-354-0307 / 626-379-6874
jane.j.lee@jpl.nasa.gov / andrew.wang@jpl.nasa.gov
2024-021