


What can hidden motions underground tell us about earthquakes, eruptions, and even climate change? NASA scientists are using data gathered 400 miles above Earth to find out.
Creeping, rising, falling, slipping – some parts of Earth are in perpetual motion. The movements are usually too tiny for human senses to notice, but they offer clues about more significant changes happening inside volcanoes, along fault lines, and where tectonic plates meet and clash. That’s why scientists at NASA’s Jet Propulsion Laboratory in Southern California are using advanced tools and creative data analyses to find and monitor Earth’s moving surfaces. Here are a few things they’ve learned recently.
Moving Mountains
Geologists once had to go into the field over and over again to collect data on how Earth moves, using technology like GPS and plotting each new measurement on topographic maps. In the 1990s, scientists at JPL and elsewhere developed a new data-processing technique that enabled them to obtain very accurate images using a radar small enough to be mounted on a plane or satellite.
As this new data began to accumulate, “it was like you were seeing maps come to life,” said Paul Lundgren, head of JPL’s Earth Surface and Interior group. In some cases, he said, “you could almost intuitively understand the type of mechanism that was causing a volcanic eruption.”
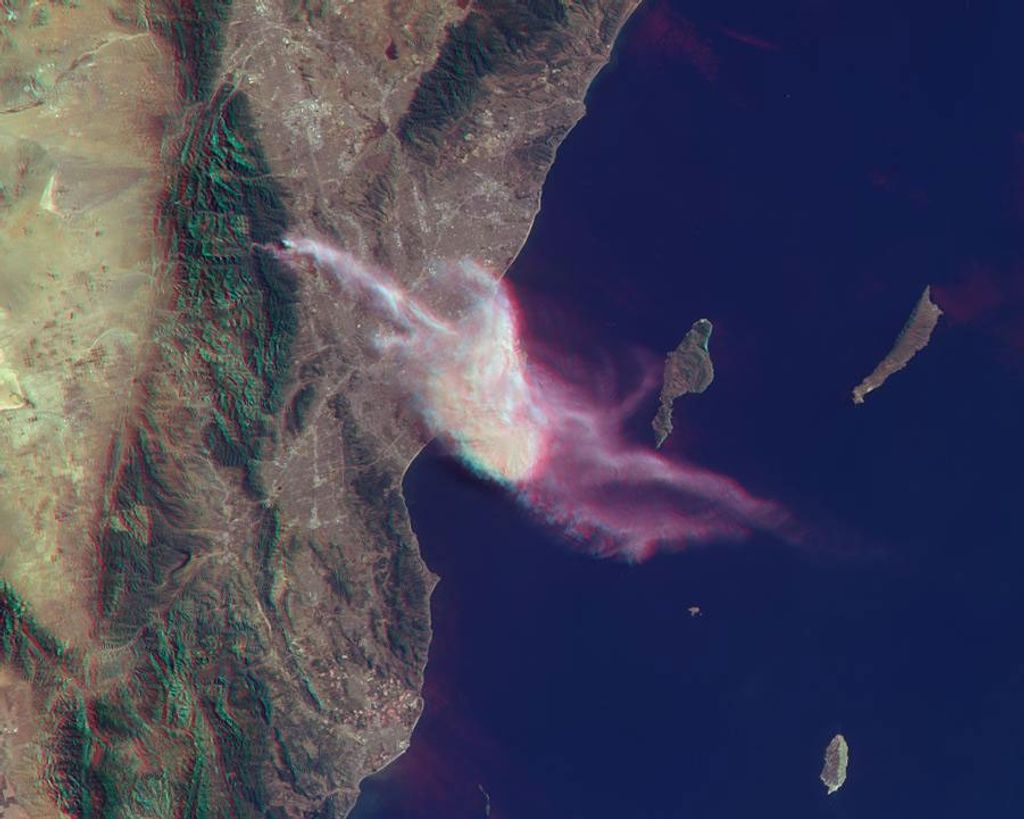
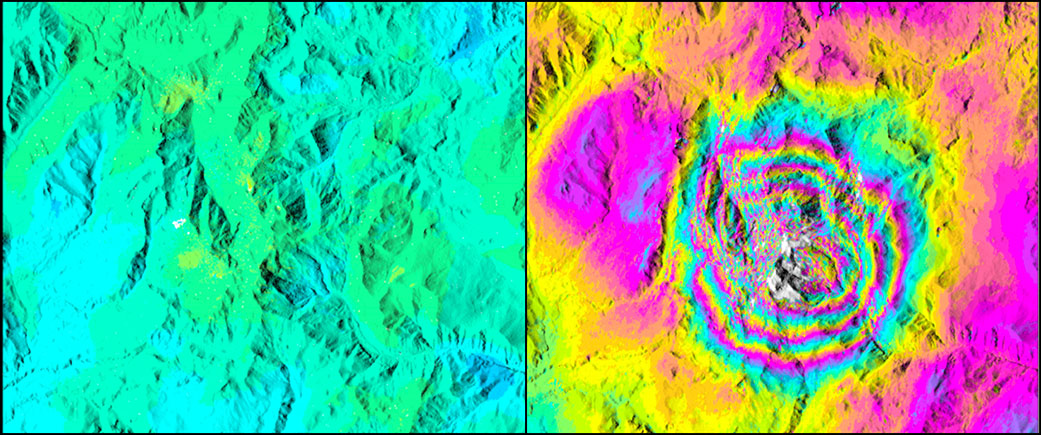
Space agencies worldwide began launching satellite instruments using the new technology – called interferometric synthetic aperture radar or InSAR – and discoveries from this new way of looking at the planet were inevitable. One occurred in 2018 when Chilean authorities asked Lundgren’s group to assess whether a volcano called Nevados de Chillán might be about to erupt. Studying a year’s worth of InSAR images, Lundgren saw no changes in the Chilean peak. But he did notice that another Argentinian volcano named Domuyo was rapidly inflating – a sign of a potential eruption.
Checking earlier data, Lundgren and Társilo Girona (a postdoctoral fellow at JPL at the time who’s now at the University of Alaska, Fairbanks) found that Domuyo had actually deflated between 2008 and 2011. It began inflating in mid-2014, rising about 20 inches (50 centimeters) by the time Lundgren spotted it. Domuyo topped out in 2020 and is now deflating again without having erupted.
After additional analysis of land surface temperature data from NASA’s Moderate Resolution Imaging Spectrometer satellite instruments, Lundgren and Girona concluded that while rising magma causes Domuyo to inflate, gases from the magma can dissipate through the rock, reducing the pressure inside the mountain. The escaping gas occasionally produces a minor explosion on the slopes, but the volcano eventually deflates without pressure building into a major explosion.
“Domuyo hasn’t erupted for the past 100,000 years, so this behavior has probably been occurring throughout time,” Lundgren said. “All the same, we need to keep watching it.”
The scientists are searching InSAR satellite data for other volcanos around the world that episodically rise and fall. “There could be behavior that, if you could understand it, you might be able to predict when something is going to erupt,” Lundgren said.
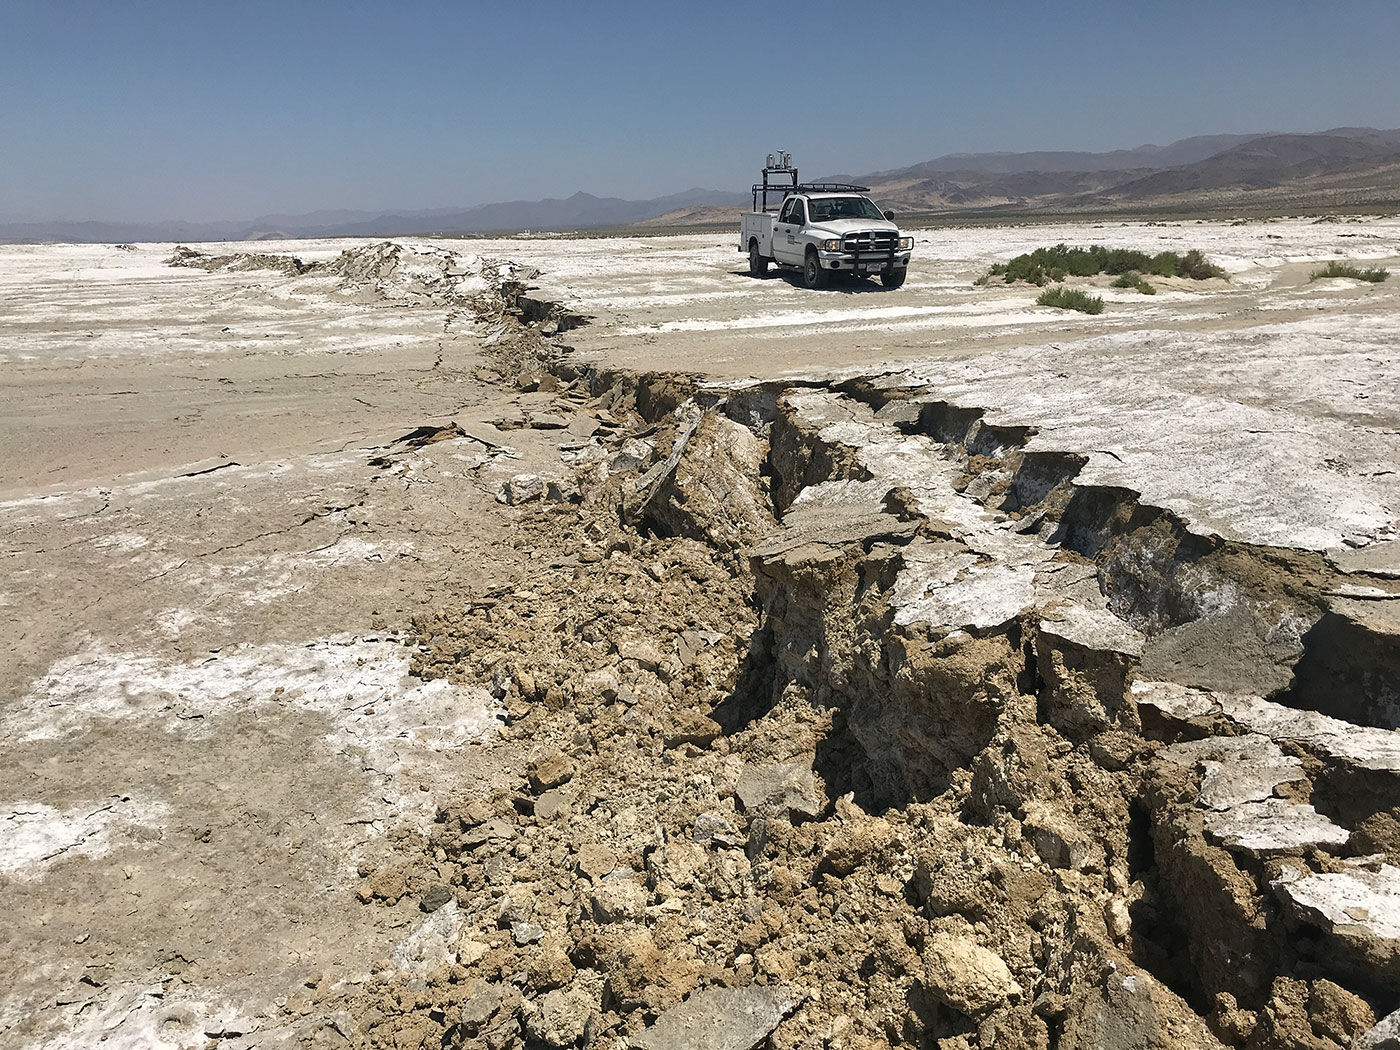
Sticky Faults
Earthquakes occur at places where two sides of a fault line have become stuck together, or locked. As the tectonic plates below the fault continue to move, stress builds on the locked area until the fault rips apart.
However, not all faults are locked. Take the Hayward Fault, considered one of the two most dangerous faults in California. Running 75 miles (120 kilometers) along the east side of San Francisco Bay beneath densely populated land, the fault is now past its average of 150 years between earthquakes.
“The Hayward Fault is unusual,” said JPL scientist Eric Fielding. “Parts of the fault are continuously slipping, a motion we call fault creep.” Creeping faults are less likely to produce large earthquakes because the motion relieves much of the stress. With data collected from dozens of NASA airborne InSAR flights since 2009, Fielding and colleagues are mapping where the Hayward Fault is creeping to better understand how much of it is likely to slip in the next large earthquake. Such information could help planners prepare better.
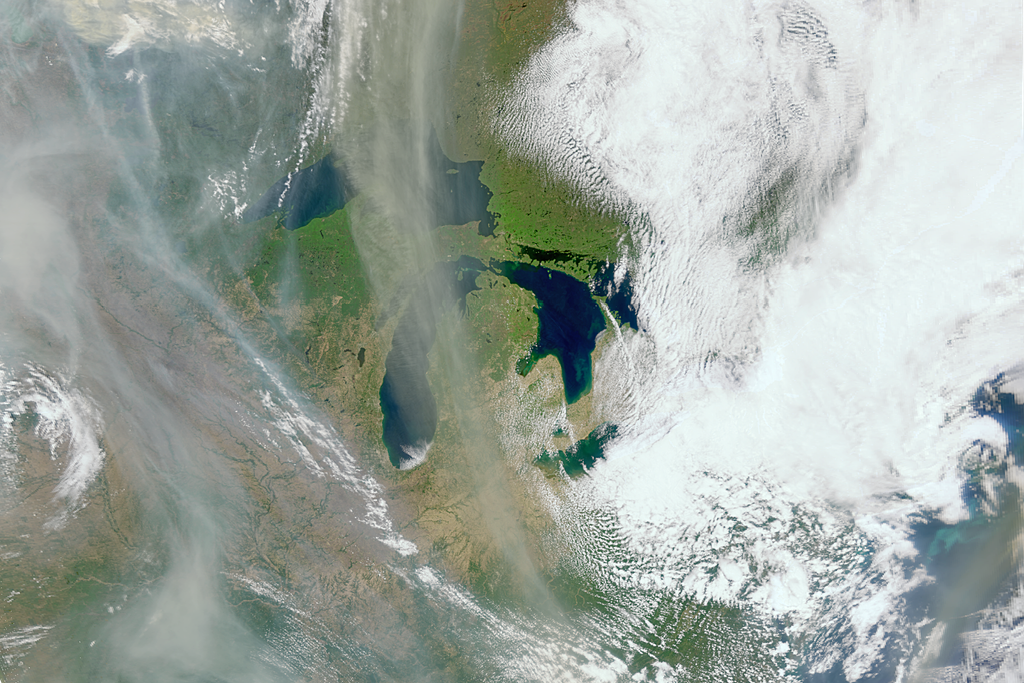
JPL’s Zhen Liu is using InSAR data, GPS measurements, and numerical models to study a different kind of motion in the earthquake-prone Pacific Northwest, where the Juan de Fuca tectonic plate is diving offshore under the North American plate. The small Juan de Fuca plate snags the land above it and drags the coastline eastward for about 14 months at a time. Eventually, the stress becomes too great, and for two weeks the land slowly slips back westward.
Regularly repeating slow-slip events like this have also been observed in New Zealand and elsewhere. When these patterns change, Liu noted, “there’s increasing evidence that slow-slip events may be harbingers of large earthquakes.” In a recent study with Yingdi Luo of Caltech, Liu suggested that the 14-month cycle in the Northwest may speed up before the next big earthquake.
Fielding and Liu look forward to the 2024 launch of the NASA-Indian Space Research Organization Synthetic Aperture Radar (NISAR) mission, which will deliver a trove of new InSAR data. NISAR will observe every location on Earth every 12 days – better coverage than existing satellites – increasing the chances of spotting unusual land motions and improving early warning capabilities.
Canadian Uplift
Reducing risks from natural hazards isn’t the only motive for studying the movement of Earth’s surface. Scientists also want to understand how natural processes interact with human-induced climate change.
An example of this is how the bending and straightening of the North American tectonic plate is affecting sea levels from Florida to the Arctic. During the last ice age, ice sheets several miles thick accumulated on the northern half of the North American tectonic plate, squashing it down into the mantle below (30 to 50 miles, or 50 to 80 kilometers, down). The surface of modern Canada sank as mantle material flowed out from under the extra weight, and much of the modern United States rose as that displaced material flowed in.
Although it has been 8,000 years since the ice sheets melted, the mantle beneath North America is still recovering from the pressure. Returning mantle material has been lifting the Canadian land mass higher above the ocean – high enough to outpace global sea level rise. But the northward flow of mantle material has been causing the eastern and southern coasts of the U.S. to sink, compounding the risks from sea level rise that has accompanied global climate change.
To understand the course of future sea level rise, we need to know more about this natural process: How long will it continue? How much farther will the rebounding mantle move? Scientists are developing computer models of solid Earth processes to help answer such questions. Recently, JPL scientist Donald Argus has been using data from the NASA-German Gravity Recovery and Climate Experiment (GRACE) satellites and from GPS and sea level measurements to start assessing the stickiness (viscosity) of the mantle, which affects the rate of surface recovery. “We depend on GRACE for estimates of snow and ice loss and to understand sea level rise, but you have to get the model right,” Argus said.
Jane J. Lee / Andrew Wang
Jet Propulsion Laboratory, Pasadena, Calif.
818-354-0307 / 626-379-6874
jane.j.lee@jpl.nasa.gov / andrew.wang@jpl.nasa.gov
Written by Carol Rasmussen
2023-004