


Sea level rise is a natural consequence of the warming of our planet.
We know this from basic physics. When water heats up, it expands. So when the ocean warms, sea level rises. When ice is exposed to heat, it melts. And when ice on land melts and water runs into the ocean, sea level rises.
For thousands of years, sea level has remained relatively stable and human communities have settled along the planet’s coastlines. But now Earth’s seas are rising. Globally, sea level has risen about eight inches since the beginning of the 20th century and more than two inches in the last 20 years alone.
All signs suggest that this rise is accelerating.
While NASA and other agencies continue to monitor the warming of the ocean and changes to the planet’s land masses, the biggest concern is what will happen to the ancient ice sheets covering Greenland and Antarctica, which continue to send out alerts that a warming planet is affecting their stability.
“We’ve seen from the paleoclimate record that sea level rise of as much as 10 feet in a century or two is possible, if the ice sheets fall apart rapidly,” said Tom Wagner, the cryosphere program scientist at NASA Headquarters in Washington. “We’re seeing evidence that the ice sheets are waking up, but we need to understand them better before we can say we’re in a new era of rapid ice loss.”
Finding the Level
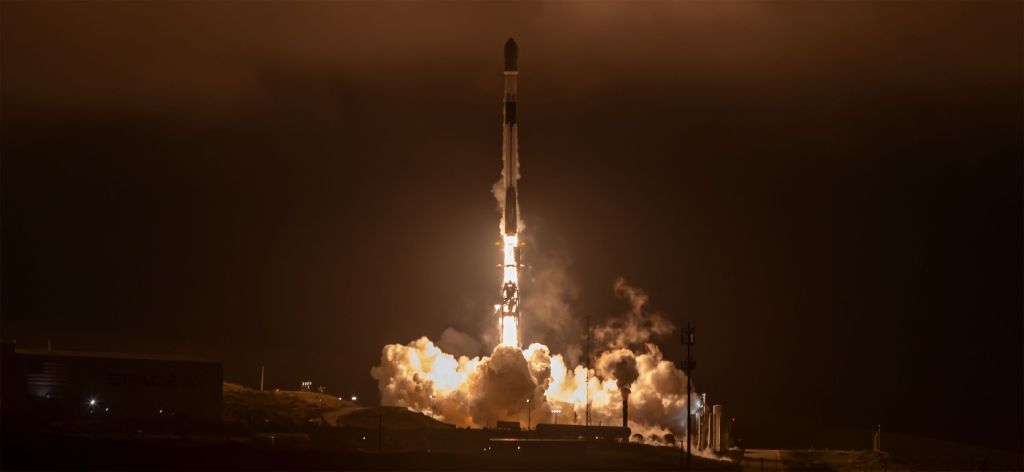
NASA has been recording the height of the ocean surface from space since 1992. That year, NASA and the French space agency, CNES, launched the first of a series of spaceborne altimeters that have been making continuous measurements ever since. The first instrument, Topex/Poseidon, and its successors, Jason-1 and -2, have recorded about 2.9 inches (7.4 centimeters) of rise in sea level averaged over the globe.
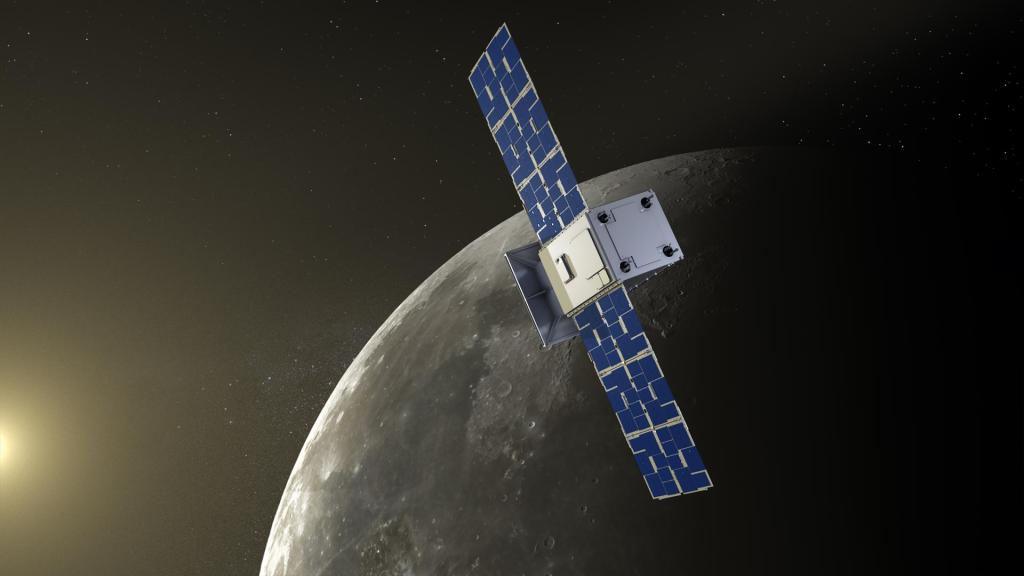
In the 21st century, two new sensing systems have proven to be invaluable complements to the satellite altimetry record. In 2002, NASA and the German space agency launched the Gravity Recovery and Climate Experiment (GRACE) twin satellites. These measure the movement of mass, and hence gravity, around Earth every 30 days. Earth’s land masses move very little in a month, but its water masses move through melting, evaporation, precipitation and other processes. GRACE records these movements of water around the globe. The other new system is the multinational Argo array, a network of more than 3,000 floating ocean sensors spread across the entire open ocean.
“To study sea level rise, the Jason series, GRACE, and Argo are the big three,” said oceanographer Josh Willis of NASA’s Jet Propulsion Laboratory, Pasadena, California, the project scientist for the upcoming Jason-3 altimetry mission.
Credits: NASA’s Jet Propulsion Laboratory
Observations from the Jason series have revolutionized scientists’ understanding of contemporary sea level rise and its causes. We know that today’s sea level rise is about one-third the result of the warming of existing ocean water, with the remainder coming from melting land ice.
And it has shown precisely that the sea, of course, is not actually level. It varies as much as six feet (two meters) from place to place. And it is not rising evenly, like a bathtub filling with water. Currently, regional differences in sea level rise are dominated by the effects of ocean currents and natural cycles such as the Pacific Ocean’s El Niño phenomenon and Pacific Decadal Oscillation. As the ice sheets continue to melt, scientists predict their meltwater will overtake natural causes as the most significant source of regional variations and the most significant contributor to overall sea level rise.
Or as Willis put it: “You ain’t seen nothing yet.”
Watching Ice Melt
Not that long ago, in the early 1990s, scientists were not able to determine whether polar land ice was growing, shrinking, or in balance. Satellite and airborne missions, complemented by field measurements, have not only answered that question, but also provided the means for scientists to determine the mechanisms that are contributing to the growth and shrinkage of polar ice.
These advances in observing the world’s frozen regions have allowed scientists to accurately estimate annual ice losses from Greenland and Antarctica in only the last decade. We now know not only how much sea level is changing – as measured by satellite for the past 23 years – but we can determine how much sea level rise is caused by the loss of land ice.
In addition to the launch of the GRACE satellites in 2002, NASA also deployed the Ice Cloud and land Elevation Satellite (ICESat) from 2003 to 2009 to map changes in the height of the polar ice sheets using laser pulses. Other space agencies have used radar instruments to measure glacier speeds, as well as surface topography, such as the European Space Agency’s CryoSat-2 satellite. Airborne missions, like NASA’s Operation IceBridge, complement these measurements with instruments that map the bedrock topography beneath the ice, determine ice thickness and characterize its internal layers, and detect the depth of overlying snow. Combining these relatively recent – and unprecedented – measurements with longer-term satellite records and reanalyses of regional climate data extends the record of ice sheet mass balance to more than 40 years.
Several studies have shown that different remote sensing methods for studying ice sheet mass balance agree well. GRACE’s record, spanning over a decade, shows that the ice loss is accelerating in Greenland and West Antarctica. Greenland has shed on average 303 gigatons of ice every year since 2004, while Antarctica has lost on average 118 gigatons of ice per year, with most of the loss coming from West Antarctica. Greenland’s ice loss has accelerated by 31 gigatons of ice per year every year since 2004, while West Antarctica has experienced an ice mass loss acceleration of 28 gigatons per year.
“Given what we know now about how the ocean expands as it warms and how ice sheets and glaciers are adding water to the seas, it’s pretty certain we are locked into at least 3 feet of sea level rise and probably more,” said Steve Nerem of the University of Colorado, Boulder, and lead of NASA’s new Sea Level Change Team. “But we don’t know whether it will happen within a century or somewhat longer.”
The Warming North
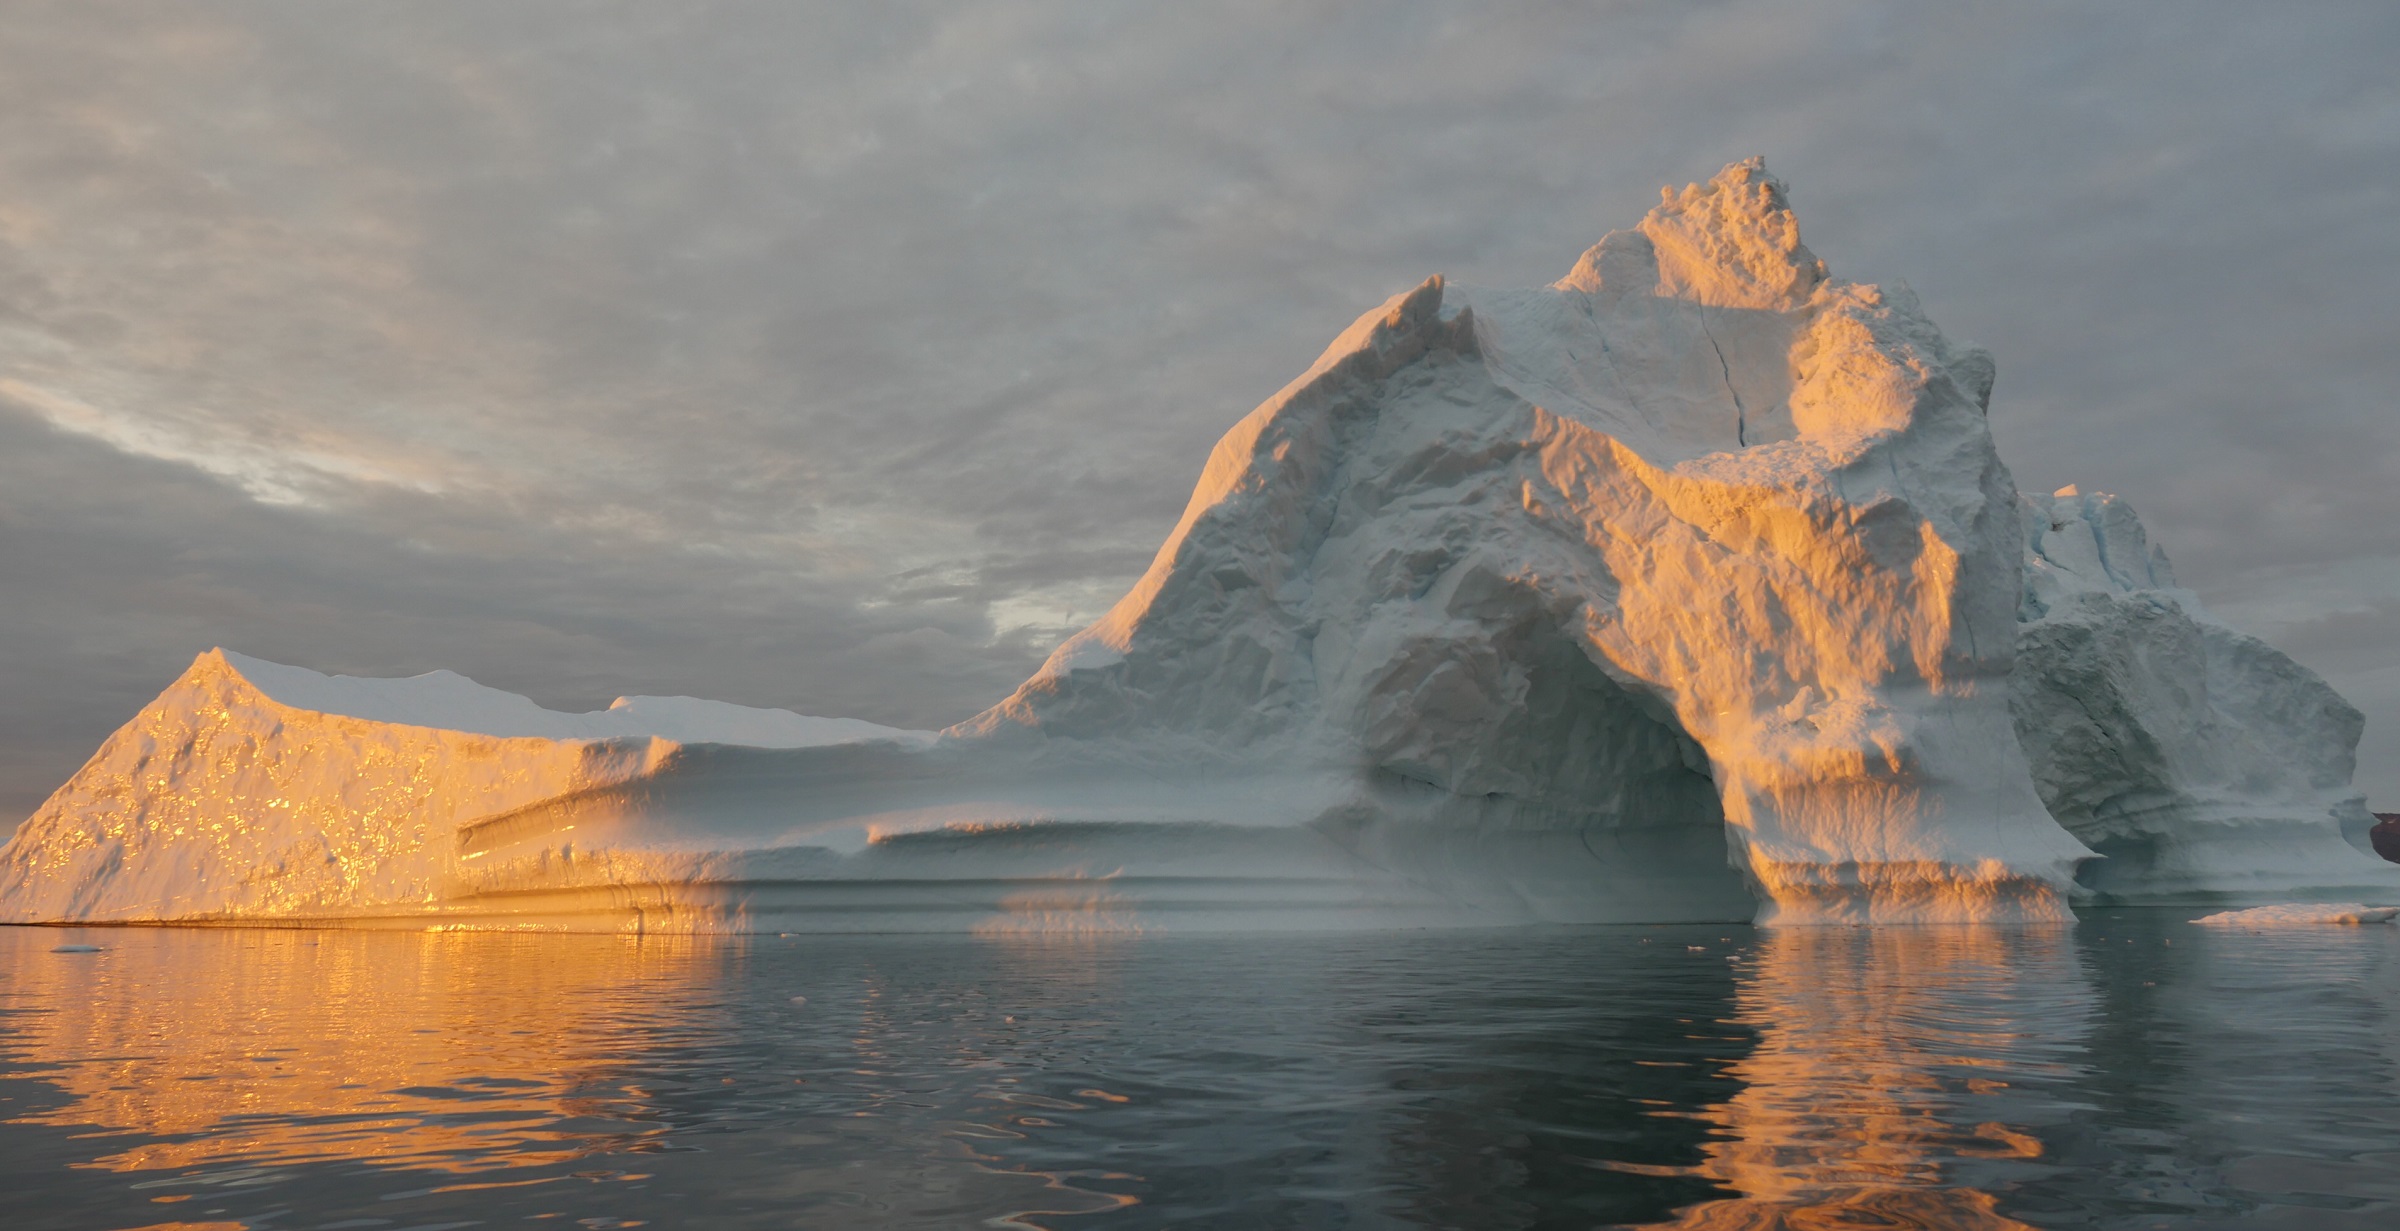
The Greenland Ice Sheet, spanning 660,000 square miles (an area almost as big as Alaska) and with a thickness at its highest point of almost 2 miles, has the potential to raise the world’s oceans by more than 20 feet. Situated in the Arctic, which is warming at twice the rate of the rest of the planet, Greenland fell out of balance in the 1990s, and is now shedding more and more ice in the summer than it gains back in the winter.
Credits: NASA Goddard’s Scientific Visualization Studio
Download this video in HD formats from NASA Goddard’s Scientific Visualization Studio
“In Greenland, everything got warmer at the same time: the air, the ocean surface, the depths of the ocean,” said Ian Joughin, a glaciologist at University of Washington. “We don’t really understand which part of that warming is having the biggest effect on the glaciers.”
What scientists do know is that warming Arctic temperatures – and a darkening surface of the Greenland ice sheet – are causing so much summer melting that it is now the dominant factor in Greenland’s contribution to sea level rise.
Greenland’s summer melt season now lasts 70 days longer than it did in the early 1970s. Every summer, warmer air temperatures cause melt over about half of the surface of the ice sheet – although recently, 2012 saw an extreme event where 97 percent of the ice sheet experienced melt at its top layer.
Greenland’s glaciers have sped up, too. Though many of the glaciers in the southeast, west and northwest of the island that experienced quick thinning from 2000 to 2006 have now slowed down, others haven’t. A study last year showed that the northeast Greenland ice stream had increased its ice loss rate due to regional warming.
“The early 2000s was when some big things revealed themselves, such as when we saw the fastest glacier we knew of, the Jakobshavn ice stream in Greenland, double its speed,” said Waleed Abdalati, director of the Cooperative Institute for Research in Environmental Sciences, Boulder, Colorado, and former NASA chief scientist. “The subsequent surprise was that these changes could be sustained for a decade – Jakobshavn is still going fast.”
To answer the questions of how these glaciers will behave, how much they will contribute to sea level rise and how fast those changes will occur, scientists need better data on the bathymetry or geography of the ocean floor surrounding Greenland, said Eric Rignot, a glaciologist with NASA’s Jet Propulsion Laboratory and the University of California, Irvine.
“Bathymetry is critical for understanding how ocean waters circulate around Greenland, for projections and for understanding what we’ve been observing in the past few decades,” Rignot said.
Beginning with the deployment of research buoys in the waters around Greenland this summer, NASA is embarking on a three-year airborne and ship-based campaign to answer precisely these questions. OMG, Oceans Melting Greenland, seeks to understand the role of ocean currents and ocean temperatures in melting Greenland’s ice from below – and therefore better predict the speed at which the ice sheet will raise sea level.
Changes At The Southern End of The World
The Antarctic Ice Sheet covers nearly 5.4 million square miles, and area larger than the United States and India combined, and contains enough ice to raise the ocean level by about 190 feet. The Transantarctic Mountains split Antarctica in two major regions: West Antarctica and the much larger East Antarctica.
Though Antarctica’s contribution to sea level rise is still at less than 0.02 inches (0.5 millimeters) per year, several events over the past decade and a half have prompted experts to start warning about an the possibility of more rapid changes in the upcoming century.
The mountainous horn of the continent, the Antarctic Peninsula, gave one of the earliest warnings on the impact of a changing climate in Antarctica, when warming air and ocean temperatures led to the dramatically fast breakup of the Larsen B ice shelf in 2002. In about a month, 1,250 square miles of floating ice that had been stable for over 10,000 years were gone. In the following years, other ice shelves in the Peninsula, including the last remainder of Larsen B, collapsed, speeding up in the flow of the glaciers that they were buttressing.
In 2014, West Antarctica grabbed the spotlight when two studies focusing on the acceleration of the glaciers in the Amundsen Sea sector showed that its collapse is underway. While one of the studies said that the demise could take 200 to 1,000 years, depending on how rapidly the ocean heats up, both studies concurred that the collapse is unstoppable and will add up to 12 feet of sea level rise.
Credits: NASA Goddard’s Scientific Visualization Studio
Download this video in HD formats from NASA Goddard’s Scientific Visualization Studio
For the West Antarctic Ice Sheet, which largely rests on a bed that lies below sea level, the main driver of ice loss is the ocean. The waters of the Southern Ocean are layered: on top and at the bottom, the temperatures are frigid, but the middle layer is warm. The westerlies, the winds that spin the ocean waters around Antarctica, have intensified during the last decade, pushing the cold top layer away from the land. This allows the warmer, deeper waters to rise and spill over the border of the continental shelf, flowing all the way back to the base of many ice shelves. As the ice shelves weaken from underneath, the glaciers behind them speed up.
East Antarctica’s massive ice sheet, as vast as the lower continental U.S., remains the main unknown in projections of sea level rise. Though it appears to be stable, a recent study on Totten Glacier, East Antarctica’s largest and most rapidly thinning glacier, hints otherwise. The research found two deep troughs that could lead warm ocean water to the base of the glacier and melt it in a similar way to what’s happening to the glaciers in West Antarctica. Other sectors grounded below sea level, such as the Cook Ice Shelf, Ninnis, Mertz and Frost glaciers, are also losing mass.
“The prevailing view among specialists has been that East Antarctica is stable, but I don’t think we really know,” said Rignot. “Some of the signs we see in the satellite data right now are kind of red flags that these glaciers might not be as stable as we once thought. There’s always a lot of attention paid by the media to the changes we see now, but as scientists our priority remains what the changes could be tomorrow.”
On the other hand, weather models and reanalyses have shown that there has been an increase in snowfall along the coastline of Dronning Maud Land, which might counteract East Antarctica’s ice loss. But this may be a temporary shift – scientists can’t tell, because obtaining accurate field measurements of snow in Antarctica is extremely difficult. There are few weather stations and they might not provide representative measurements because snowfall in Antarctica doesn’t distribute evenly; the strong katabatic winds wipe some areas clean and make snow pile up in others. And satellite readings are not yet precise enough to detect small accumulation changes that would represent a difference of gigatons of mass when spread over East Antarctica’s huge surface.
As is the case for Greenland, researchers also working on Antarctica need better data on the Southern Ocean bathymetry and the pathways that warm waters can follow to reach the ice. And this kind of data, as well as snow accumulation and other ocean data, can’t be obtained remotely with enough precision, according to Ted Scambos lead scientist at the University of Colorado’s National Snow and Ice Data Center.
“We’ve learned so much from the satellites that we’ve been surfing the wave of new understanding for the last 20 years,” Scambos said. “But now, to go further, we have to try to get instruments on the ground while maintaining the ability we have with airborne and satellite missions to watch the ice sheet from a global perspective.”
Related Links
Maria-José Viñas and Carol Rasmussen
NASA’s Earth Science News Team