


![Request for Information – Potential [Placeholder for Prize]](https://assets.science.nasa.gov/dynamicimage/assets/science/psd/solar/2023/09/s/solarsystem_0.jpg?w=1024)


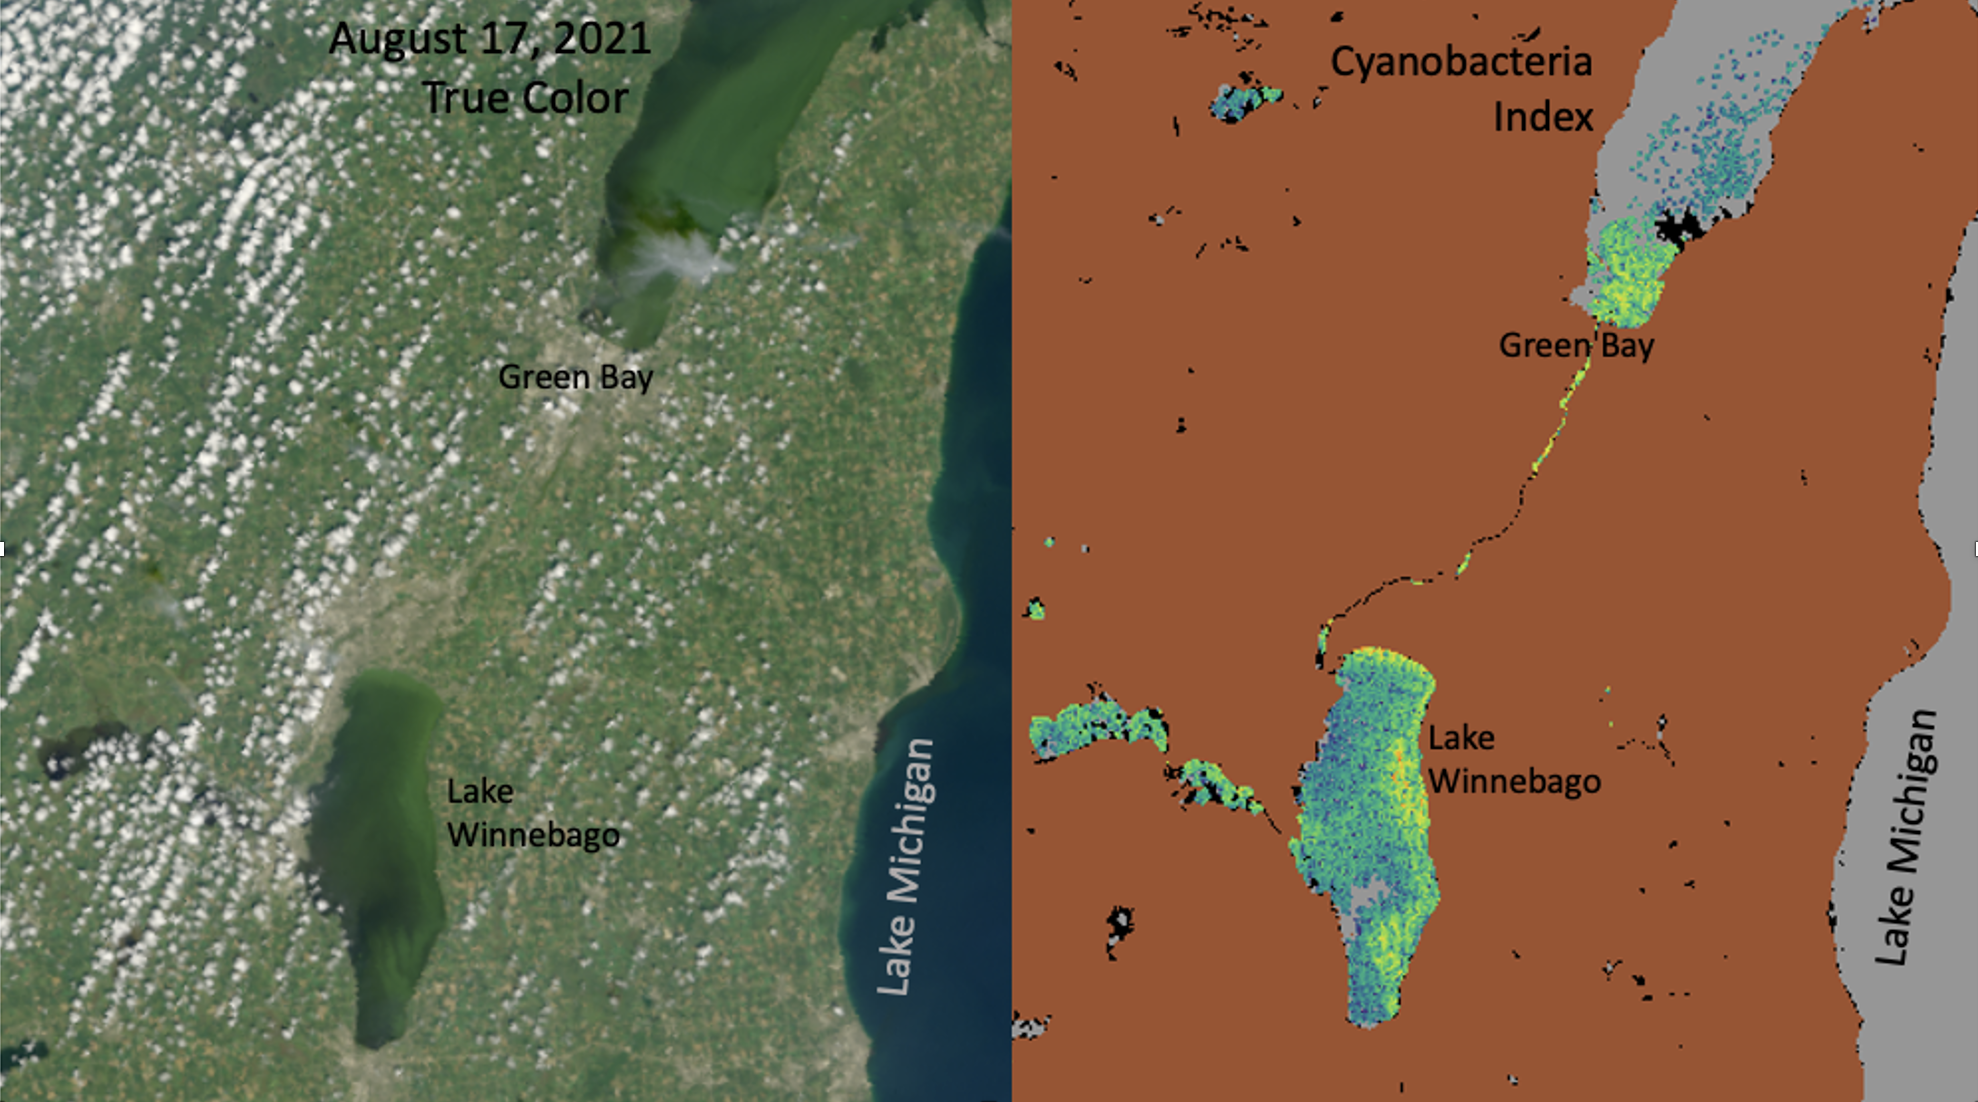
Lakes provide drinking water for people, habitat for plants and wildlife, and a place to fish, boat and swim. But the water can become harmful to humans, animals and the ecosystem when toxic algae called cyanobacteria reach abnormally high levels due to warm, nutrient-rich water conditions.
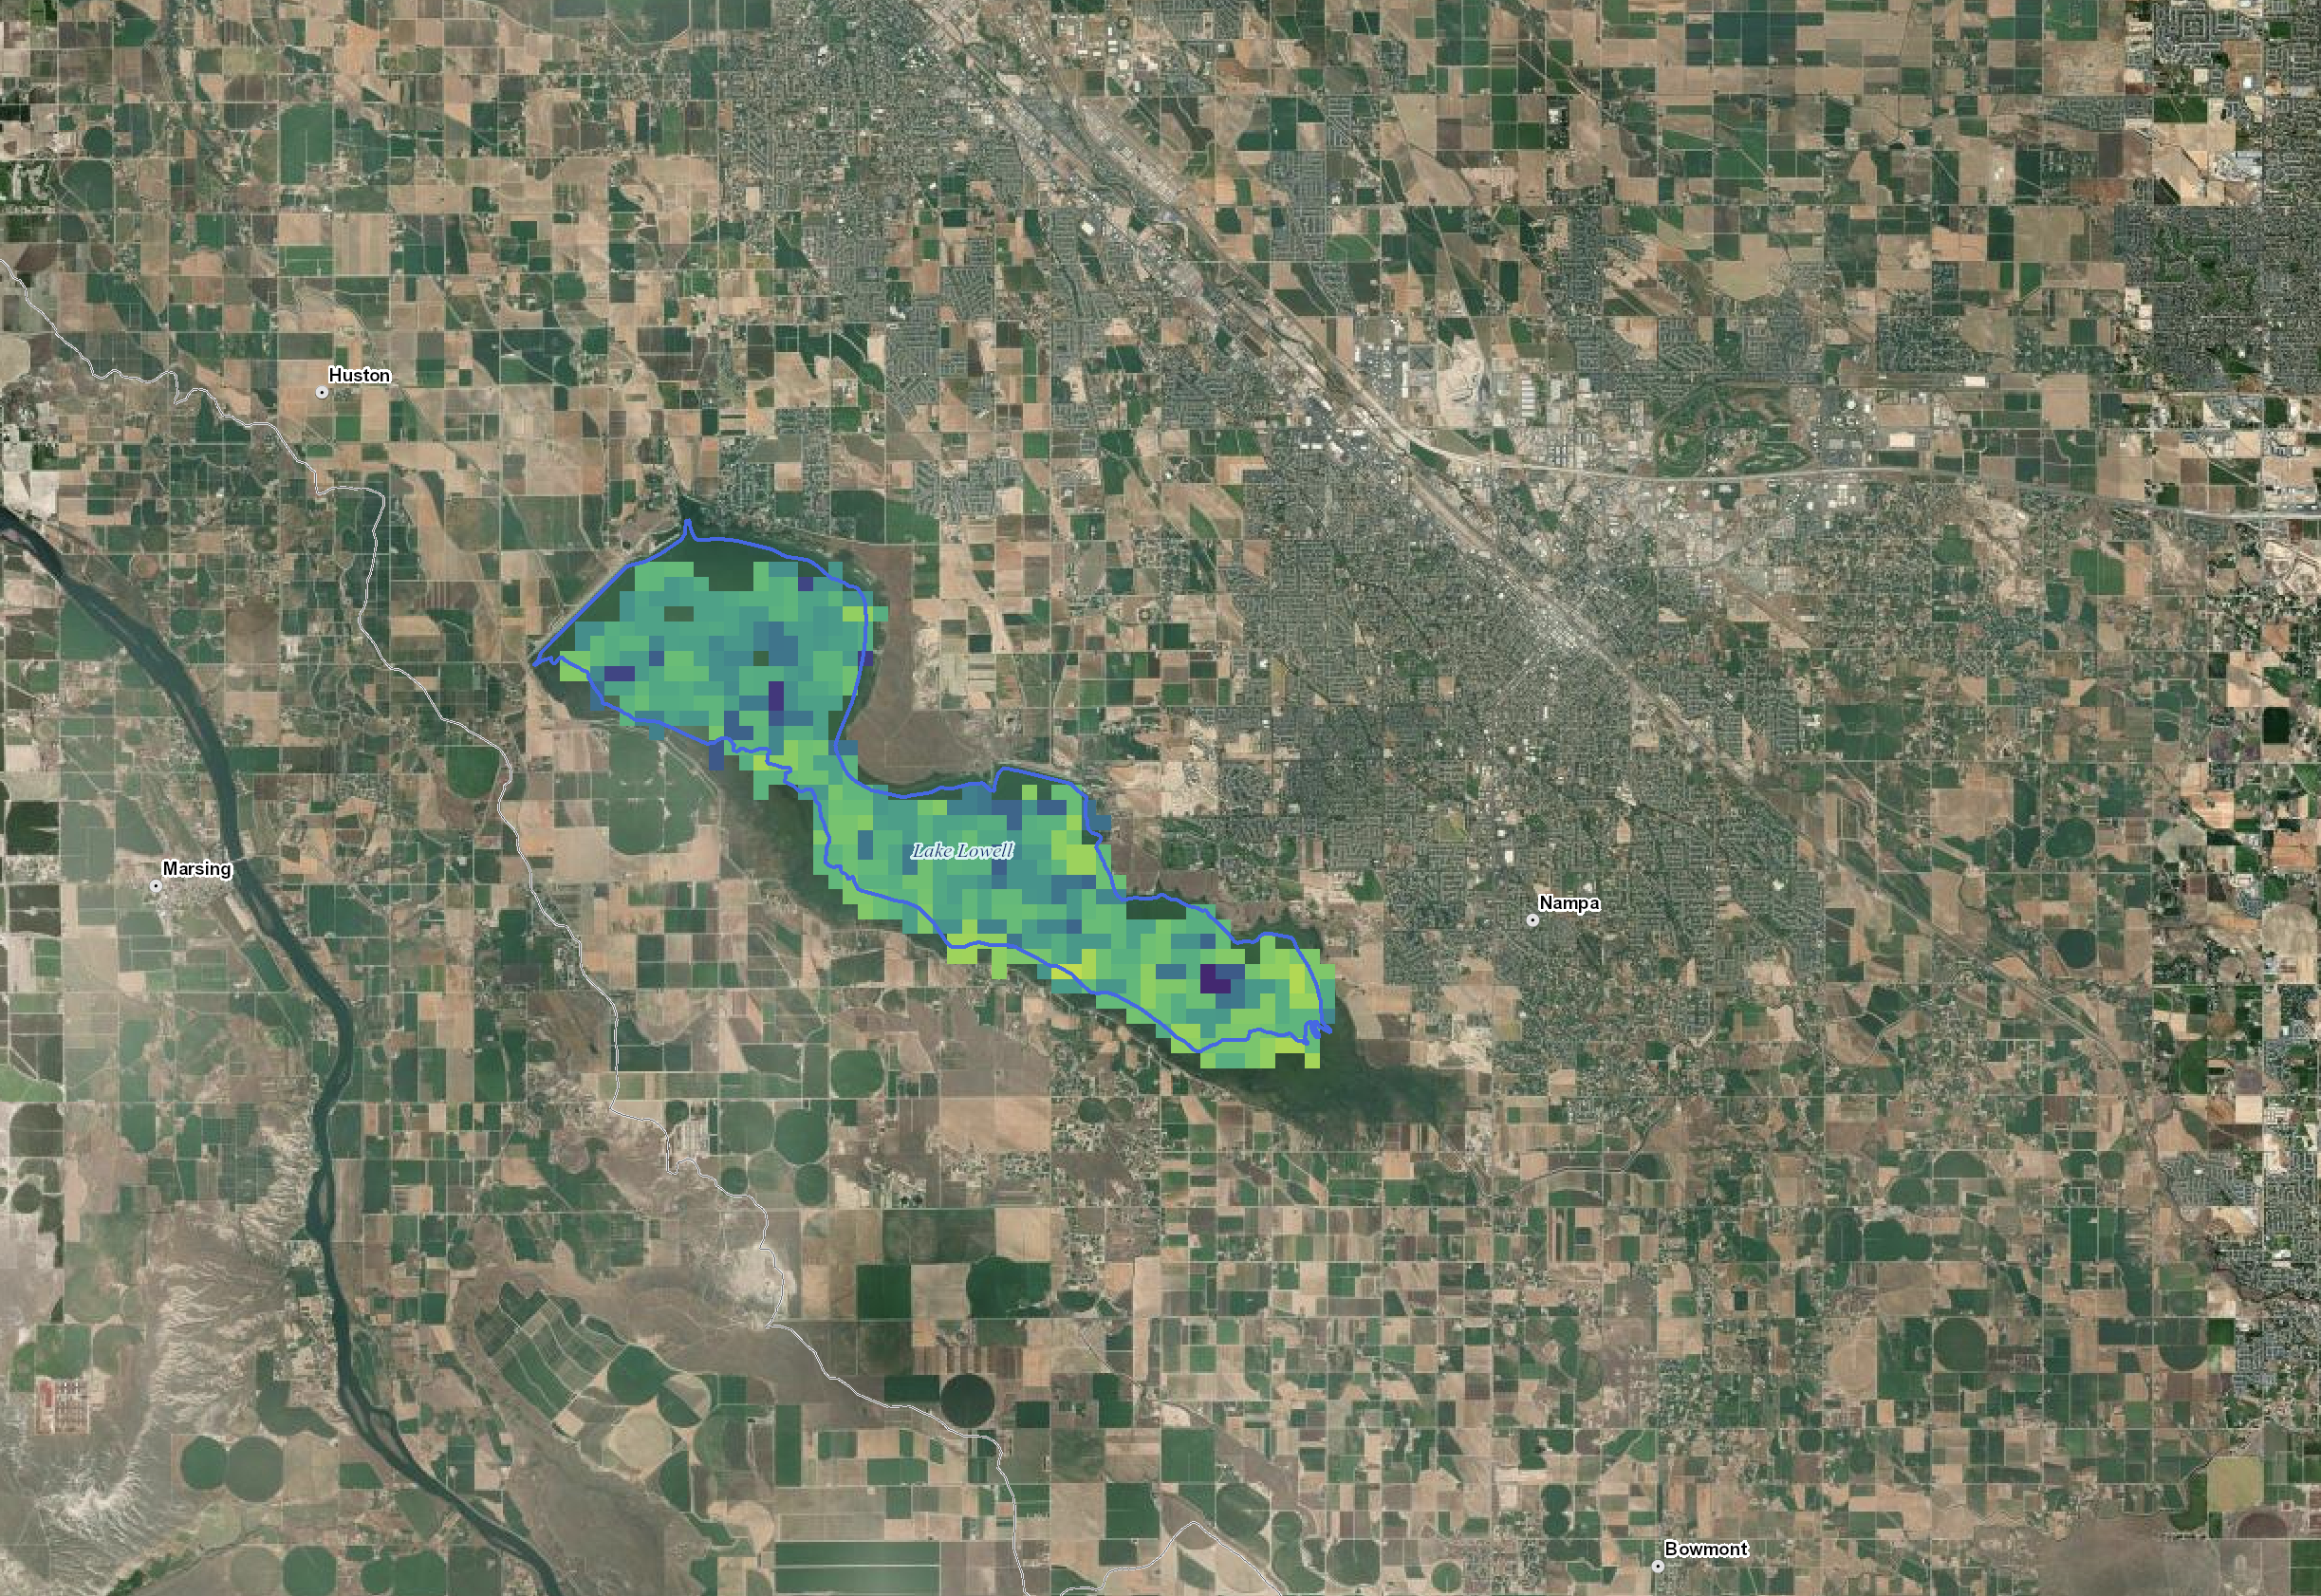
A now publicly available NASA dataset allows citizens and policymakers to get near-real time updates on the cyanobacteria in over 2,300 lakes in the contiguous United States and more than 5,000 in Alaska. The new study, published in the journal Remote Sensing of Environment, introduces this extensive inland waters dataset that includes a time series of standardized satellite measurements starting in 2002.
Scientists and state officials have already used the data to monitor and respond to early-stage algal blooms – a rapid increase in the population of algae in freshwater or marine water systems – but the dataset is now available to the general public and research community in the form of raw data, maps, and an index of cyanobacteria risk to human health. Having the raw data, in addition to cyanobacteria maps, will allow researchers, managers and community members to create and assess remote sensing tools for water quality. The data and products have been made available by the Cyanobacteria Assessment Network (CyAN), a joint project between NASA, the Environmental Protection Agency (EPA), the National Oceanic and Atmospheric Administration (NOAA) and the United States Geological Survey (USGS).
“This dataset allows us to transition from being reactive to proactive in managing water quality,” said Blake Schaeffer, one of the CyAN project leads and a research scientist at the EPA.
The inter-agency team created a standardized way to assess cyanobacteria concentration using satellite data and computer algorithms. Their Cyanobacteria Index is based on satellite data collected by the Medium Resolution Imaging Spectrometer (MERIS) instrument on the European Space Agency’s (ESA) Envisat satellite and the Ocean and Land Color Instrument (OLCI) on ESA’s Sentinel-3a and Sentinel-3b satellites, which measure at wavelengths suited to detect the pigments in cyanobacteria.
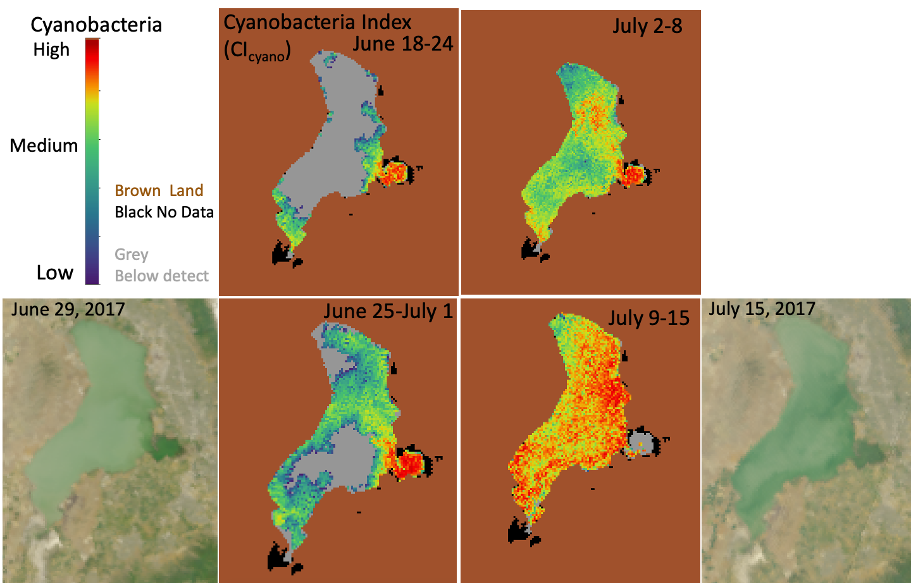
“What we measure with the satellites is different wavelengths – essentially color. The cyanobacteria that we’re measuring has a specific coloring that is a slightly different shade of green that distinguishes it from other algae” explained Bridget Seegers, one of the project leads for CyAN and a water quality researcher at NASA’s Goddard Space Flight Center in Greenbelt, Maryland. The team built and tested an algorithm that gives an assessment of cyanobacteria concentration based on the wavelength measurements from the satellites. The data is now publicly available in the form of Cyanobacteria Index maps and raw satellite data.
“This dataset is incredibly useful and right away we’re seeing the utility of it,” said Seegers.
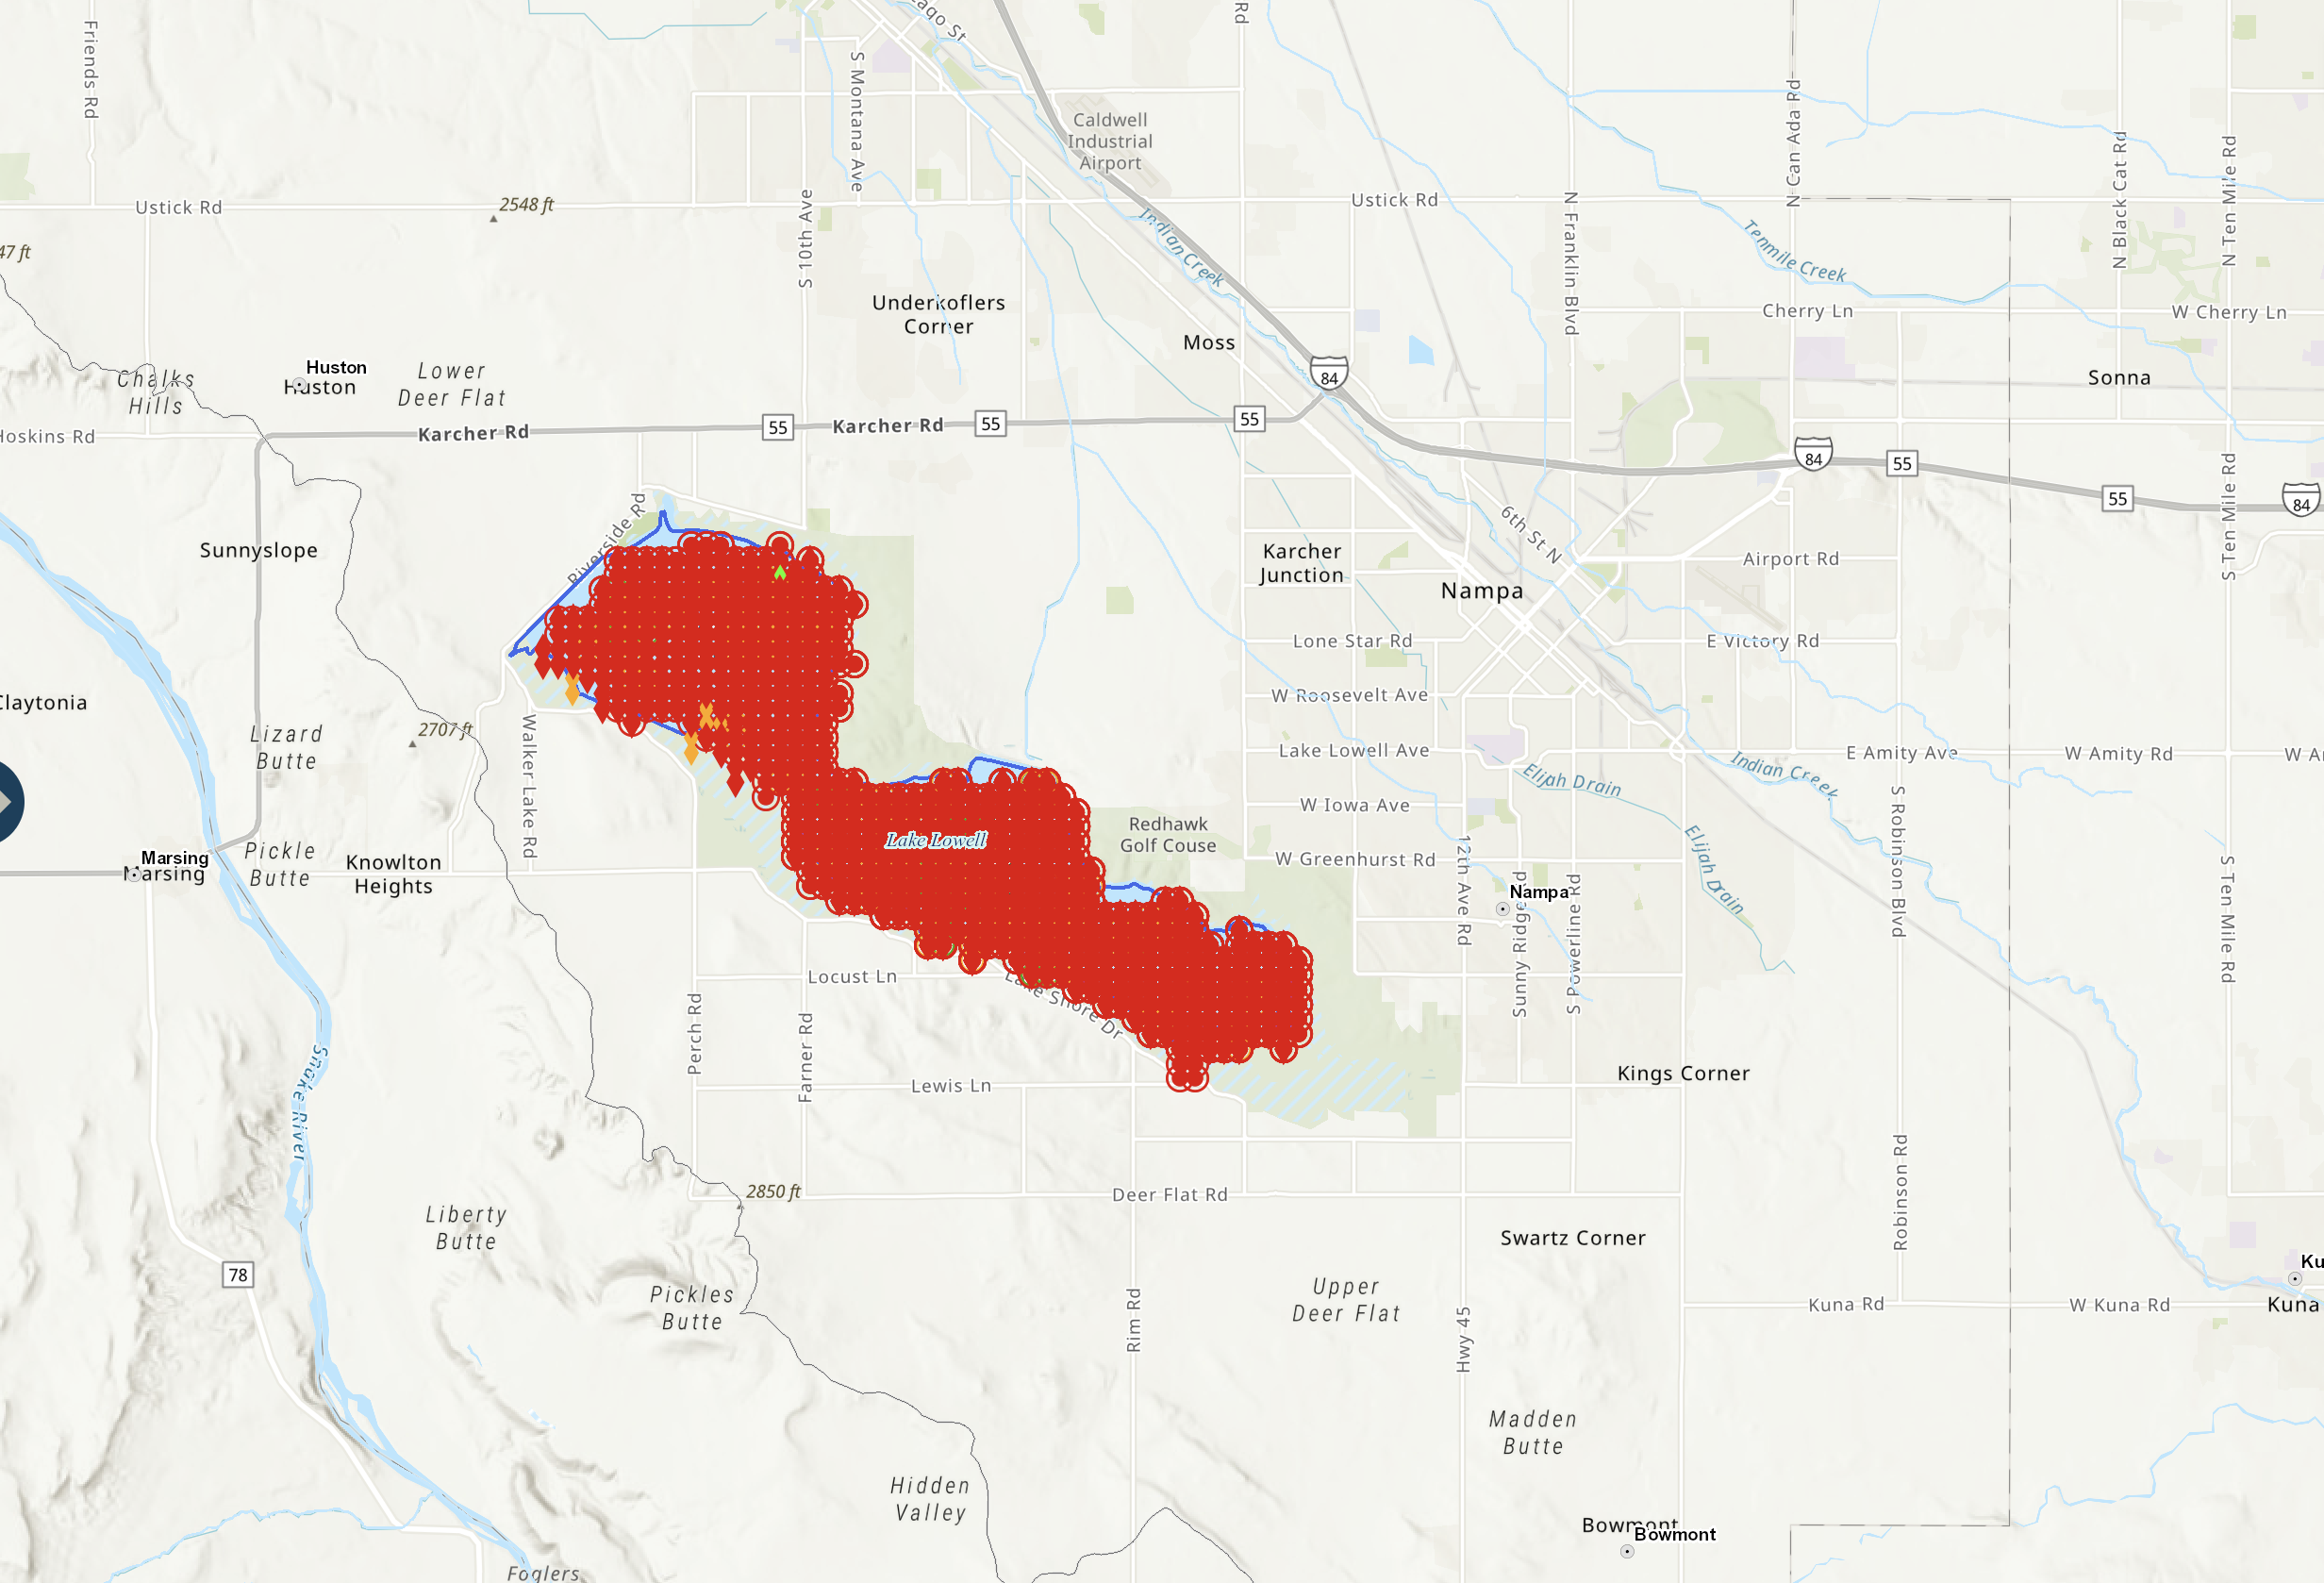
The satellite data helps state, tribal, and federal environmental officials know where to prioritize their sampling efforts. If the satellite data indicates an abundance of cyanobacteria in a particular lake, scientists can collect water samples from boats, kayaks or docks to verify that the bloom poses a threat to humans, wildlife and the environment.
“The satellite data allows people to monitor larger lakes and reservoirs in a way that we weren’t previously able to do. CyAN allows people to have a more systematic analysis of potential hotspots rather than relying on public notification,” said Keith Loftin, one of the CyAN leads and a United States Geological Survey (USGS) research chemist based in Kansas.
In 2017, Utah public health and environmental officials quickly responded to a budding bloom by putting up warning signs after satellite data showed high concentrations of cyanobacteria. Detecting the bloom early saved hundreds of thousands of dollars in healthcare, a study later estimated. Since then, several other states have adopted the Cyanobacteria Index to help monitor the status of their lakes as well.
The CyAN science team is excited that this standardized way of assessing cyanobacteria will enable scientists to compare blooms across the country and over time, said Schaeffer.
“We can provide information for specific lakes and now, for the first time, we can scale that out to a state or national level and start answering questions about the big picture of how harmful algal blooms are changing on a large scale,” said Schaeffer.
By Sofie Bates