


Since the COVID-19 pandemic began, space- and ground-based observations have shown that Earth’s atmosphere has seen significant reductions in some air pollutants. However, scientists wanted to know how much of that decline can be attributed to changes in human activity during pandemic-related shutdowns, versus how much would have occurred in a pandemic-free 2020.
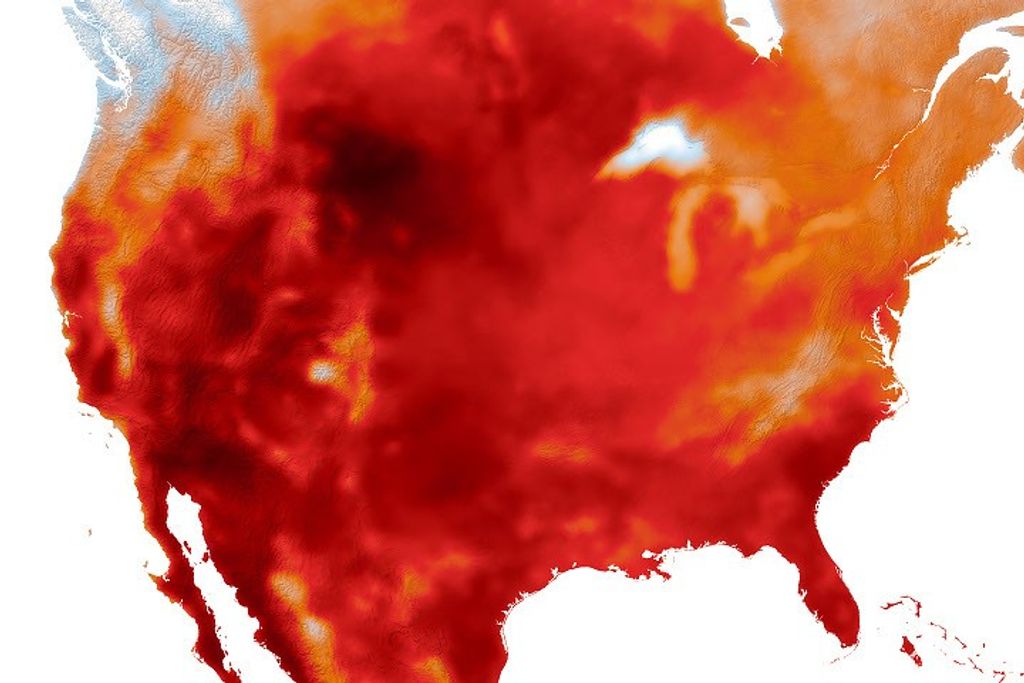
Using computer models to generate a COVID-free 2020 for comparison, NASA researchers found that since February, pandemic restrictions have reduced global nitrogen dioxide concentrations by nearly 20%. The results were presented at the 2020 International Conference for High Performance Computing, Networking, Storage, and Analysis.
Credits: NASA’s Goddard Space Flight Center
Nitrogen dioxide is an air pollutant that is primarily produced by the combustion of fossil fuels used by industry and transportation—both of which were significantly reduced during the height of the pandemic to prevent the novel coronavirus from spreading.
“We all knew the lockdowns were going to have an impact on air quality,” said lead author Christoph Keller with Universities Space Research Association (USRA) at NASA’s Goddard Space Flight Center in Greenbelt, Maryland. Keller works in Goddard’s Global Modeling and Assimilation Office (GMAO), which uses high-tech computer models to help track the chemistry of the ocean and the atmosphere, and forecast future climate scenarios. He says, “it was also soon clear that it was going to be difficult to quantify how much of that change is related to the lockdown measures, versus general seasonality or variability in pollution.”
No two years are exactly alike. Normal variations in weather and atmospheric circulation change the make-up and chemistry of Earth’s atmosphere. Comparing 2020 nitrogen dioxide concentrations with data from 2019 or 2018 alone would not account for year-to-year differences. But, because the NASA model projections account for these natural variations, scientists can use them to parse how much of the 2020 atmospheric composition change was caused by the COVID-19 containment measures.
Even with models, there was no predicting the sudden, drastic shifts in human behavior as the novel coronavirus—and the regulations attempting to control it—spread rapidly. Instead of trying to re-program their model with this unexpected event, Keller and his colleagues accounted for COVID-19 by having the model ignore the pandemic altogether.
The model simulation and machine learning analysis took place at the NASA Center for Climate Simulation. Its “business as usual” scenario showed an alternate reality version of 2020—one that did not experience any unexpected changes in human behavior brought on by the pandemic.
From there it is simple subtraction. The difference between the model simulated values and the measured ground observations represents the change in emissions due to the pandemic response. The researchers received data from 46 countries—a total of 5,756 observation sites on the ground—relaying hourly atmospheric composition measurements in near-real time. On a city-level, 50 of the 61 analyzed cities show nitrogen dioxide reductions between 20-50%.
“In some ways I was surprised by how much it dropped,” said Keller. “Many countries have already done a very good job in lowering their nitrogen dioxide concentrations over the last decades due to clean air regulations, but what our results clearly show is that there is still asignificant human behavior-driven contribution.”
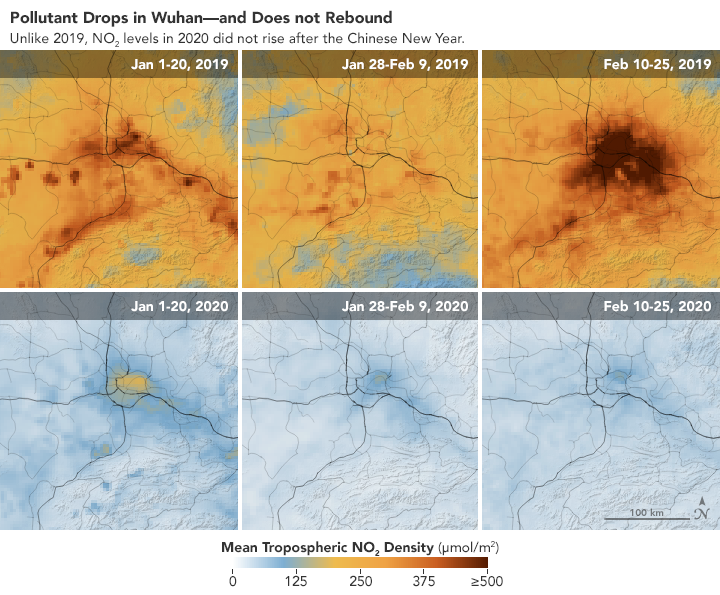
Wuhan, China was the first municipality reporting an outbreak of COVID-19. It was also the first to show reduced nitrogen dioxide emissions—60% lower than simulated values expected. A 60% decrease in Milan and a 45% decrease in New York followed shortly, as their local restrictions went into effect.
“You could, at times, even see the decrease in nitrogen dioxide before the official policies went into place,” said co-author Emma Knowland with USRA at Goddard’s GMAO. “People were probably reducing their transit because the talk of the COVID-19 threat was already happening before we were actually told to shut down.” Once restrictions were eased, the decreases in nitrogen dioxide lessened, but remained below expected “business as usual” values.
Keller compared his estimates of the nitrogen dioxide decreases to reported economic numbers, namely, the gross domestic products, of the nations included in the study. According to Keller, they lined up shockingly well. “We would expect them to be somewhat related because nitrogen dioxide is so closely linked to economic activities, like people who travel and factories running,” he said. “It looks like our data captures this very well.”
The research is ongoing, and the GEOS model data used in this study are publicly available.
More information about GEOS can be found at:
https://gmao.gsfc.nasa.gov/GEOS/
Download this video in HD formats from NASA Goddard’s Scientific Visualization Studio
Read more from Earth Observatory
By Lara Streiff
NASA’s Earth Science News Team