


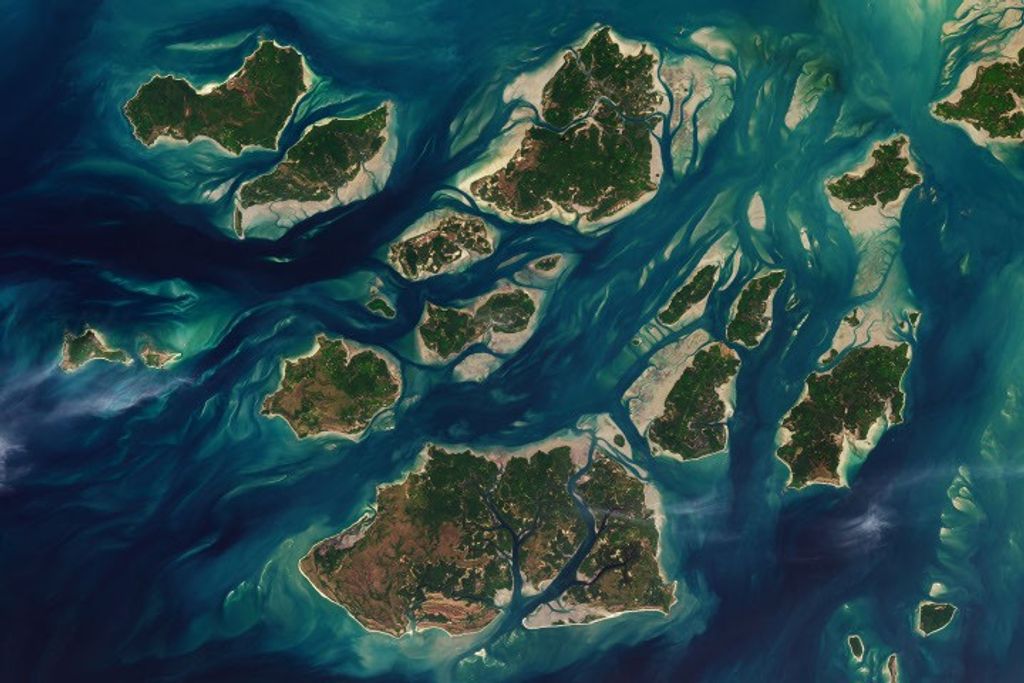


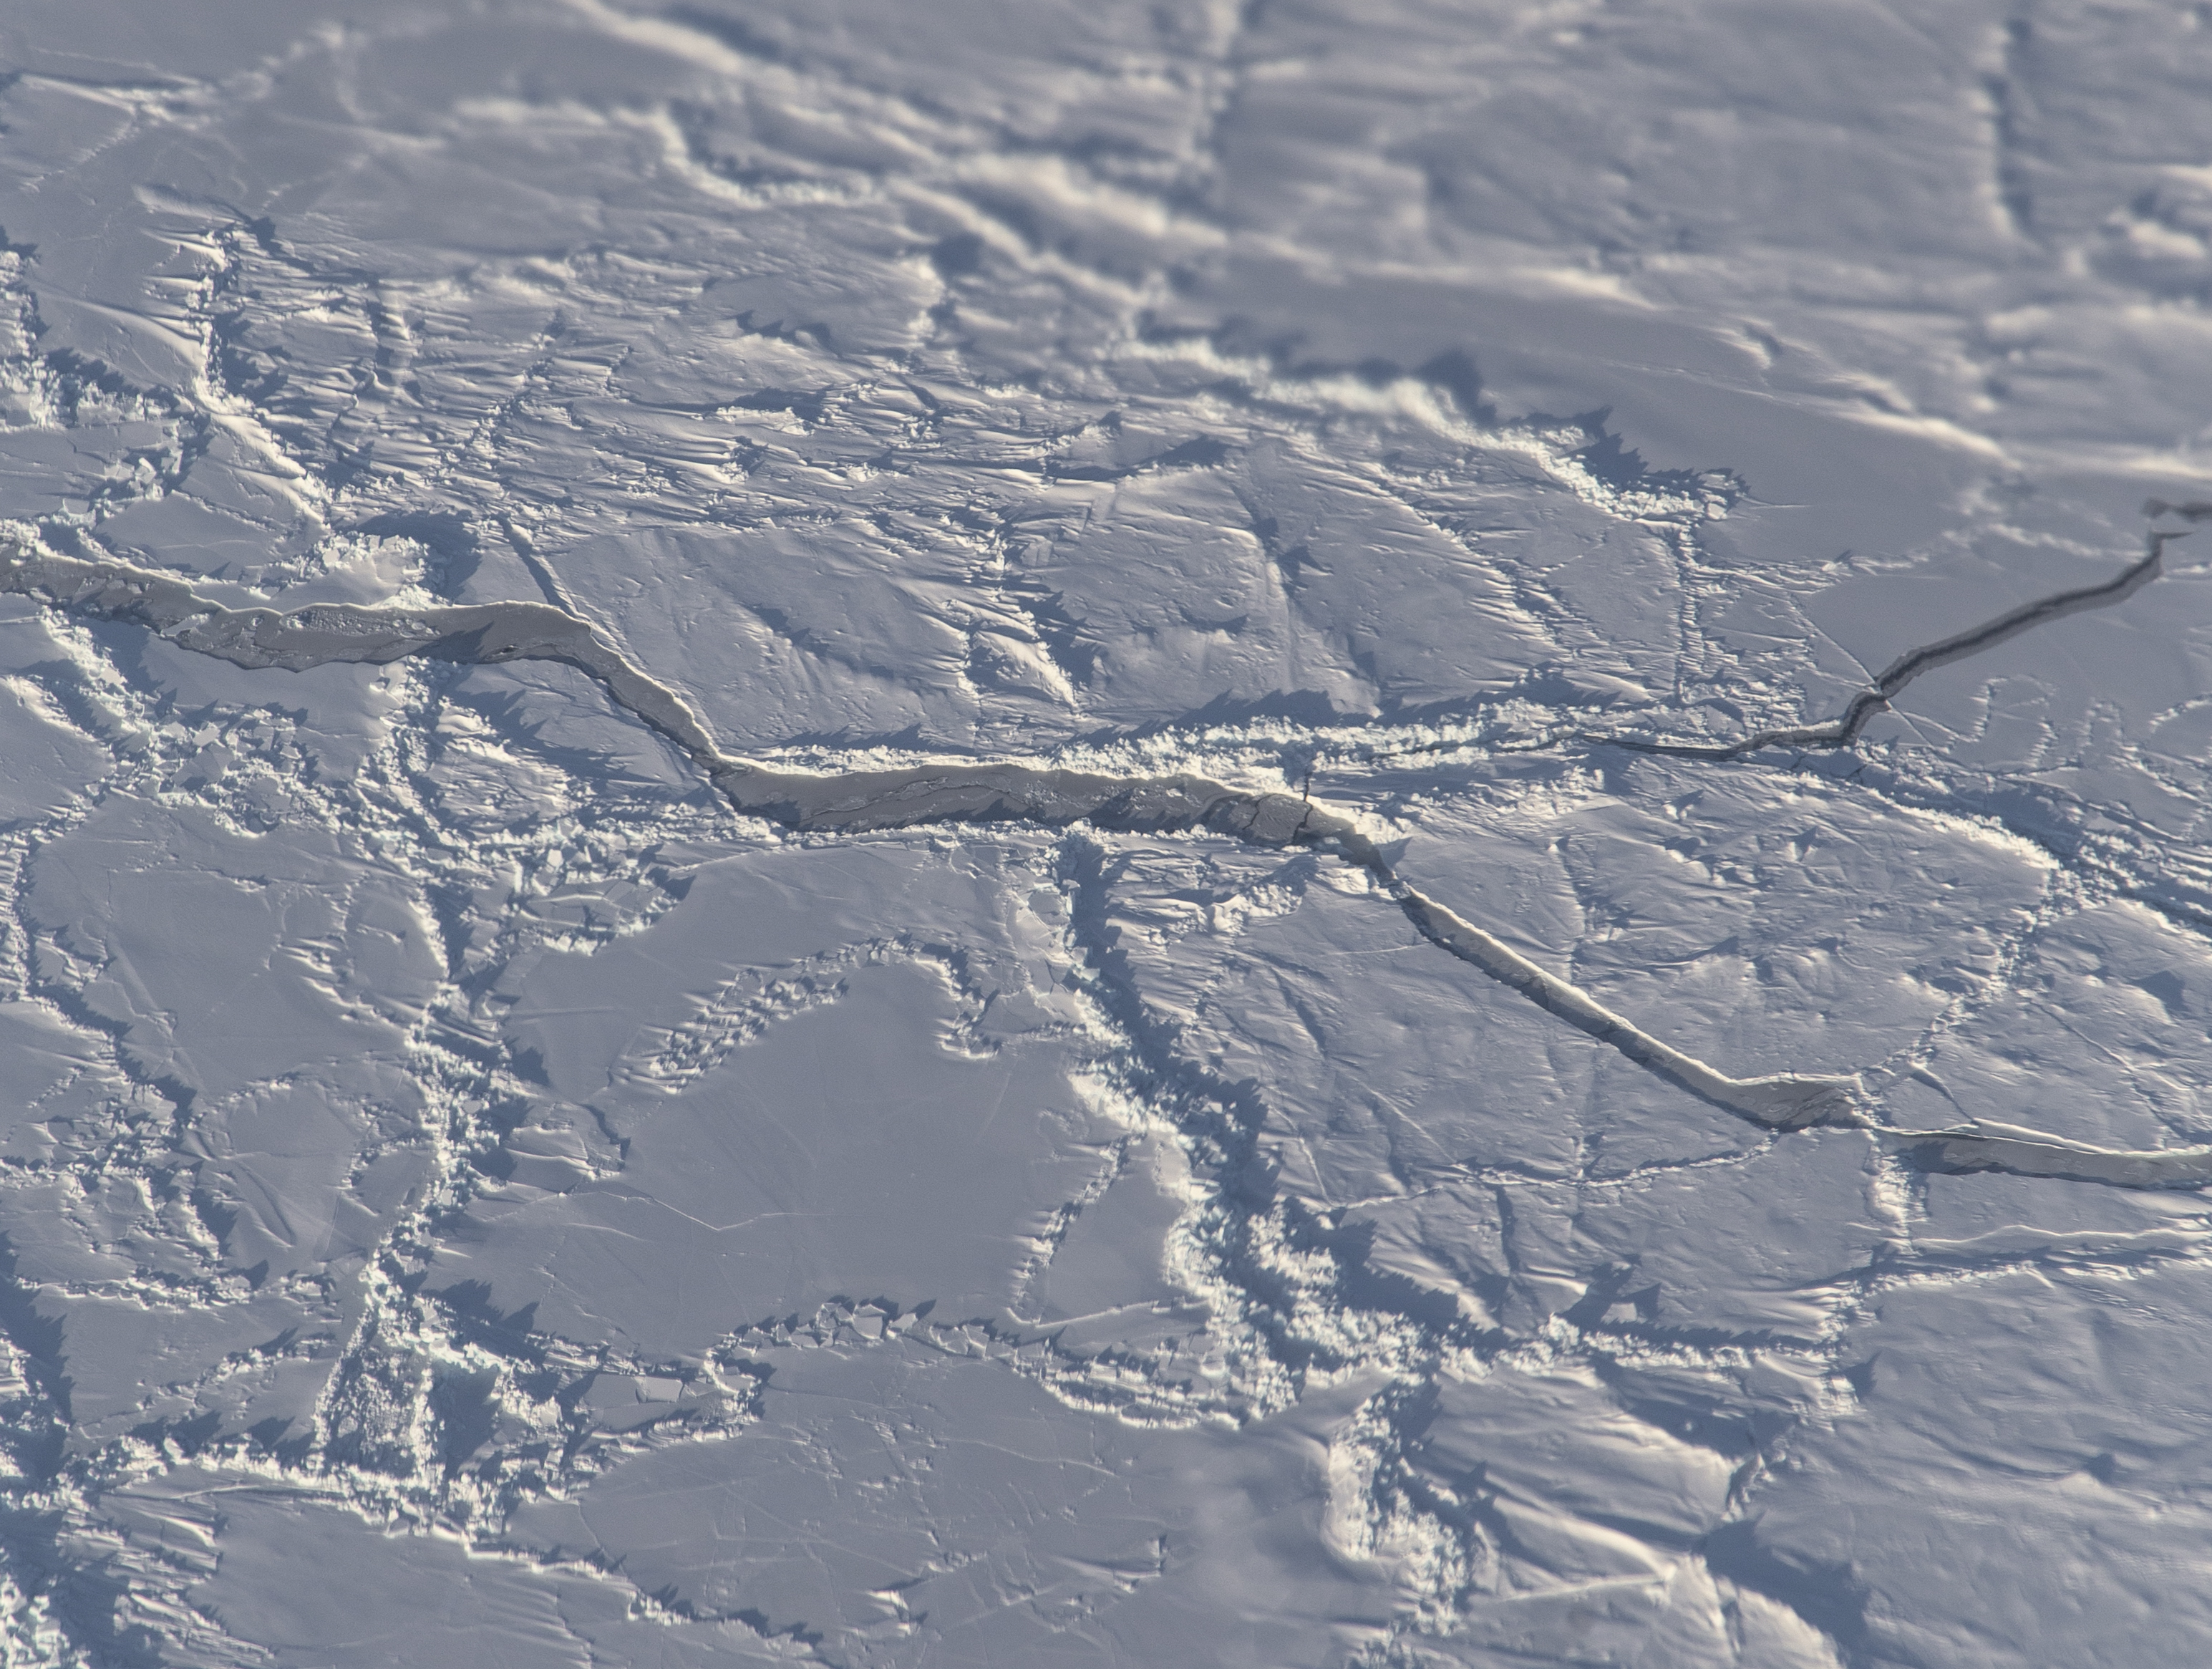
Arctic sea ice helps keep Earth cool, as its bright surface reflects the Sun’s energy back into space. Each year scientists use multiple satellites and data sets to track how much of the Arctic Ocean is covered in sea ice, but its thickness is harder to gauge. Initial results from NASA’s new Ice Cloud and land Elevation Satellite-2 (ICESat-2) suggest that the sea ice has thinned by as much as 20% since the end of the first ICESat mission (2003-2009), contrary to existing studies that find sea ice thickness has remained relatively constant in the last decade.
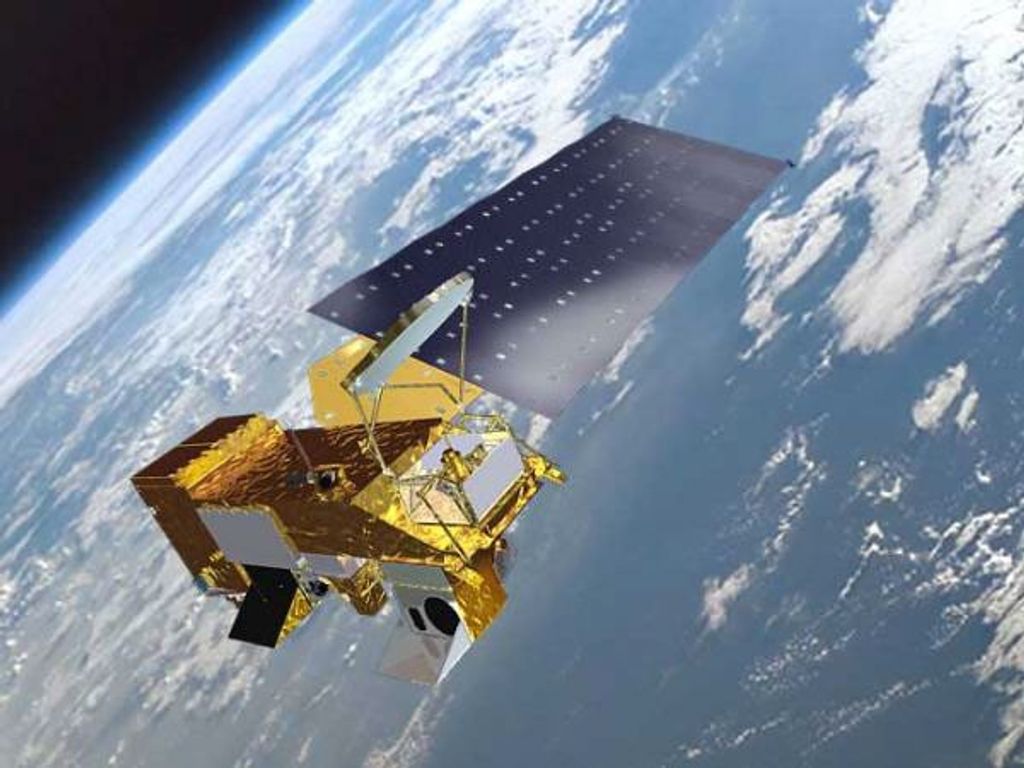
ICESat-2 has a laser altimeter, which uses pulses of light to precisely measure height down to about an inch. Each second, the instrument sends out 10,000 pulses of light that bounce off the surface of Earth and return to the satellite and records the length of time it takes to make that round trip. The light reflects off the first substance it hits, whether that’s open water, bare sea ice or snow that has accumulated on top of the ice, so scientists use a combination of ICESat-2 measurements and other data to calculate sea ice thickness.
By comparing ICESat-2 data with measurements from another satellite, researchers have also created the first satellite-based maps of the amount of snow that has accumulated on top of Arctic sea ice, tracking this insulating material.
“The Arctic sea ice pack has changed dramatically since monitoring from satellites began more than four decades ago,” said Nathan Kurtz, ICESat-2 deputy project scientist at NASA’s Goddard Space Flight Center in Greenbelt, Maryland. “The extraordinary accuracy and year-round measurement capability of ICESat-2 provides an exciting new tool to allow us to better understand the mechanisms leading to these changes, and what this means for the future.”
Arctic sea ice thickness dropped drastically in the first decade of the 21st Century, as measured by the first ICESat mission from 2003 to 2009 and other methods. The European Space Agency’s CryoSat-2, launched in 2010, has measured a relatively consistent thickness in Arctic sea ice since then. With the launch of ICESat-2 in 2018, researchers looked to this new way of measuring sea ice thickness to advance the study of this data record.
“We can’t get thickness just from ICESat-2 itself, but we can use other data to derive the measurement,” said Alek Petty, a sea ice scientist at NASA Goddard. For example, the researchers subtract out the height of snow on top of the sea ice by using computer models that estimate snowfall. “The first results were very encouraging.”
In their study, published recently in the Journal of Geophysical Research: Oceans, Petty and his colleagues generated maps of Arctic sea ice thickness from October 2018 to April 2019 and saw the ice thickening through the winter as expected.
Overall, however, calculations using ICESat-2 found that the ice was thinner during that time period than what researchers have found using CryoSat-2 data. Petty’s group also found that small but significant 20% decline in sea ice thickness by comparing February/March 2019 ICESat-2 measurements with those calculated using ICESat in February/March 2008 – a decline that the CryoSat-2 researchers don’t see in their data.
These are two very different approaches to measuring sea ice, Petty said, each with its own limitations and benefits. CryoSat-2 carries a radar to measure height, as opposed to ICESat-2’s lidar, and radar mostly passes through snow to measure the top of the ice. Radar measurements like the ones from CryoSat-2 could be thrown off by seawater flooding the ice, he noted. In addition, ICESat-2 is still a young mission and the computer algorithms are still being refined, he said, which could ultimately change the thickness findings.
“I think we’re going to learn a lot from having these two approaches to measuring ice thickness. They might be giving us an upper and lower bound on the sea ice thickness, and the right answer is probably somewhere in between,” Petty said. “There are reasons why ICESat-2 estimates could be low, and reasons why CryoSat-2 could be high, and we need to do more work to understand and bring these measurements in line with each other.”
Credits: NASA’s Scientific Visualization Studio
Measuring Sea Ice Thickness with ICESat-2
With ICESat-2 and CryoSat-2 using two different methods to measure ice thickness – one measuring the top of the snow, the other the boundary between the bottom of the snow layer and the top of the ice layer – but researchers realized they could combine the two to calculate the snow depth.
“This is the first time ever that we can get snow depth across the entire Arctic Ocean’s sea ice cover,” said Ron Kwok, a sea ice scientist at NASA’s Jet Propulsion Laboratory in Southern California and author of another study in JGR Oceans. “The Arctic region is a desert – but what snow we do get is very important in terms of the climate and insulating sea ice.”
The study found that snow starts building up slowly in October, when newly formed ice has an average of about 2 inches (5 centimeters) of snow on it and multiyear ice has an average of 5.5 inches (14 cm) of snow. Snowfall picks up later in the winter in December and January and reaches its maximum depth in April, when the relatively new ice has an average of 6.7 inches (17 cm) and the older ice has an average of 10.6 inches (27 cm) of snow.
When the snow melts in the spring, it can pool up on the sea ice – those melt ponds absorb heat from the Sun and can warm up the ice faster, just one of the impacts of snow on ice.
For more information on ICESat-2, visit www.nasa.gov/icesat-2 or icesat-2.gsfc.nasa.gov
NASA’s Goddard Space Flight Center, Greenbelt, Maryland