


Satellite Spots Remnants of Ex-Tropical Cyclone Celia
Tropical Cyclone Celia weakened to a remnant low pressure area. NOAA’s GOES-West satellite provided an infrared look at the clouds associated with the low.
GOES-West captured an infrared image of Celia’s remnant clouds at 1500 UTC (11 a.m. EDT). The image showed an open circulation with the bulk of clouds to the northeast of the low-level center. NOAA manages the GOES series of satellites, and the NASA/NOAA GOES Project at NASA’s Goddard Space Flight Center in Greenbelt, Maryland uses the data to create images and animations.
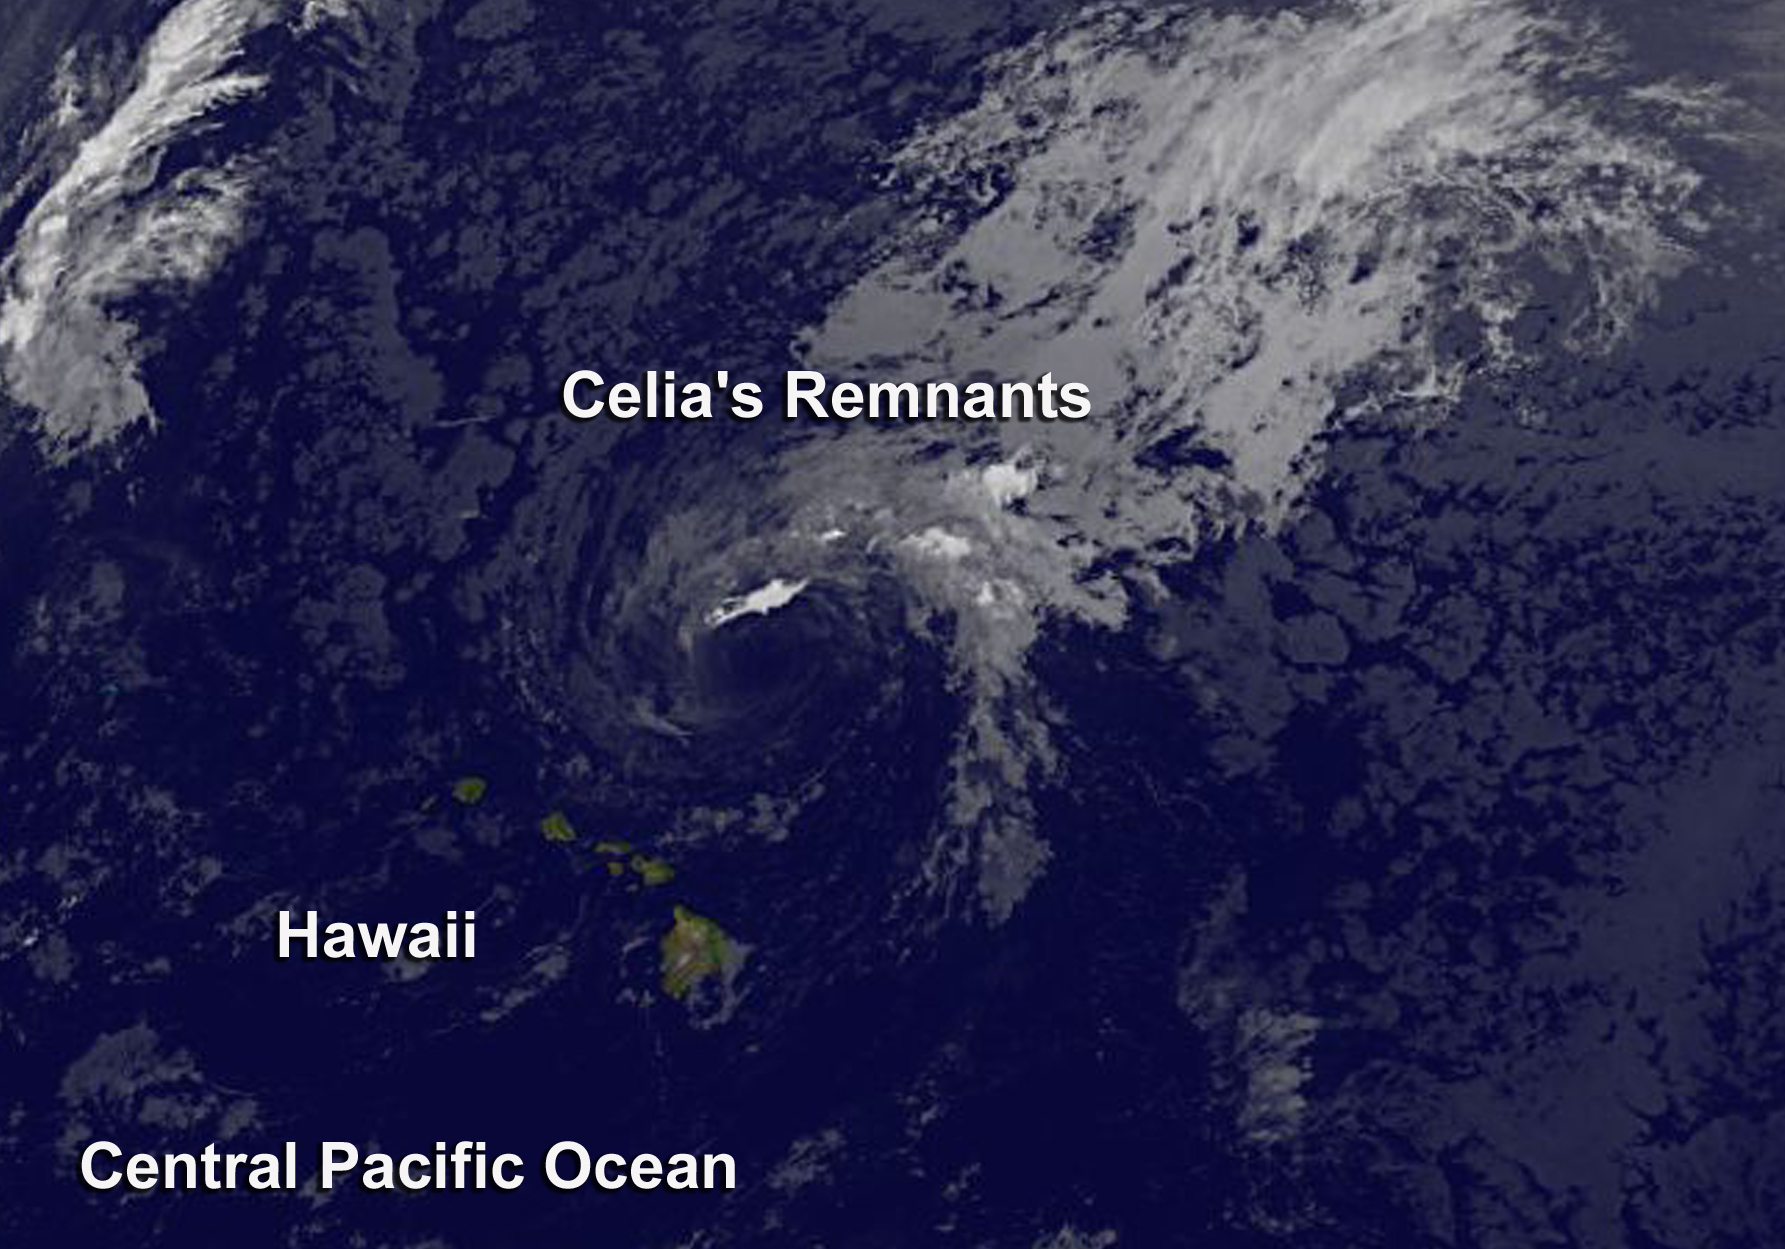
OAA’s Central Pacific Hurricane Center said that a surface low, the remnant of ex-Tropical Cyclone Celia, was centered about 300 miles northeast of Honolulu on July 18 at 1:50 a.m. HST (7:50 a.m. EDT). The remnant low pressure area was moving to the west at 10 mph.
Atmospheric conditions are not conducive for tropical cyclone redevelopment. The chance for development is near zero over the next two days.
Rob Gutro
NASA’s Goddard Space Flight Center
July 18, 2016 – NASA Satellites See Weaker Tropical Storm Celia Move into Central Pacific
Tropical Storm Celia has crossed 140 degrees west longitude line, which means the storm has moved from the Eastern into the Central Pacific Ocean. Infrared imagery from NASA’s Aqua satellite showed Celia had lost most of its punch.
Enhanced infrared imagery from the MODIS instrument that flies aboard NASA’s Aqua satellite on July 14 at 22:15 UTC (6:15 p.m. EDT) and microwave imagery showed all that remains of Celia’s thunderstorms was a fragmented curved band storms about 60 nautical miles north-northeast of the exposed circulation center.
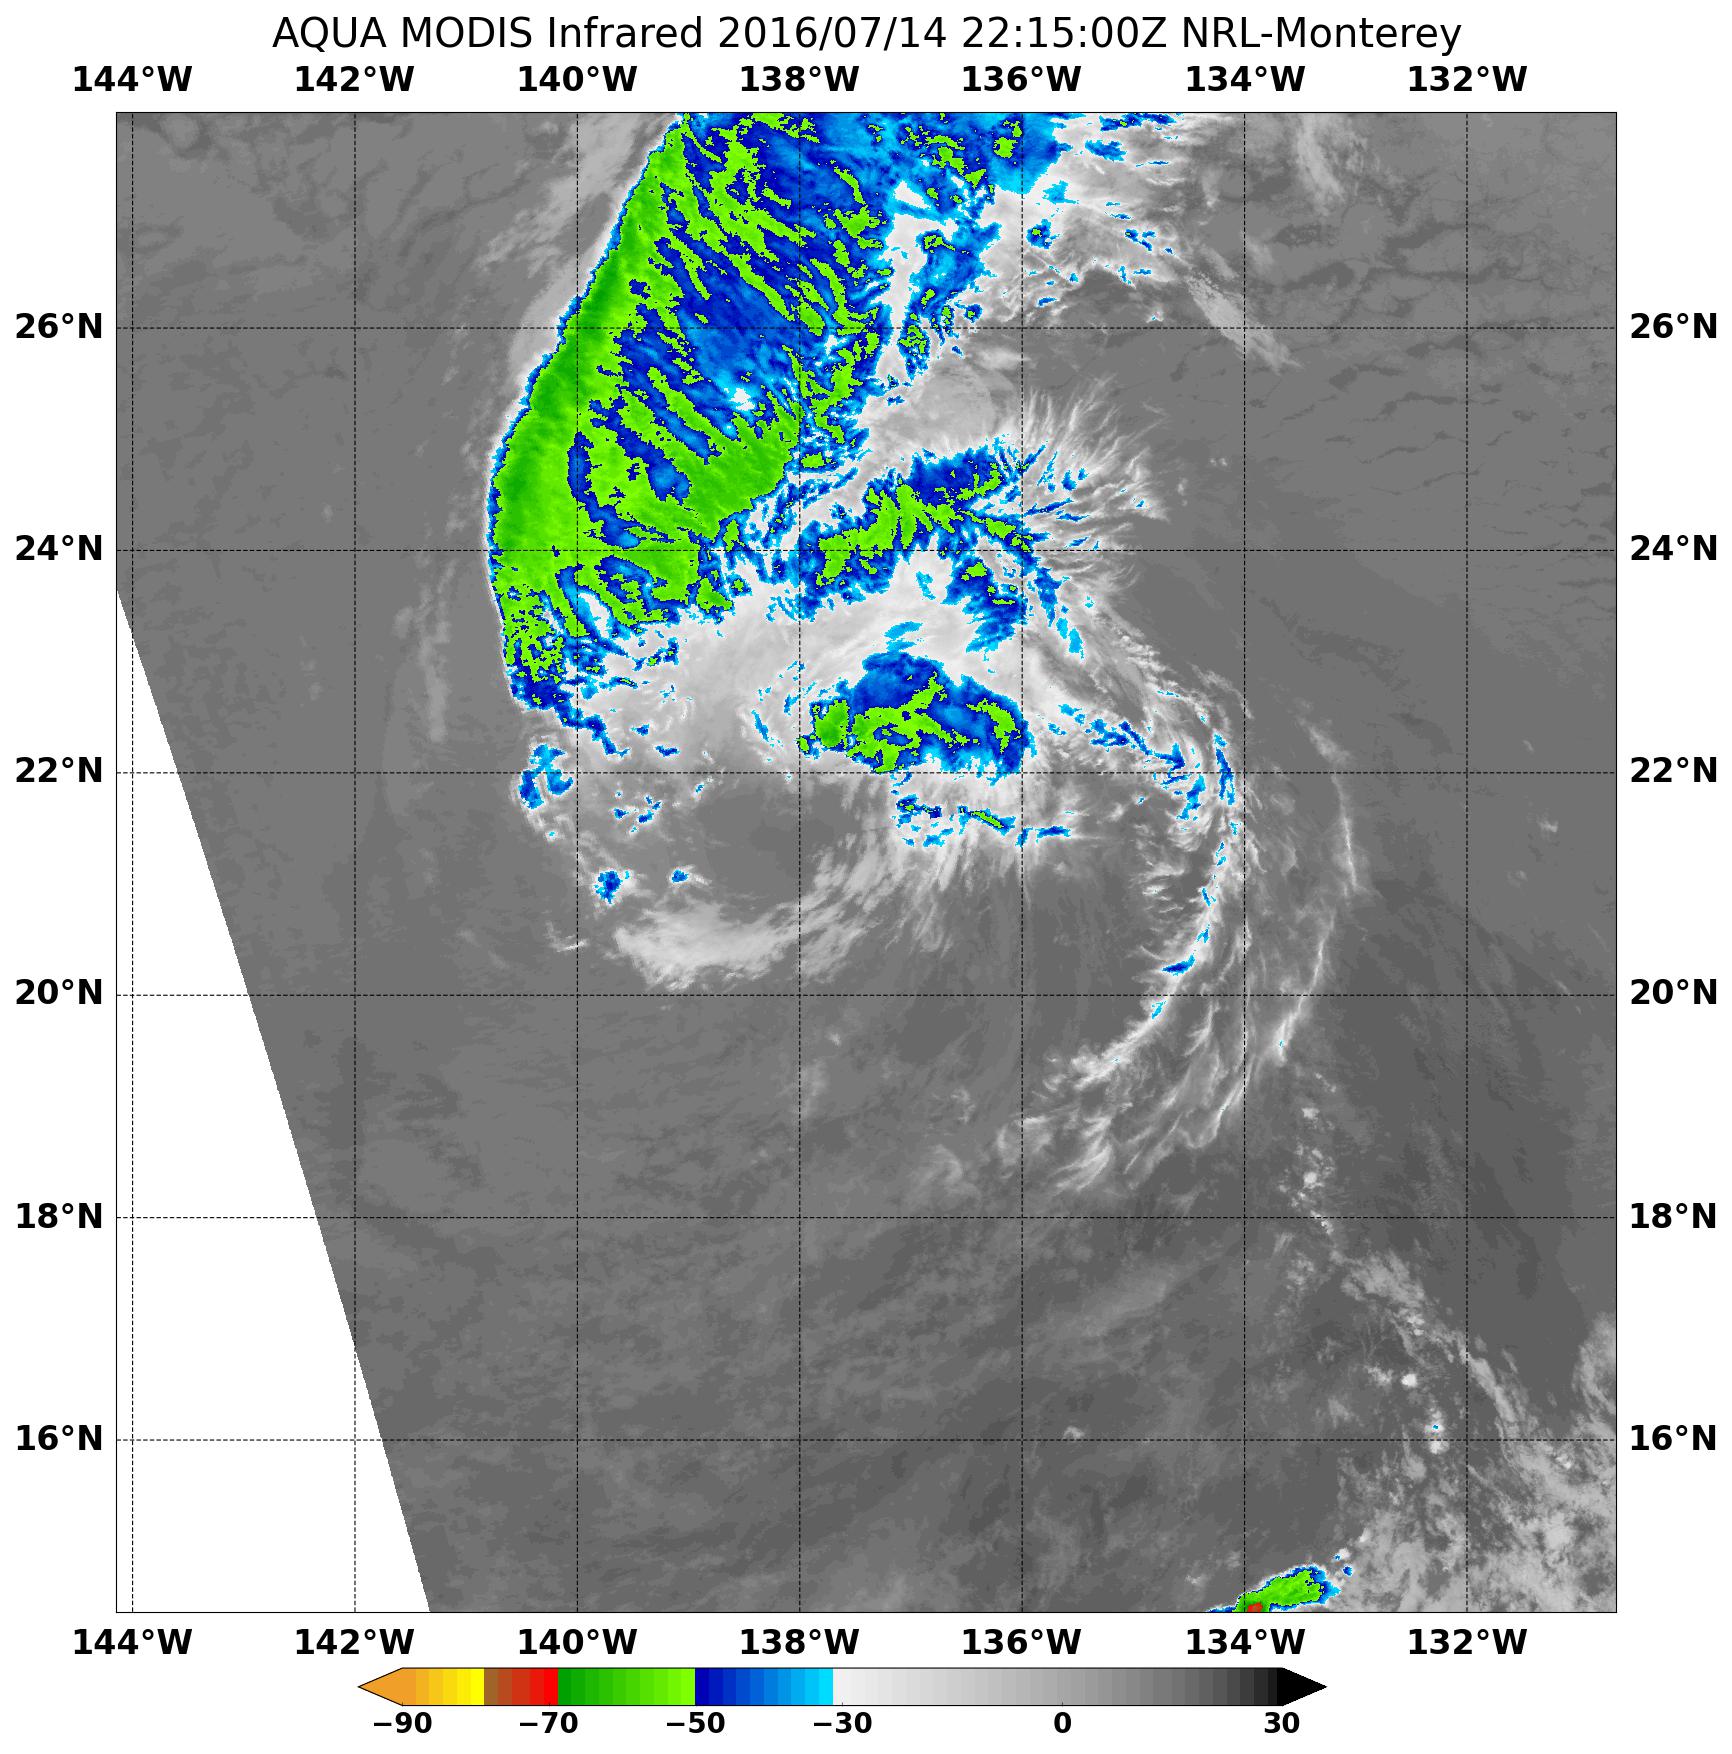
As of July 14, NOAA’s Central Pacific Hurricane Center (CPHC) was issuing advisories on Celia. At 5 a.m. EDT (0900 UTC), the center of Tropical Storm Celia was located near 22.0 degrees north latitude and 140.2 degrees west longitude. That’s about 975 miles (1,570 km) east-northeast of Hilo, Hawaii. Maximum sustained winds have decreased to near 45 mph (75 kph).
Celia is moving toward the west-northwest near 13 mph (20 kph). The system is expected to turn toward the west at about the same forward speed later today and continue in this general motion during the next couple of days.
NOAA’s CPHC said that Celia should continue to gradually spin down, due to the sea surface temperatures below 24 degrees Celsius and the surrounding stable air mass, and become a post-tropical cyclone by tonight. Tropical cyclones need sea surface temperatures of at least 26 degrees Celsius (80 degrees Fahrenheit) to maintain intensity.
NOAA’s Central Pacific Hurricane Center noted that Celia will likely become a post-tropical cyclone today and a remnant low on Saturday.
Rob Gutro
NASA’s Goddard Space Flight Center
July 14, 2016 – NASA Finds Wind Shear Affecting Tropical Storm Celia
Tropical Storm Celia continues to weaken in the Eastern Pacific Ocean and NASA data showed that the strongest winds and storms were pushed north of the center of the storm.
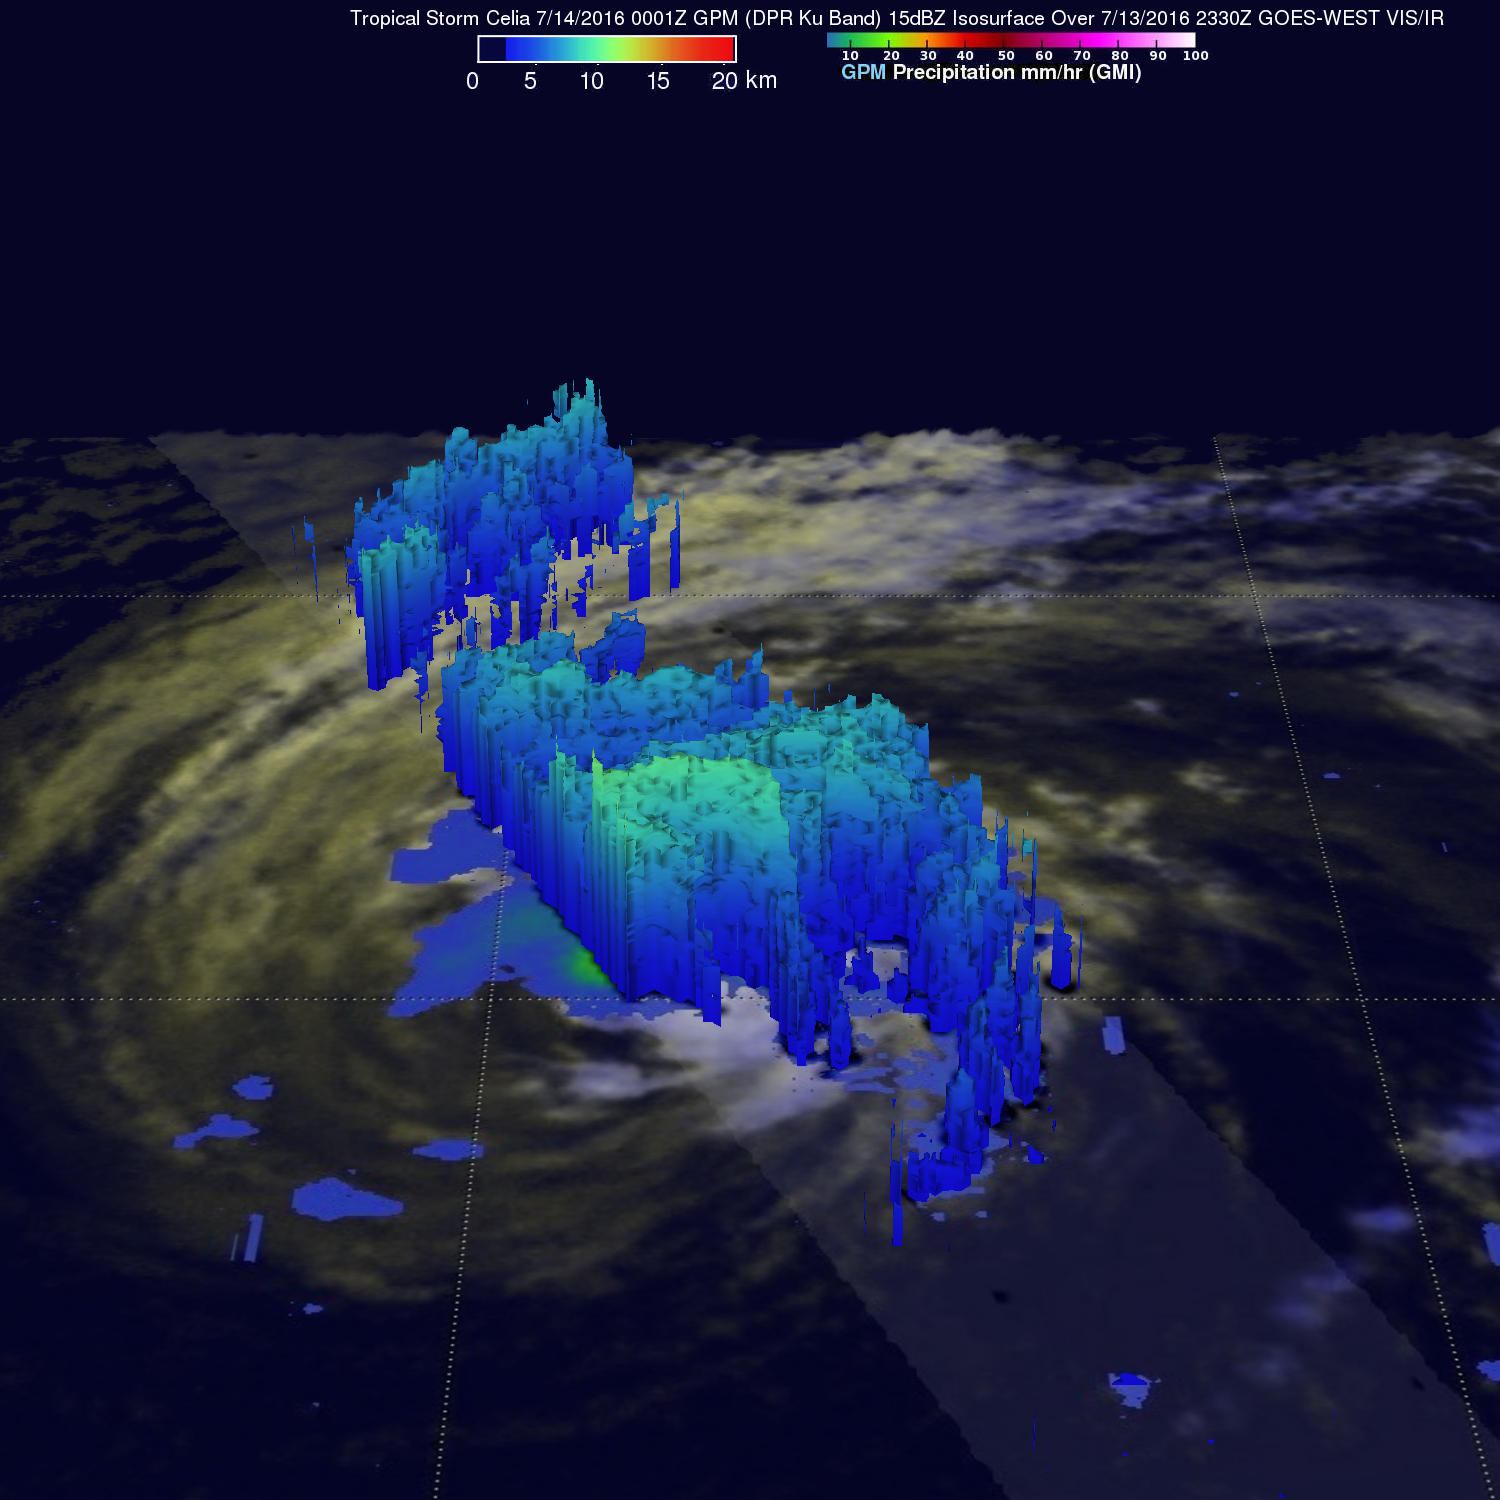
Hurricane Celia had weakened to a tropical storm with winds of about 45 knots (52 mph) when the Global Precipitation Measurement or GPM core observatory satellite flew over on July 14, 2016 at 0001 UTC (July 13 at 8:01 p.m. EDT). GPM found that convective storms were mainly located to the north and northeast of the Celia’s center of circulation. GPM’s Microwave Imager (GMI) and Dual-Frequency Precipitation Radar (DPR) found that rain was falling at over 164 mm (6.4 inches) per hour within the small area of a feeder band spiraling into the northeastern side of the center of circulation.
Credits: NASA/JAXA/SSAI, Hal Pierce
With this orbit GPM’s radar (DPR Ku Band) made 3-D measurements of Celia’s cloud tops and found that they were mainly shallow. A few cloud tops in the most powerful storms were measured by DPR reaching altitudes of over 11 km (6.8 miles).
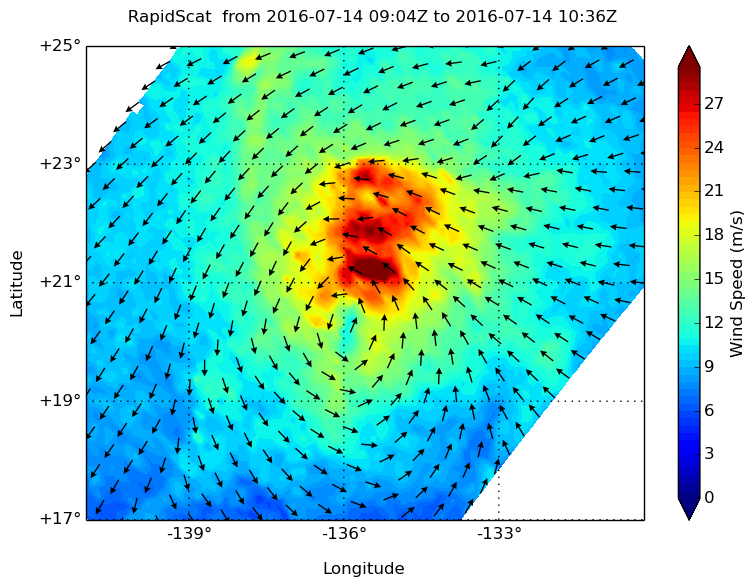
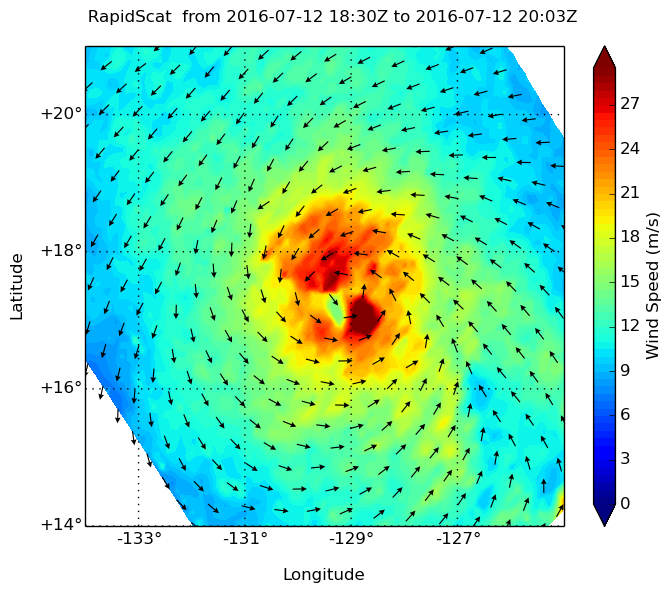
NASA’s RapidScat instrument measured the surface winds around Tropical Storm Celia on July 11 between 0900 and 1000 UTC (5 and 6 a.m. EDT) and found the strongest winds north of the center of circulation near 30 meters per second (67 mph/108 kph).
The RapidScat instrument that flies aboard the International Space Station measures Earth’s ocean surface wind speed and direction over open waters. Surface wind speed is always lower than speeds at higher altitude. RapidScat is an important tool for meteorologists, because it shows forecasters the location of the strongest winds in different quadrants of an area of low pressure or tropical cyclone as they are not always equally distributed.
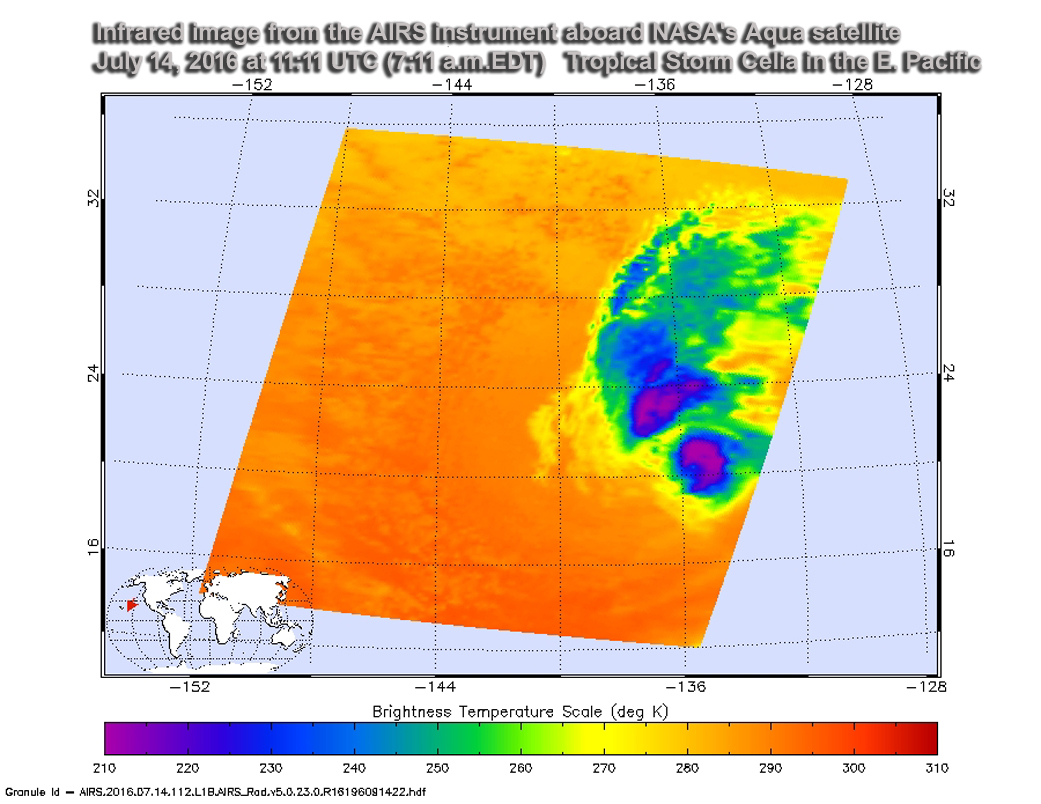
On July 14 at 11:11 UTC (7:11 a.m. EDT) the Atmospheric Infrared Sounder or AIRS instrument aboard NASA’s Aqua satellite showed that Celia continued to maintain a small area of deep convection and coldest cloud top temperatures north of the center of circulation. The National Hurricane Center noted that “the area of cold cloud tops has become separated from the low-level center due to some southwesterly (wind) shear.” Those cloud top temperatures are as cold as minus 63 Fahrenheit/minus 53 Celsius.
At 11 a.m. EDT (1500 UTC) on July 13 the center of Tropical Storm Celia was located near 20.8 north latitude and 136.7 west longitude. That’s about 1,195 miles (1,920 km) east of Hilo, Hawaii. Celia is moving toward the west-northwest near 12 mph (19 kph) and the National Hurricane Center said that a turn toward the west is expected on Friday. Maximum sustained winds are near 50 mph (85 km/h) with higher gusts. Weakening is forecast, and Celia is likely to become a tropical depression early Friday, and degenerate into a remnant low by Friday night. July 15. The estimated minimum central pressure is 1000 millibars.
The National Hurricane Center said Celia is forecast to become a post-tropical cyclone in 24 to 36 hours. After that time, the cyclone will be moving over slightly warmer sea surface temperatures but moderate to strong westerly shear should prevent regeneration.
Once Celia passes west of 140W, warnings on this system will be issued by NOAA’s Central Pacific Hurricane Center. Celia is expected to pass north of Hawaii and may bring rain to the northern islands on July 18 and 19.
Rob Gutro
NASA’s Goddard Space Flight Center
July 13, 2016 – NASA Looks into Tropical Cyclone Celia’s Winds and Rainfall Rates
Tropical Cyclone Celia continued to generate heavy rains as it moved through the Eastern Pacific Ocean. NASA’s RapidScat analyzed surface wind speeds while the GPM core satellite measured rainfall rates occurring within the storm.
RapidScat is a scatterometer instrument that flies aboard the International Space Station. It measures surface wind speeds and direction over open waters of oceans On July 12 RapidScat saw strongest sustained surface winds (red) occurring east of the center of Hurricane Celia. Those winds were in excess of 30 meters per second (67.1 mph/108 kph). Images from RapidScat data are made into images at NASA’s Jet Propulsion Laboratory in Pasadena, California where the mission is managed.
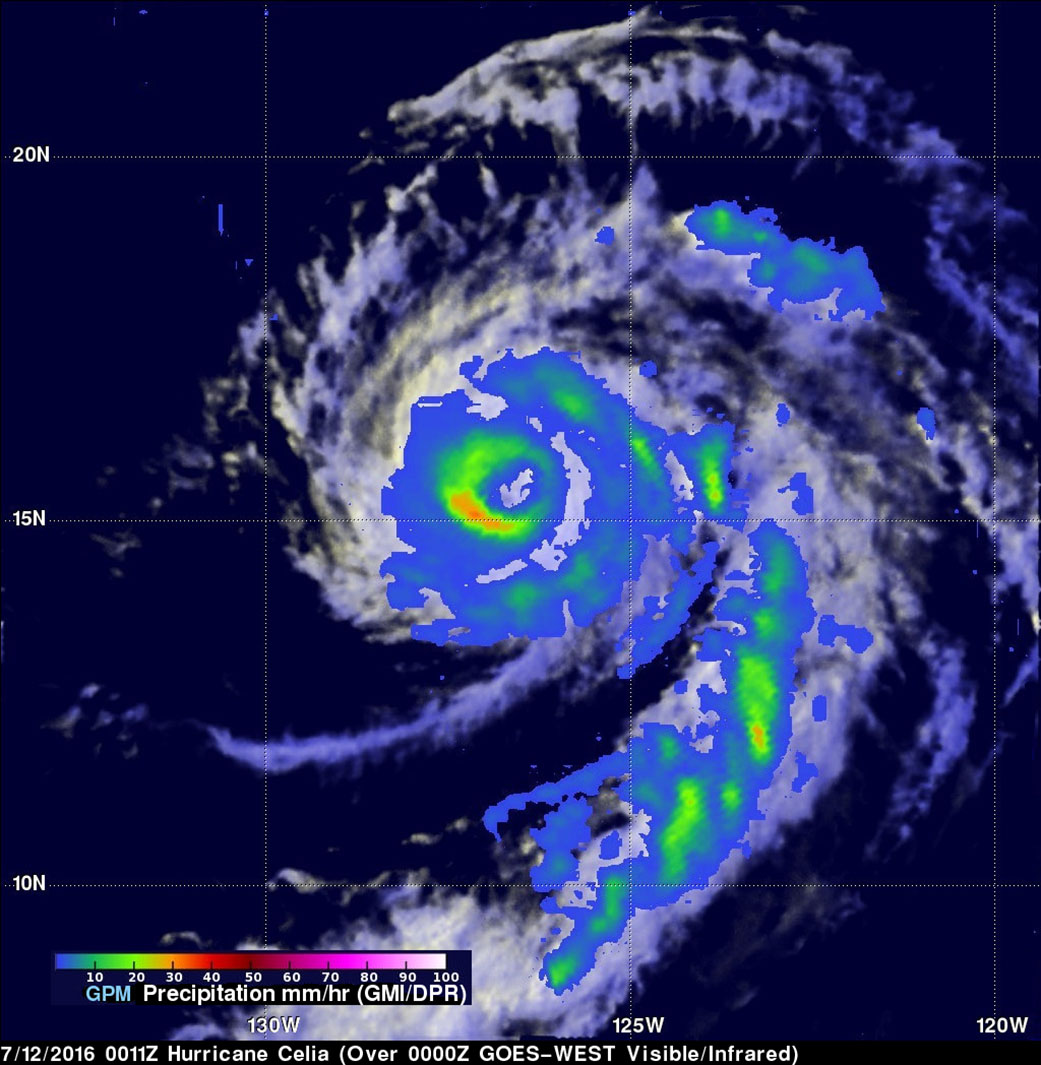
The Global Precipitation Measurement (GPM) core observatory satellite twice flew almost directly above hurricane Celia in the eastern Pacific Ocean on July 12, 2016. The first time was on July 12, 2016 at 0011 UTC (July 11 at 8:11 p.m. EDT) and the second view was on July 12, 2016 at 1326 UTC (9:26 a.m. EDT). With both passes GPM’s Microwave Imager (GMI) clearly showed the location of rainfall around hurricane Celia’s well defined eye. The hurricane had maintained intensity during this period with sustained maximum wind speeds estimated at 80 knots (92.8 mph). With the first pass GMI measured rain in the southwestern side of Celia’s eye wall falling at a rate of close to 33 mm (1.3 inches) per hour. GPM is a joint mission between NASA and the Japanese space agency JAXA.
On July 13 at 5 a.m. EDT (0900 UTC) Celia weakened to a tropical storm. It was centered about 1,410 miles (2,270 km) west of the southern tip of Baja California. Celia was located near latitude 18.3 north and longitude 131.2 west. Celia was moving toward the west-northwest near 12 mph (19 kph) and this general motion is expected to continue for the next couple of days. Maximum sustained winds have decreased to near 70 mph (110 kph) with higher gusts. Additional weakening is forecast during the next 48 hours. The estimated minimum central pressure is 987 millibars.
Celia is moving in the general direction of the Hawaiian Islands but is predicted to weaken to tropical depression intensity in a few days as it moves into the central Pacific.
Rob Gutro / Hal Pierce
NASA’s Goddard Space Flight Center
July 12, 2016 – NASA Sees Hurricane Celia Headed for Central Pacific
The Suomi NPP and Aqua satellites captured visible and infrared data on Hurricane Celia as it continues to head west toward the Central Pacific Ocean.
Hurricane Celia is currently in the Eastern Pacific Ocean, but once it passes west of 140 degrees west longitude, warnings on the system will be issued by NOAA’s Central Pacific Hurricane Center.
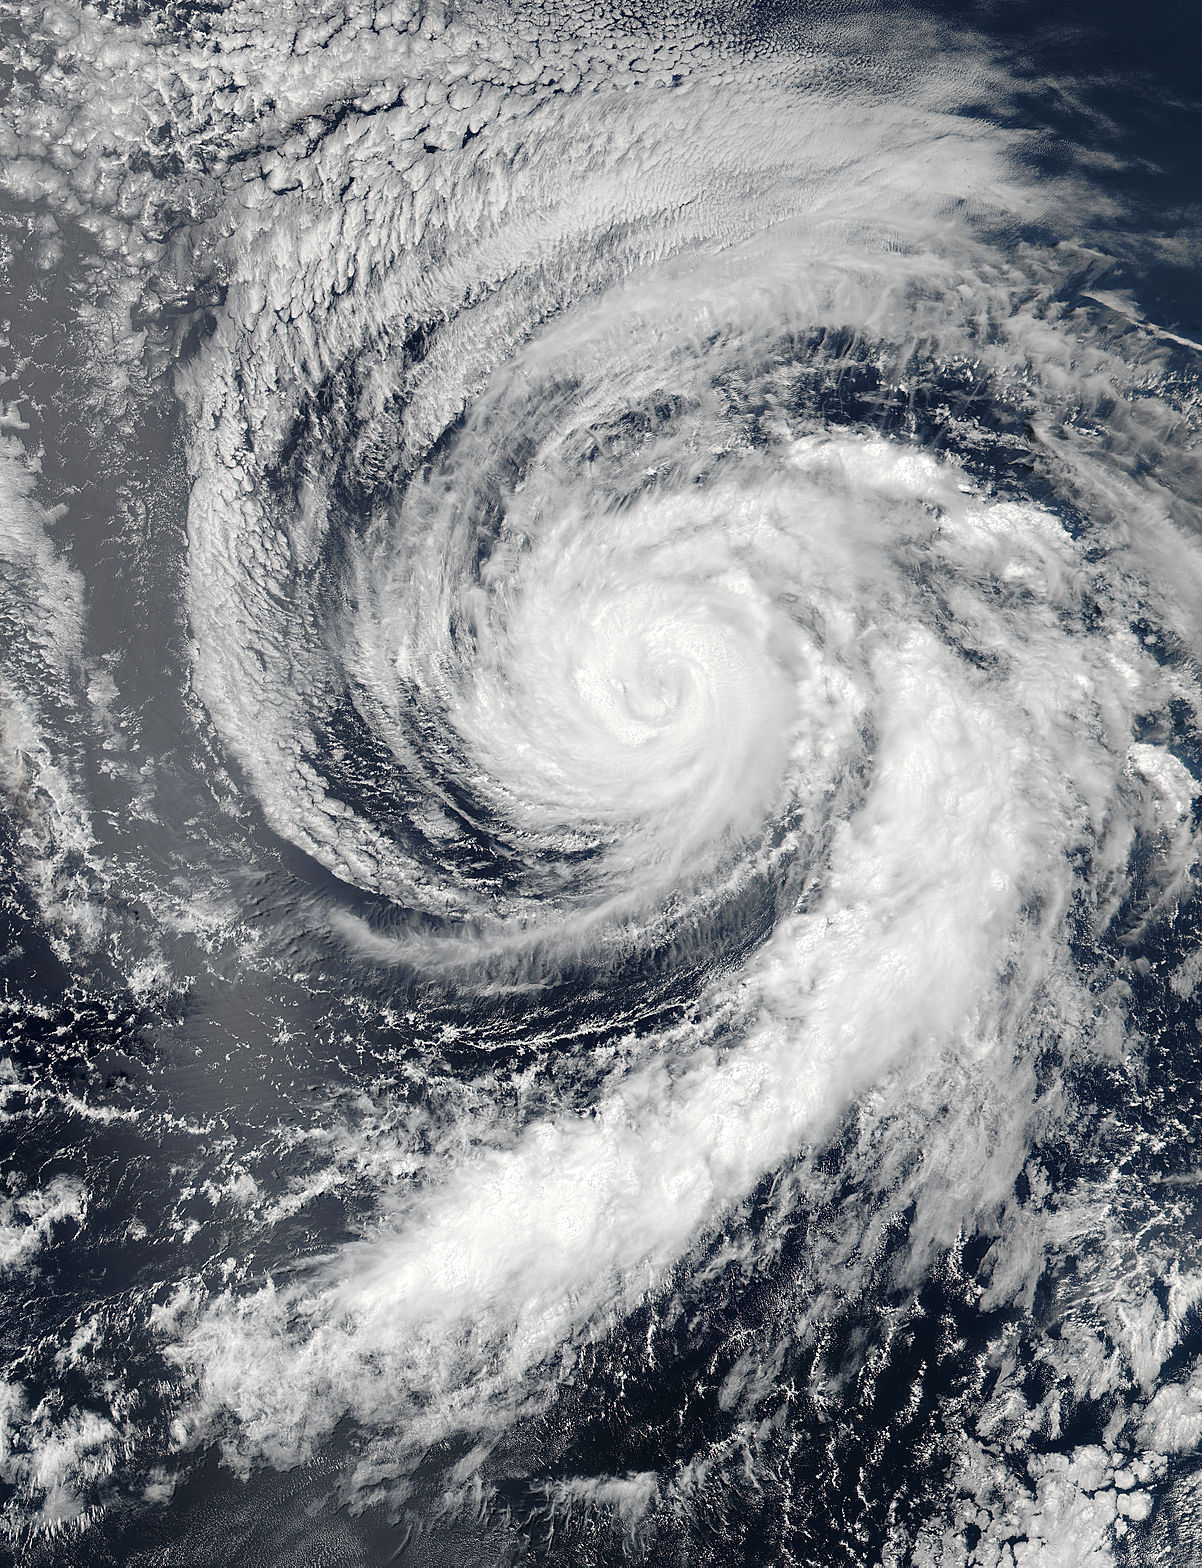
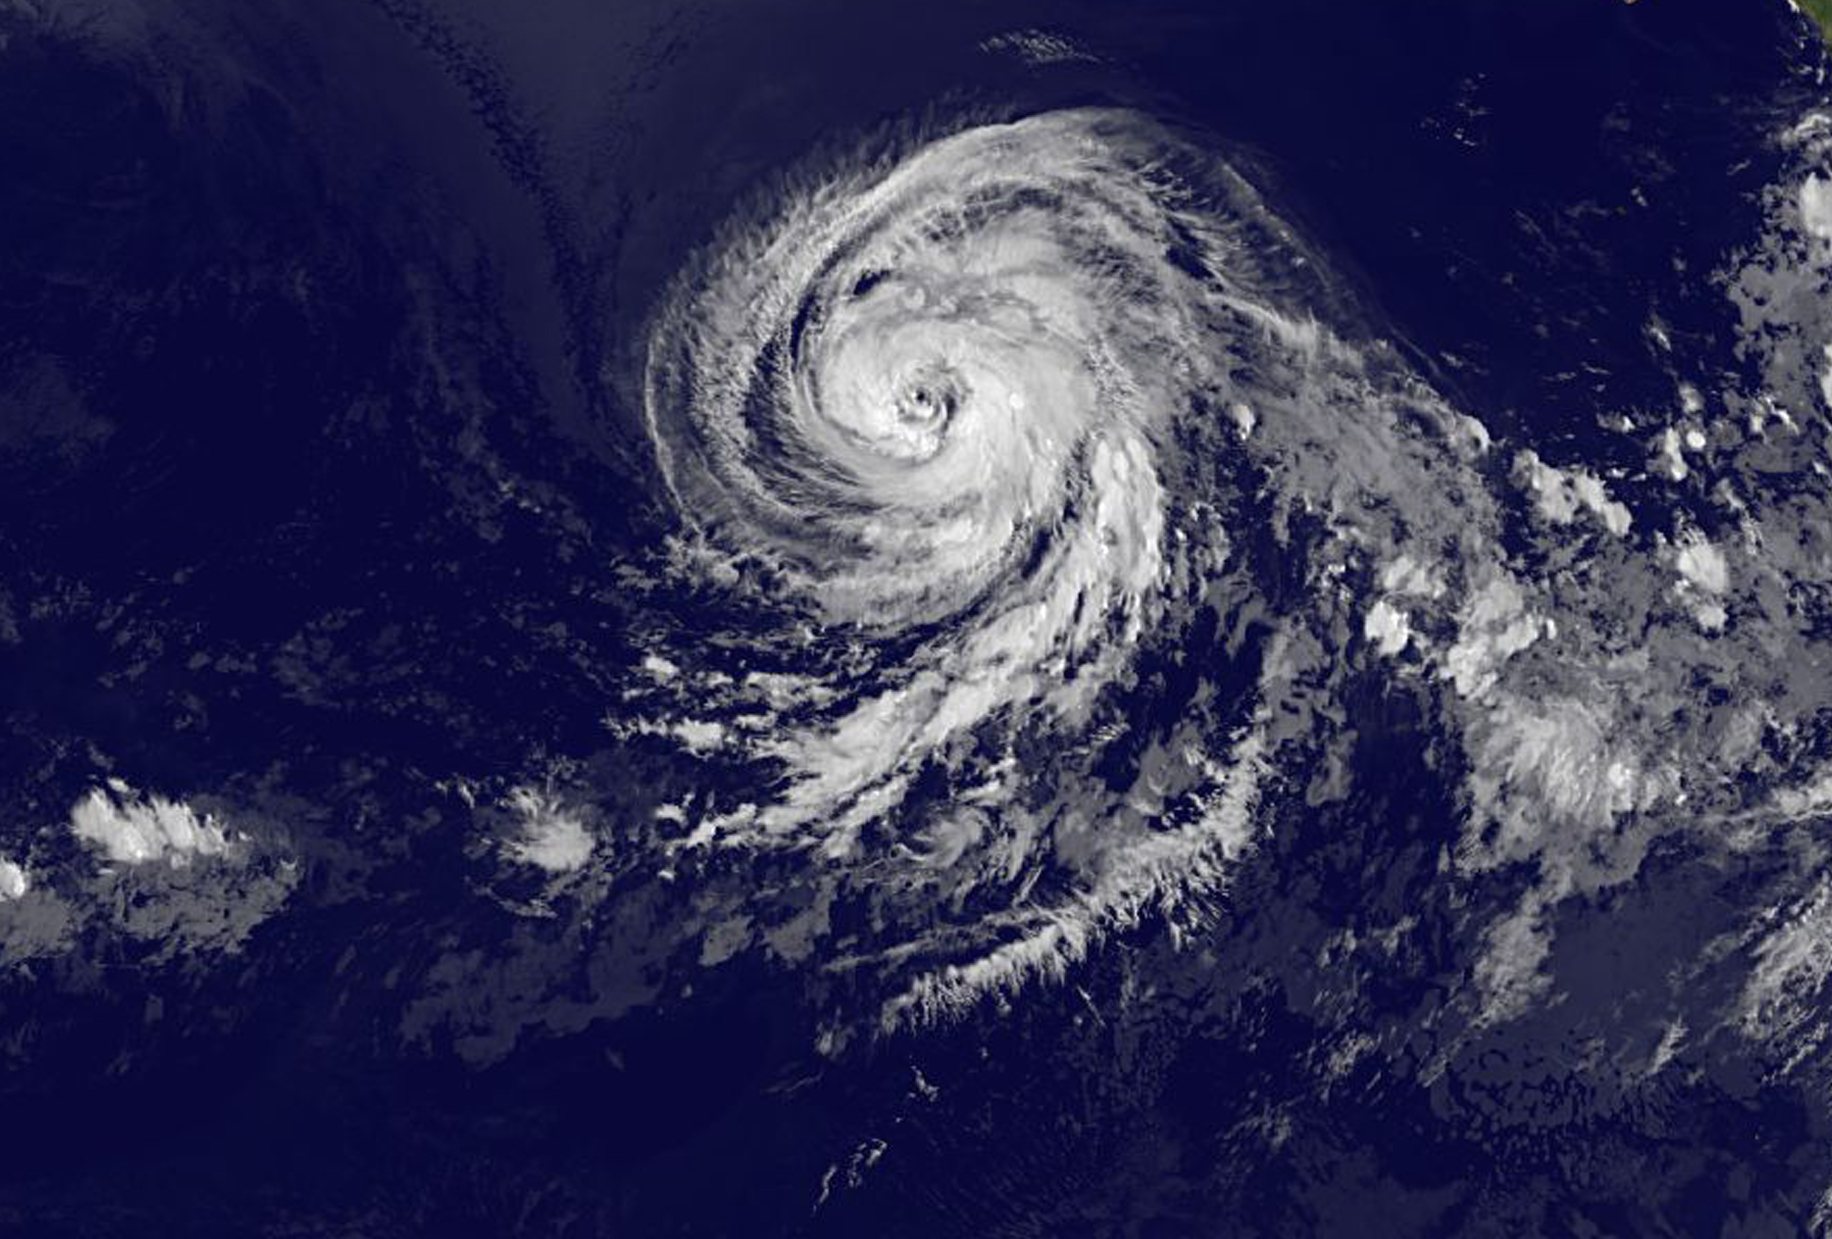
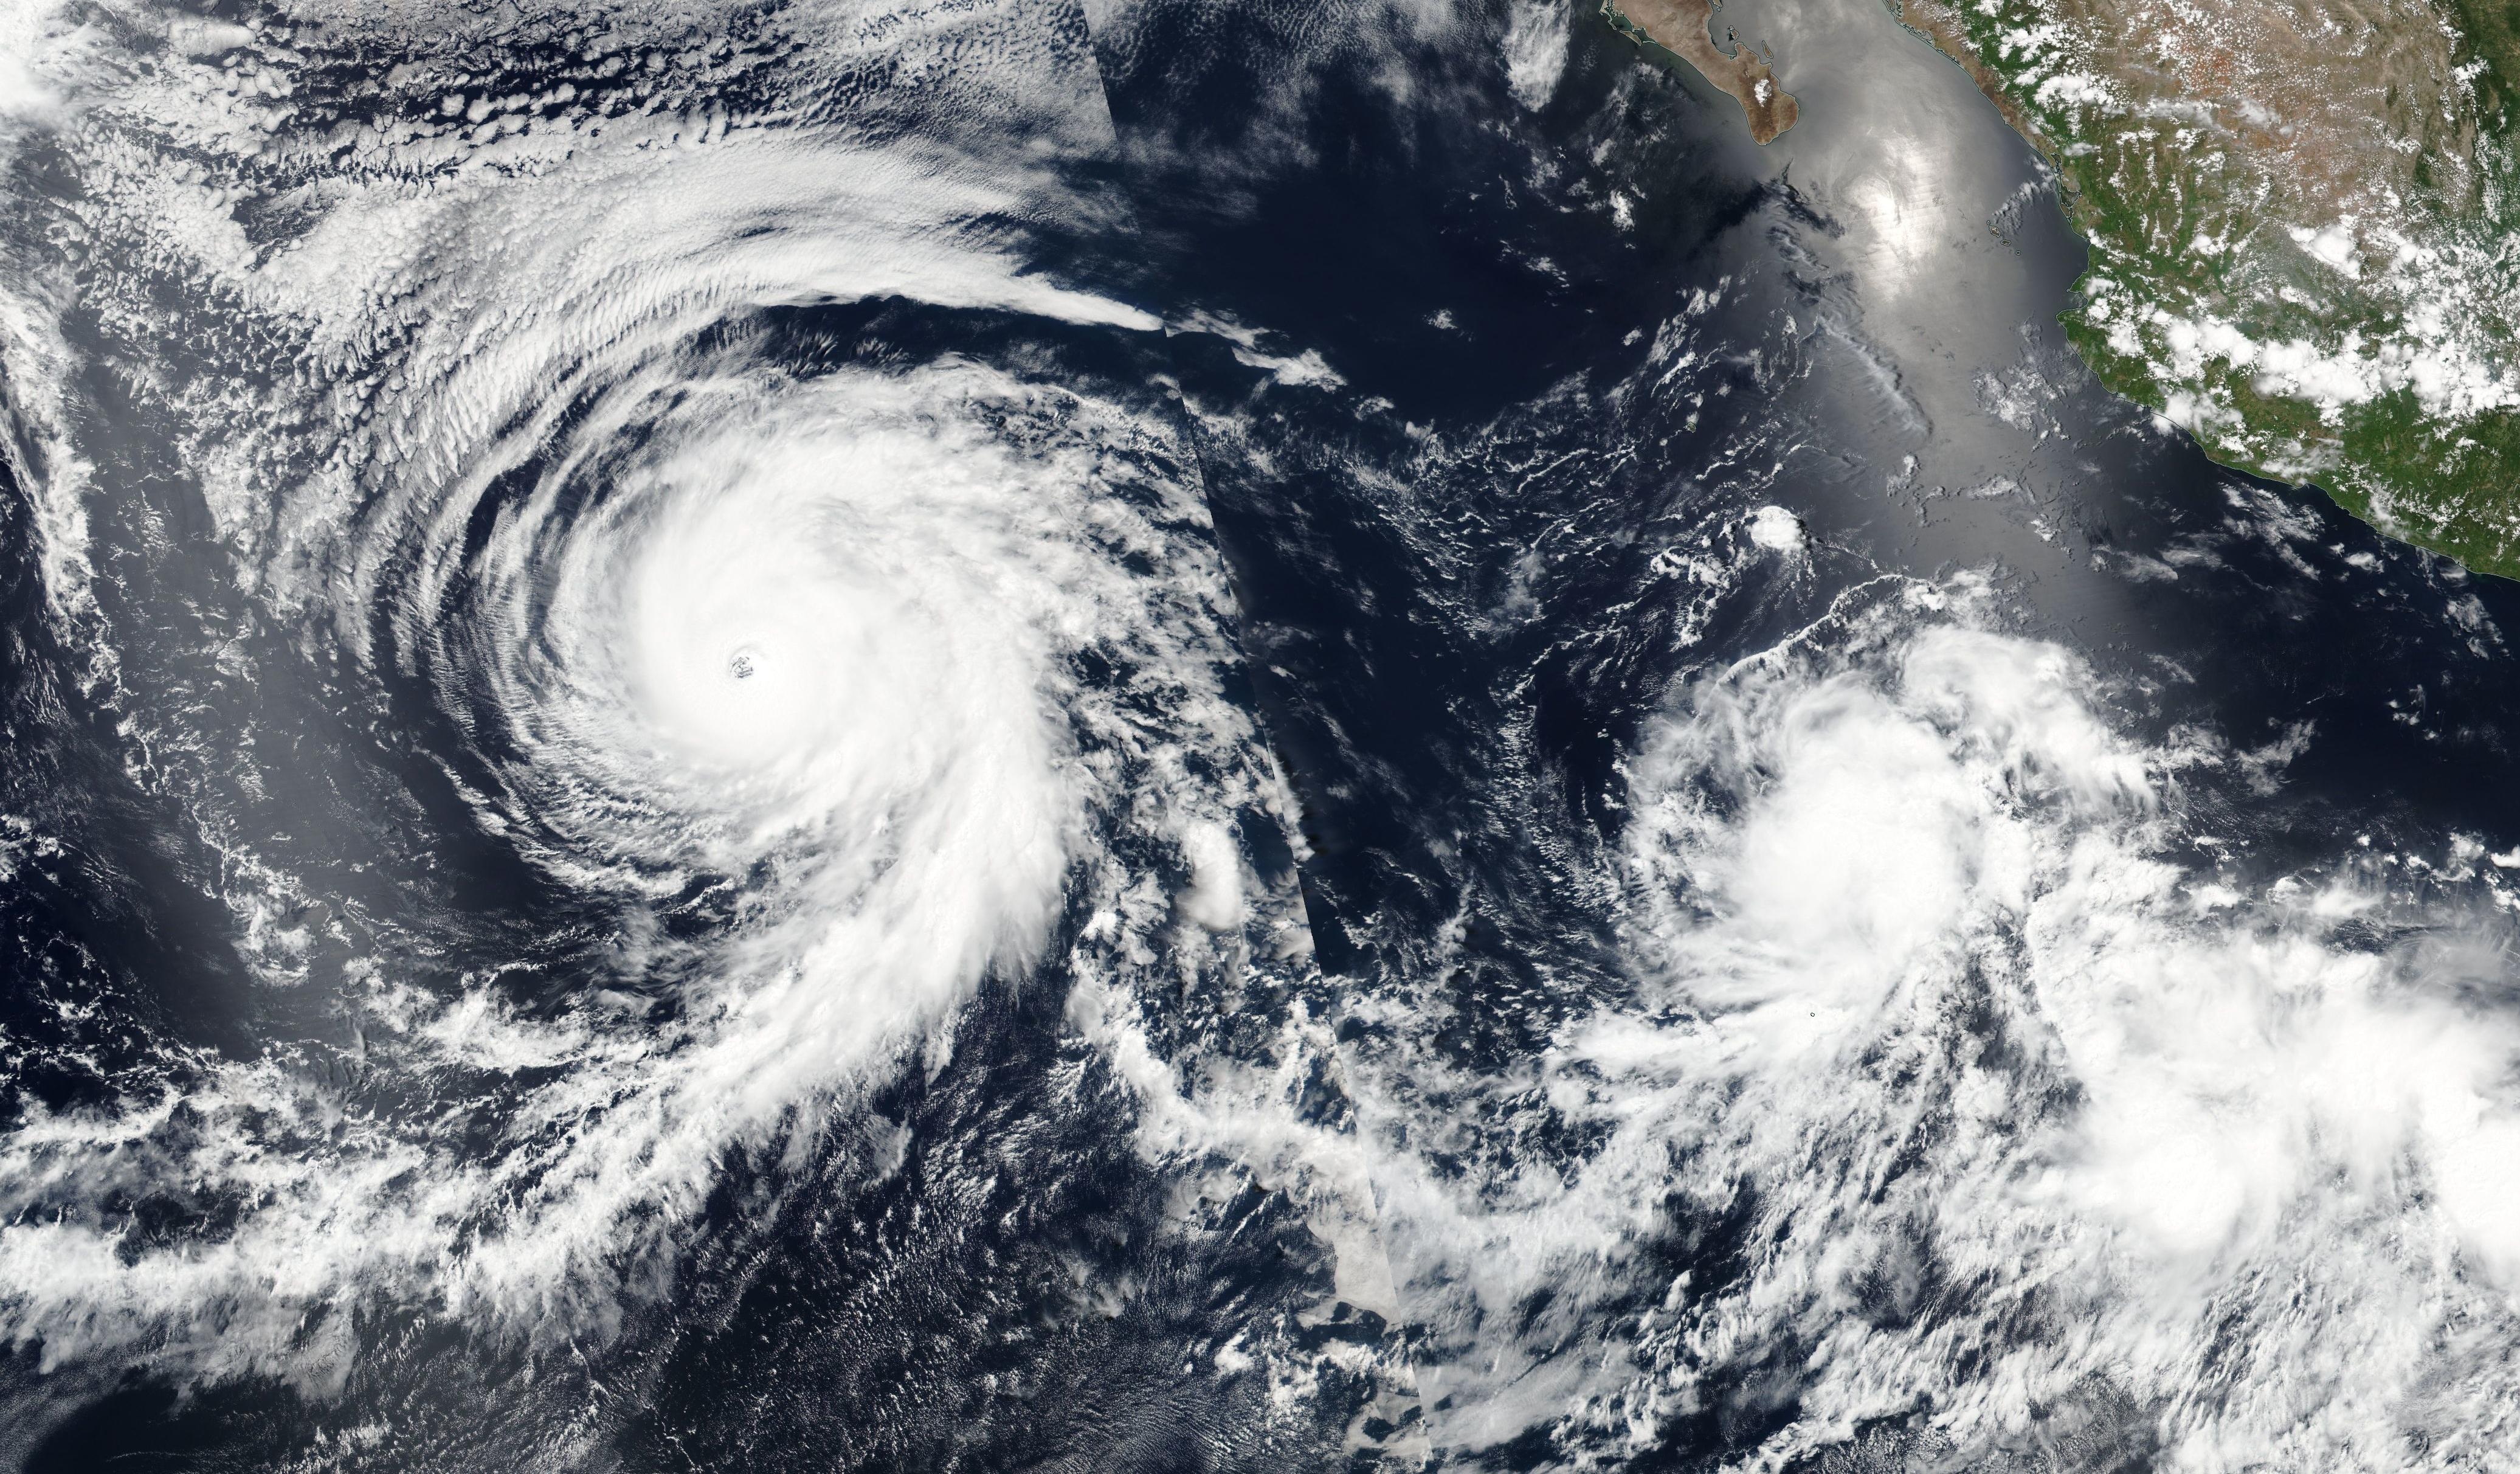
On July 11 at 22:05 UTC (6:05 p.m. EDT) the Visible Infrared Imaging Radiometer Suite (VIIRS) instrument aboard NASA-NOAA-DOD’s Suomi NPP satellite captured a visible light image of Hurricane Celia that showed a cloud-filled eye with powerful bands of thunderstorms wrapping around the low level center. The VIIRS image also showed a large band of thunderstorms that extended to the south, wrapping into the storms’ eastern quadrant.
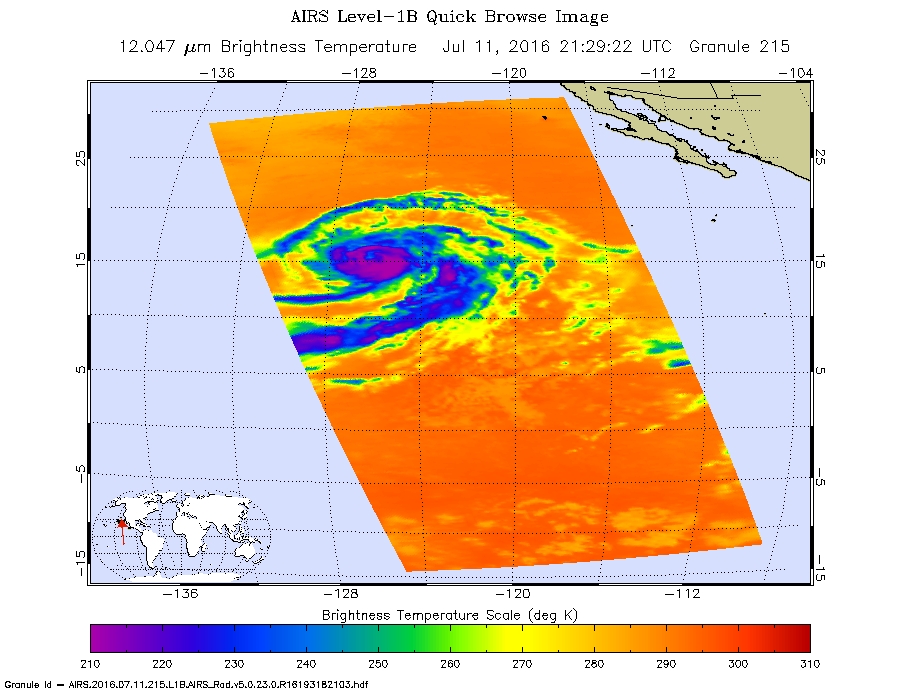
On July 11 at 21:29 UTC (5:29 p.m. EDT) the Atmospheric Infrared Sounder or AIRS instrument aboard NASA’s Aqua satellite captured infrared data of Celia’s cloud top temperatures. The data was made into a false-colored image that showed the coldest, strongest, highest thunderstorm cloud tops in purple wrapping around the center. The color indicated that those thunderstorm tops were as cold as minus 63 Fahrenheit (minus 53 Celsius). NASA research has shown that storms that high in the atmosphere have the ability to generate heavy rain.
At 5 a.m. EDT (0900 UTC) on July 12 the center of Hurricane Celia was located near 16.2 north latitude and 127.9 west longitude. That’s about 1,260 miles (2,025 km) west-southwest of the southern tip of Baja California, Mexico. It was moving to the west-northwest at 10 mph (17 kph) and NOAA’s National Hurricane Center (NHC) expects Celia to turn toward the northwest later today, with this motion continuing Tuesday night and Wednesday. Maximum sustained winds were near 100 mph (155 kph).
NHC forecasts weakening over the next two days and Celia could weaken to a tropical storm on Wednesday.
Rob Gutro
NASA’s Goddard Space Flight Center
July 11, 2016 – Satellite Sees Hurricane Celia Moving Away from Mexico
Tropical Storm Celia strengthened into a hurricane over the weekend of July 9 and 10 and NOAA’s GOES-West satellite provided a visible look at the storm early on July 11.
A visible image of Hurricane Celia was taken from NOAA’s GOES-West satellite on July 11 at 1200 UTC (8 a.m. EDT). Forecaster Stewart at the National Hurricane Center noted “after developing what had been a decent looking eye with a diameter of about 20 nautical miles, dry air has once again penetrated into the inner-core region and has eroded most of the eyewall convection.”
NOAA manages the Geostationary Operational Environmental Satellites, and NASA/NOAA’s GOES Project at NASA’s Goddard Space Flight Center in Greenbelt, Maryland uses the data from them to create images and animations.
At 11 a.m. EDT (1500 UTC) on July 11, the center of Hurricane Celia was located near 15.1 north latitude and 125.5 west longitude, about 1,150 miles (1,850 km) west-southwest of the southern tip of Baja California, Mexico. The National Hurricane Center (NHC) said that Celia was moving toward the west near 13 mph (20 kph), and this motion is expected to continue today. A turn toward the west-northwest with a slight decrease in forward speed is forecast tonight.
Maximum sustained winds have increased to near 90 mph (150 kph) and some additional strengthening is expected today. Slow weakening is forecast to begin on Tuesday. The estimated minimum central pressure is 977 millibars.
For updated forecasts, visit the NHC website: www.nhc.noaa.gov
Rob Gutro
NASA’s Goddard Space Flight Center
July 08, 2016 – Early Daylight Satellite Image Shows Depression Intensify Into Tropical Storm Celia
Tropical Depression 4E strengthened into a tropical storm as NOAA’s GOES-West satellite captured an early daylight image of the storm.
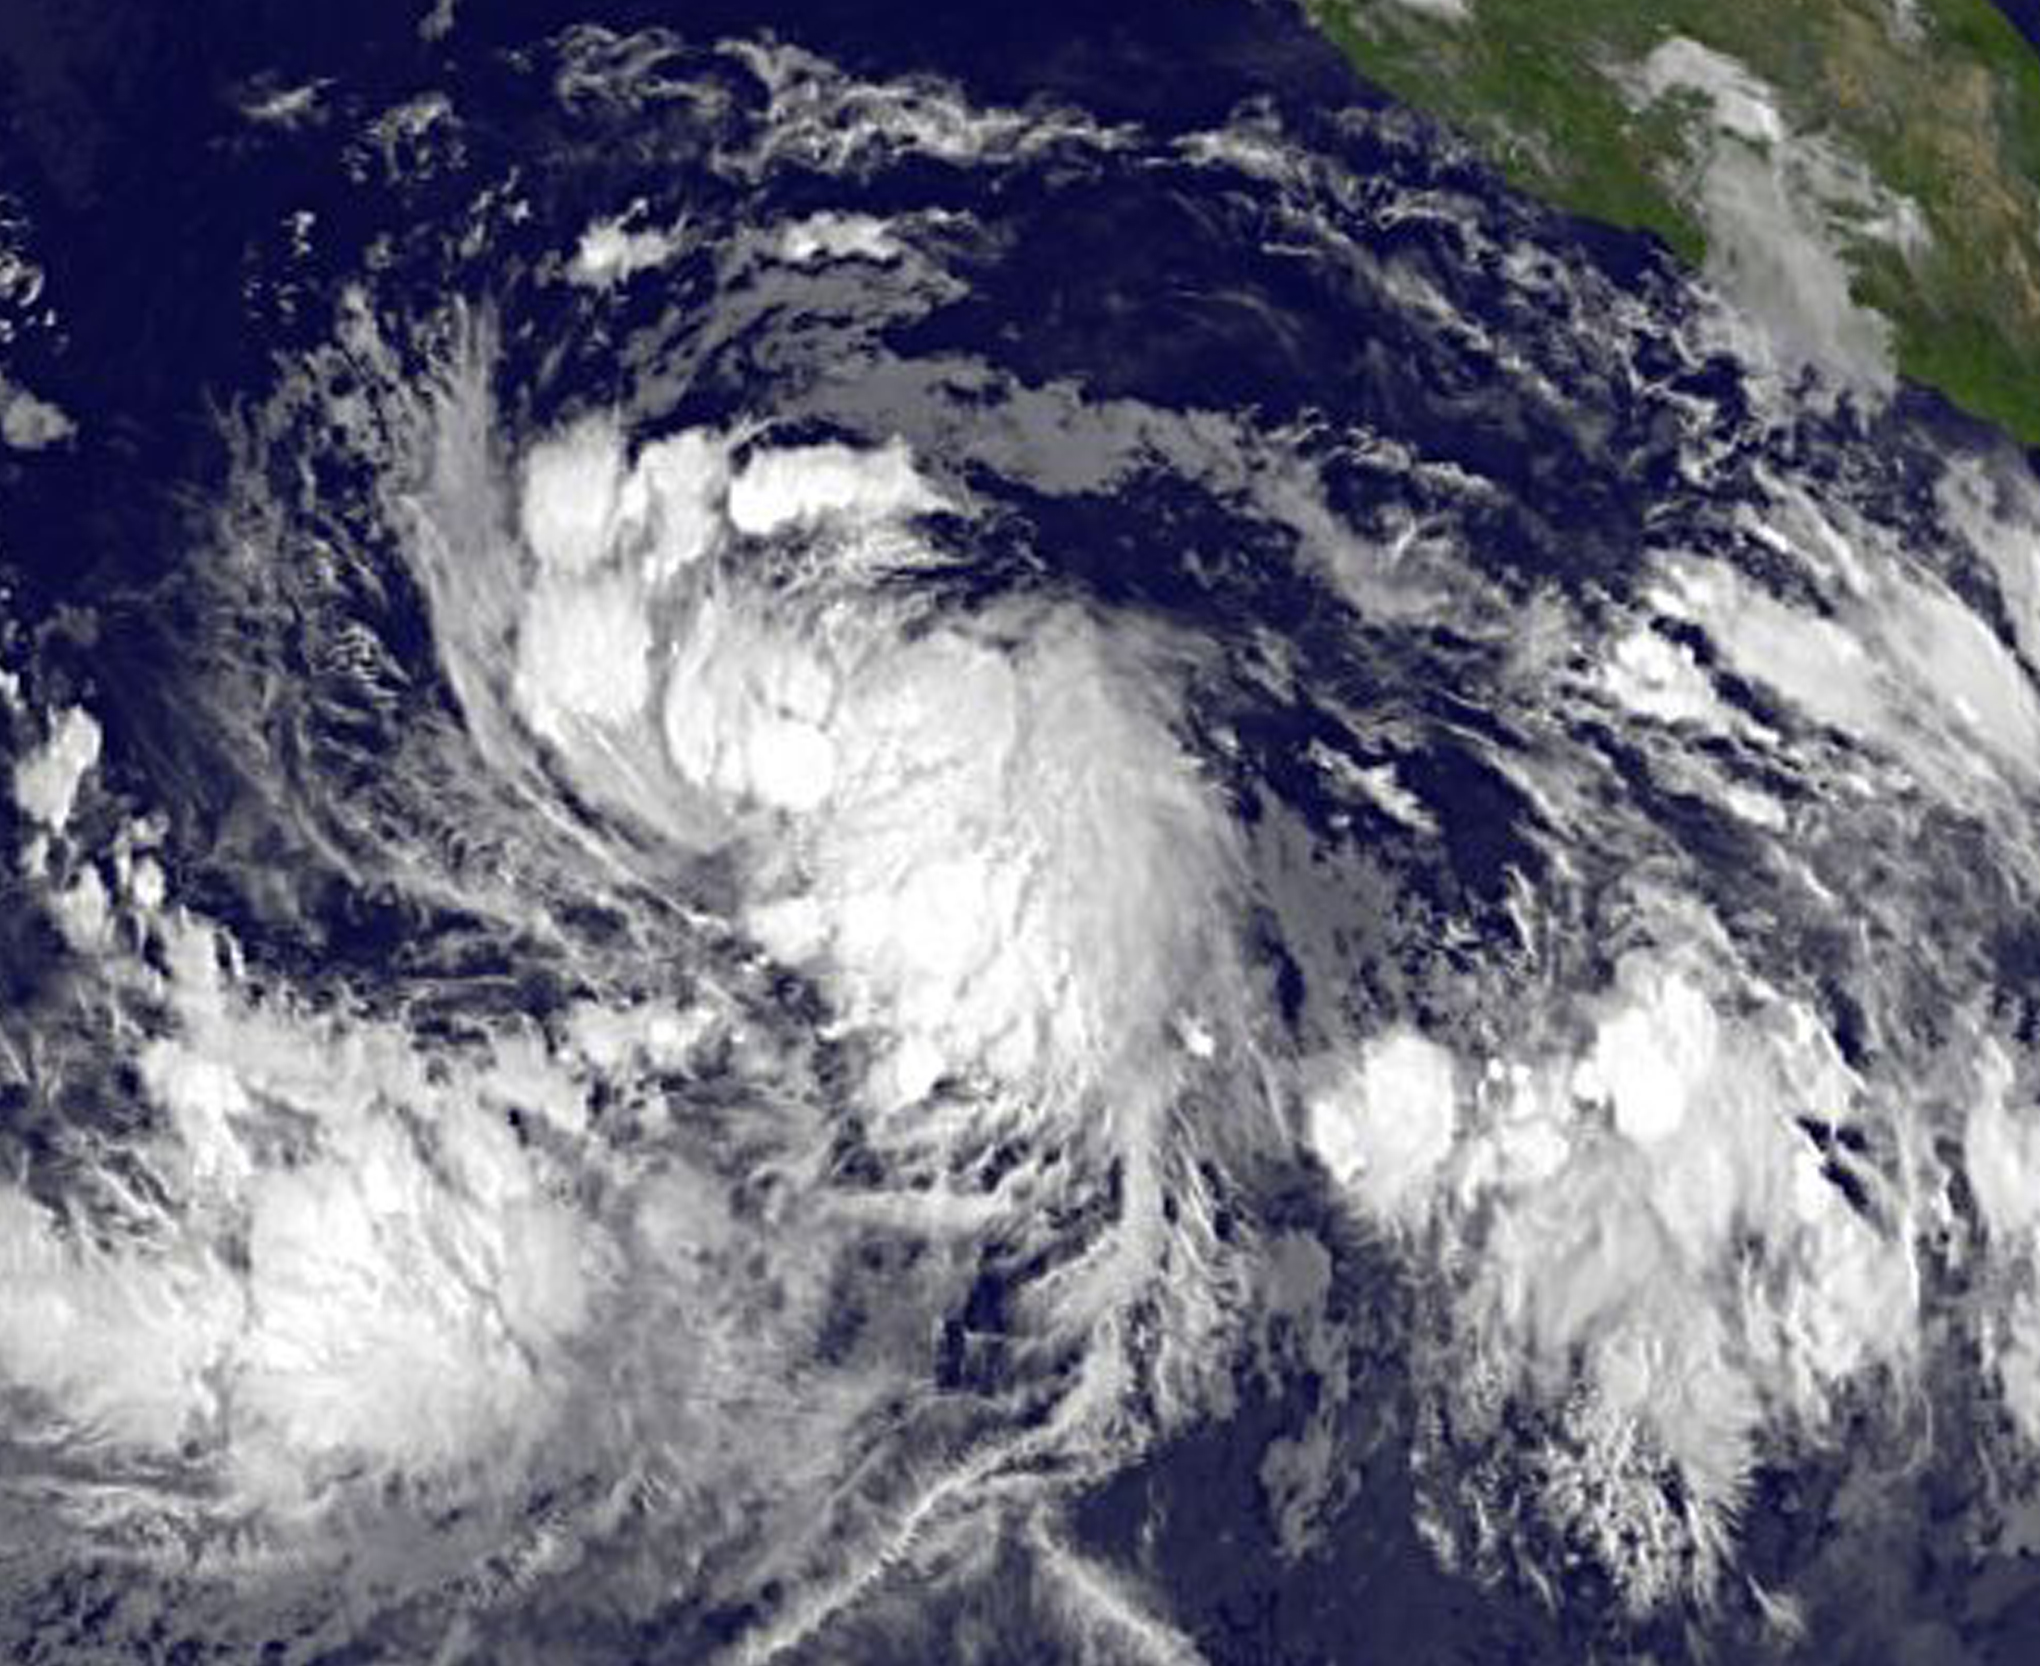
NOAA’s GOES-West satellite captured a visible light image of Tropical Storm Celia at 1200 UTC (8 a.m. EDT). The National Hurricane Center said that this early first-light image showed a “ragged central dense overcast surrounded by a complex of outer bands (of thunderstorms).” The cloud pattern of the tropical depression has become better organized. The image was created by the NASA/NOAA GOES Project at NASA’s Goddard Space Flight Center, Greenbelt, Maryland.
At 11 a.m. EDT (1500 UTC) on July 8 the center of Tropical Storm Celia was located near latitude 12.6 north and longitude 112.8 west. That’s about 735 miles (1,185 km) south-southwest of the southern tip of Baja California, Mexico. Celia was moving toward the west near 9 mph (15 kph) and the National Hurricane Center (NHC) said that this motion is expected to continue with some increase in forward speed during the next couple of days. Maximum sustained winds have increased to near 45 mph (75 kph) with higher gusts. The estimated minimum central pressure is 1003 millibars.
The NHC said that Celia is forecast to be in an environment of light vertical wind shear for the next 3-4 days over the next day or two the cyclone will pass near or over an area of cooler sea surface temperatures left in the wake of Hurricane Blas. This should slow intensification during this time, but Celia is expected to intensify to hurricane strength by Sunday, July 10.
For updated forecasts, visit NHC’s website: www.nhc.noaa.gov
Rob Gutro
NASA’s Goddard Space Flight Center
July 07, 2016 – NASA Sees Tropical Depression 4E Form
The Suomi NPP satellite captured an image of newly formed Tropical Depression 4E in the Eastern Pacific Ocean.
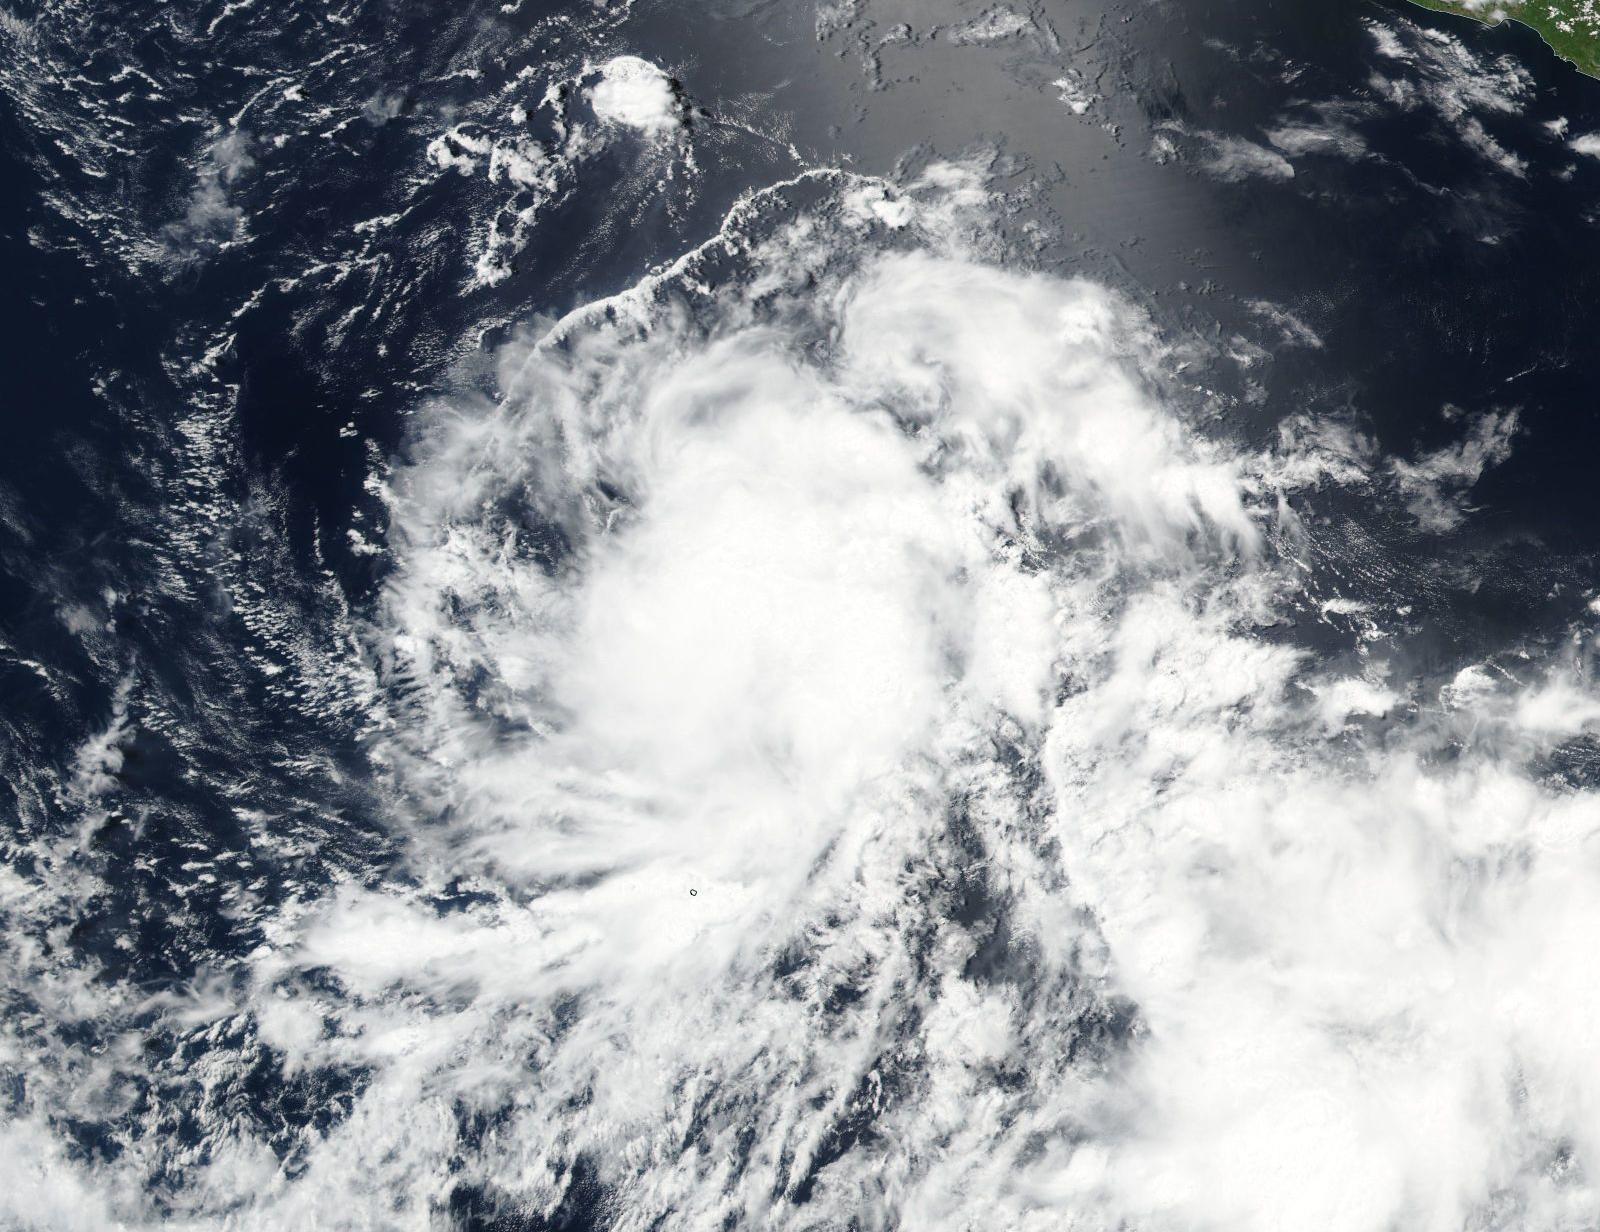
On July 6, the Visible Infrared Imaging Radiometer Suite (VIIRS) instrument aboard NASA-NOAA-DOD’s Suomi NPP satellite captured a visible light image of Tropical Depression 4E (TD4E) soon after it formed at 5 p.m. EDT about 570 miles (915 km) southwest of Manzanillo, Mexico. The storm appeared somewhat elongated because it was being affected by vertical wind shear.
The NHC said on July 7 passive microwave satellite data indicate a fairly well-developed mid-level circulation displaced more than 30 nautical miles north-northwest of the low-level center due to southeasterly vertical wind shear. Dry air is also affecting the system, but NHC said TD4E should move into a more favorable environment later in the day and steady strengthening is expected through day and a half.
At 5 a.m. EDT (0900 UTC) on July 7 the center of TD4E was located near latitude 12.6 North, longitude 110.2 West. That’s about 710 miles (1,145 km) south of the southern tip of Baja California, Mexico. The depression was moving toward the west-northwest near 8 mph (13 kph) and the National Hurricane Center (NHC) expects a turn toward the west later in the day.
Maximum sustained winds are near 35 mph (55 kph) and NHC expects some strengthening is forecast during the next 48 hours, and the depression is forecast to become a tropical storm later today. The estimated minimum central pressure is 1006 millibars.
The storm is expected to become a tropical storm in three days and reach hurricane status thereafter. For updated forecasts, visit: www.nhc.noaa.gov.