


SMART – Schedule Management and Relationship Tool
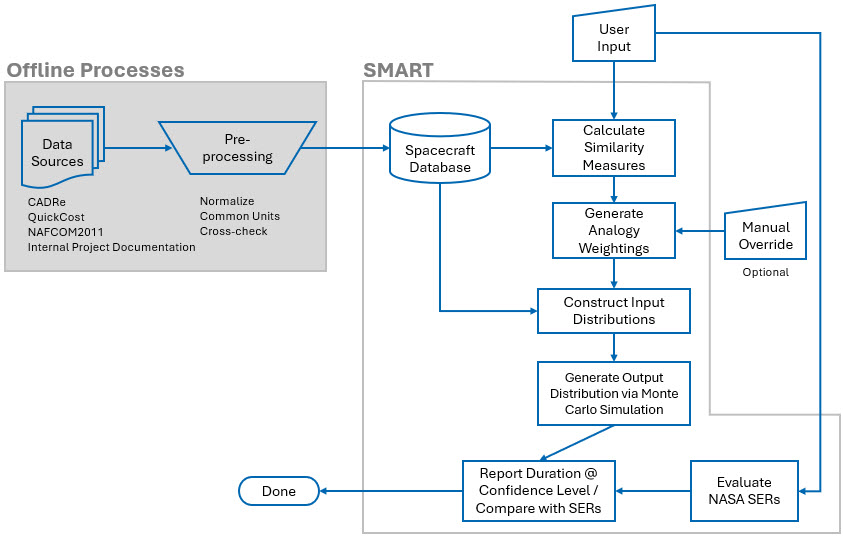
The Schedule Management and Relationship Tool (SMART) combines analogy-based and parametric methods to estimate development schedules for unmanned spacecraft projects from Authority To Proceed (ATP) to Launch Readiness Date (LRD). SMART utilizes NASA-developed Schedule Estimating Relationships (SERs) as a convenient cross-check to the primary analogy-based method. The SERs within SMART are based on a database of more than 100 historical unmanned spacecraft projects. Based on spacecraft characteristics, the tool provides a statistical illustration of how a project’s schedule estimate compares to other analogous projects. SMART estimates schedule durations for the overall ATP-to-Launch period, as well as intermediate development durations: ATP to SRR, SRR to PDR, PDR to CDR, CDR to SIR, and SIR to Launch.
Overview of SMART Version 3.0 Updates
SMART Version 3.0 introduces significant enhancements to schedule estimating and analogy weighting methodologies. This update refines the SERs for specific mission classes and introduces new user input features to better track Life Cycle Reviews (LCRs).
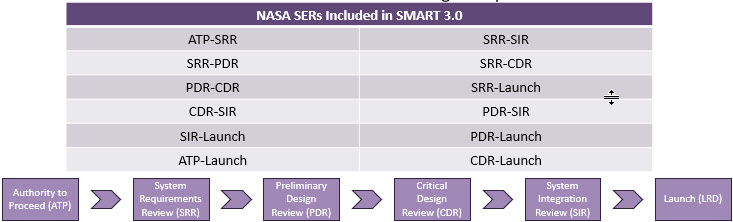
1. Updated Schedule Estimating Relationships (SERs)
SMART 3.0 provides detailed SERs to calculate cumulative and additional schedule milestones based on key mission parameters.
- Earth Orbiting Missions: Features 12 SERs for primary milestones (e.g., ATP-SRR, SRR-PDR, PDR-CDR) and additional segments. Calculations utilize independent variables including Mass, Power, Design Life (DL), Max Data Rate (DR), Instrument Count (IC), and Development Year (YearDev).
- Lunar Missions: Also features 12 specific SERs tailored for lunar mission milestones. These formulas primarily scale using Dry Mass (Mass), Design Life (DL), and Max Data Rate (DR).
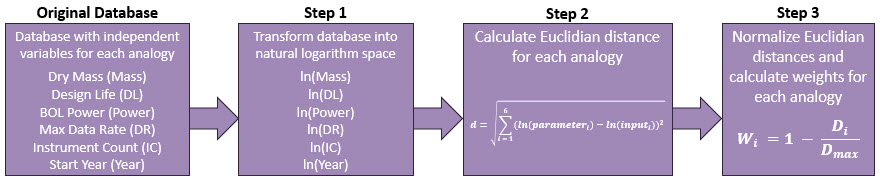
2. Enhanced Analogy Weighting Methodology
The tool uses an advanced analogy weighting methodology to compare user-defined Project Technical Inputs with historical missions.
- Calculation Method: A macro automatically calculates a similarity score (weight) for each analogous mission using Euclidean distance. This geometric measure calculates the multidimensional space between data points.
- Variables Used: Six independent variables are transformed into natural logarithm space to calculate this distance: Dry Mass, Design Life, BOL Power, Max Data Rate, Instrument Count, and Start Year.
- Weighting: Missions that are most dissimilar to the user’s inputs receive similarity weights closest to 0.
3. Project Dates at Life Cycle Reviews
A major addition to the front end of SMART 3.0 is the “Project Dates at LCR” section.
- Functionality: Users can now enter the actual and/or planned dates (in MM/DD/YYYY format) at each specific LCR row. As the project progresses, actual dates for past milestones are recorded alongside forecasted dates for future milestones (e.g., entering actual ATP and SRR dates, while forecasting PDR, CDR, SIR, and LRD).
- Automated Scheduling: If dates are entered in chronological order, SMART automatically displays the project schedule estimate.
- Manual Override: Users can override the automated schedule estimate by manually entering the number of months. If a user wishes to revert to the automated feature, they can input a simple Excel formula (
=IF(Z24=0,Y24,Z24)) into the estimate cell.
4. Enhanced Output Graphics and Visualizations
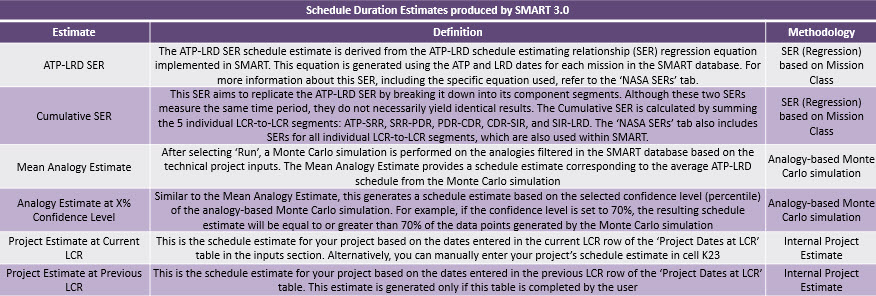
After running a Monte Carlo simulation based on user inputs, SMART 3.0 automatically generates a comprehensive suite of visual outputs. The latest version updates all output charts to include three new estimate types and introduces a new visual breakdown of analogous missions.
Key visualizations include:
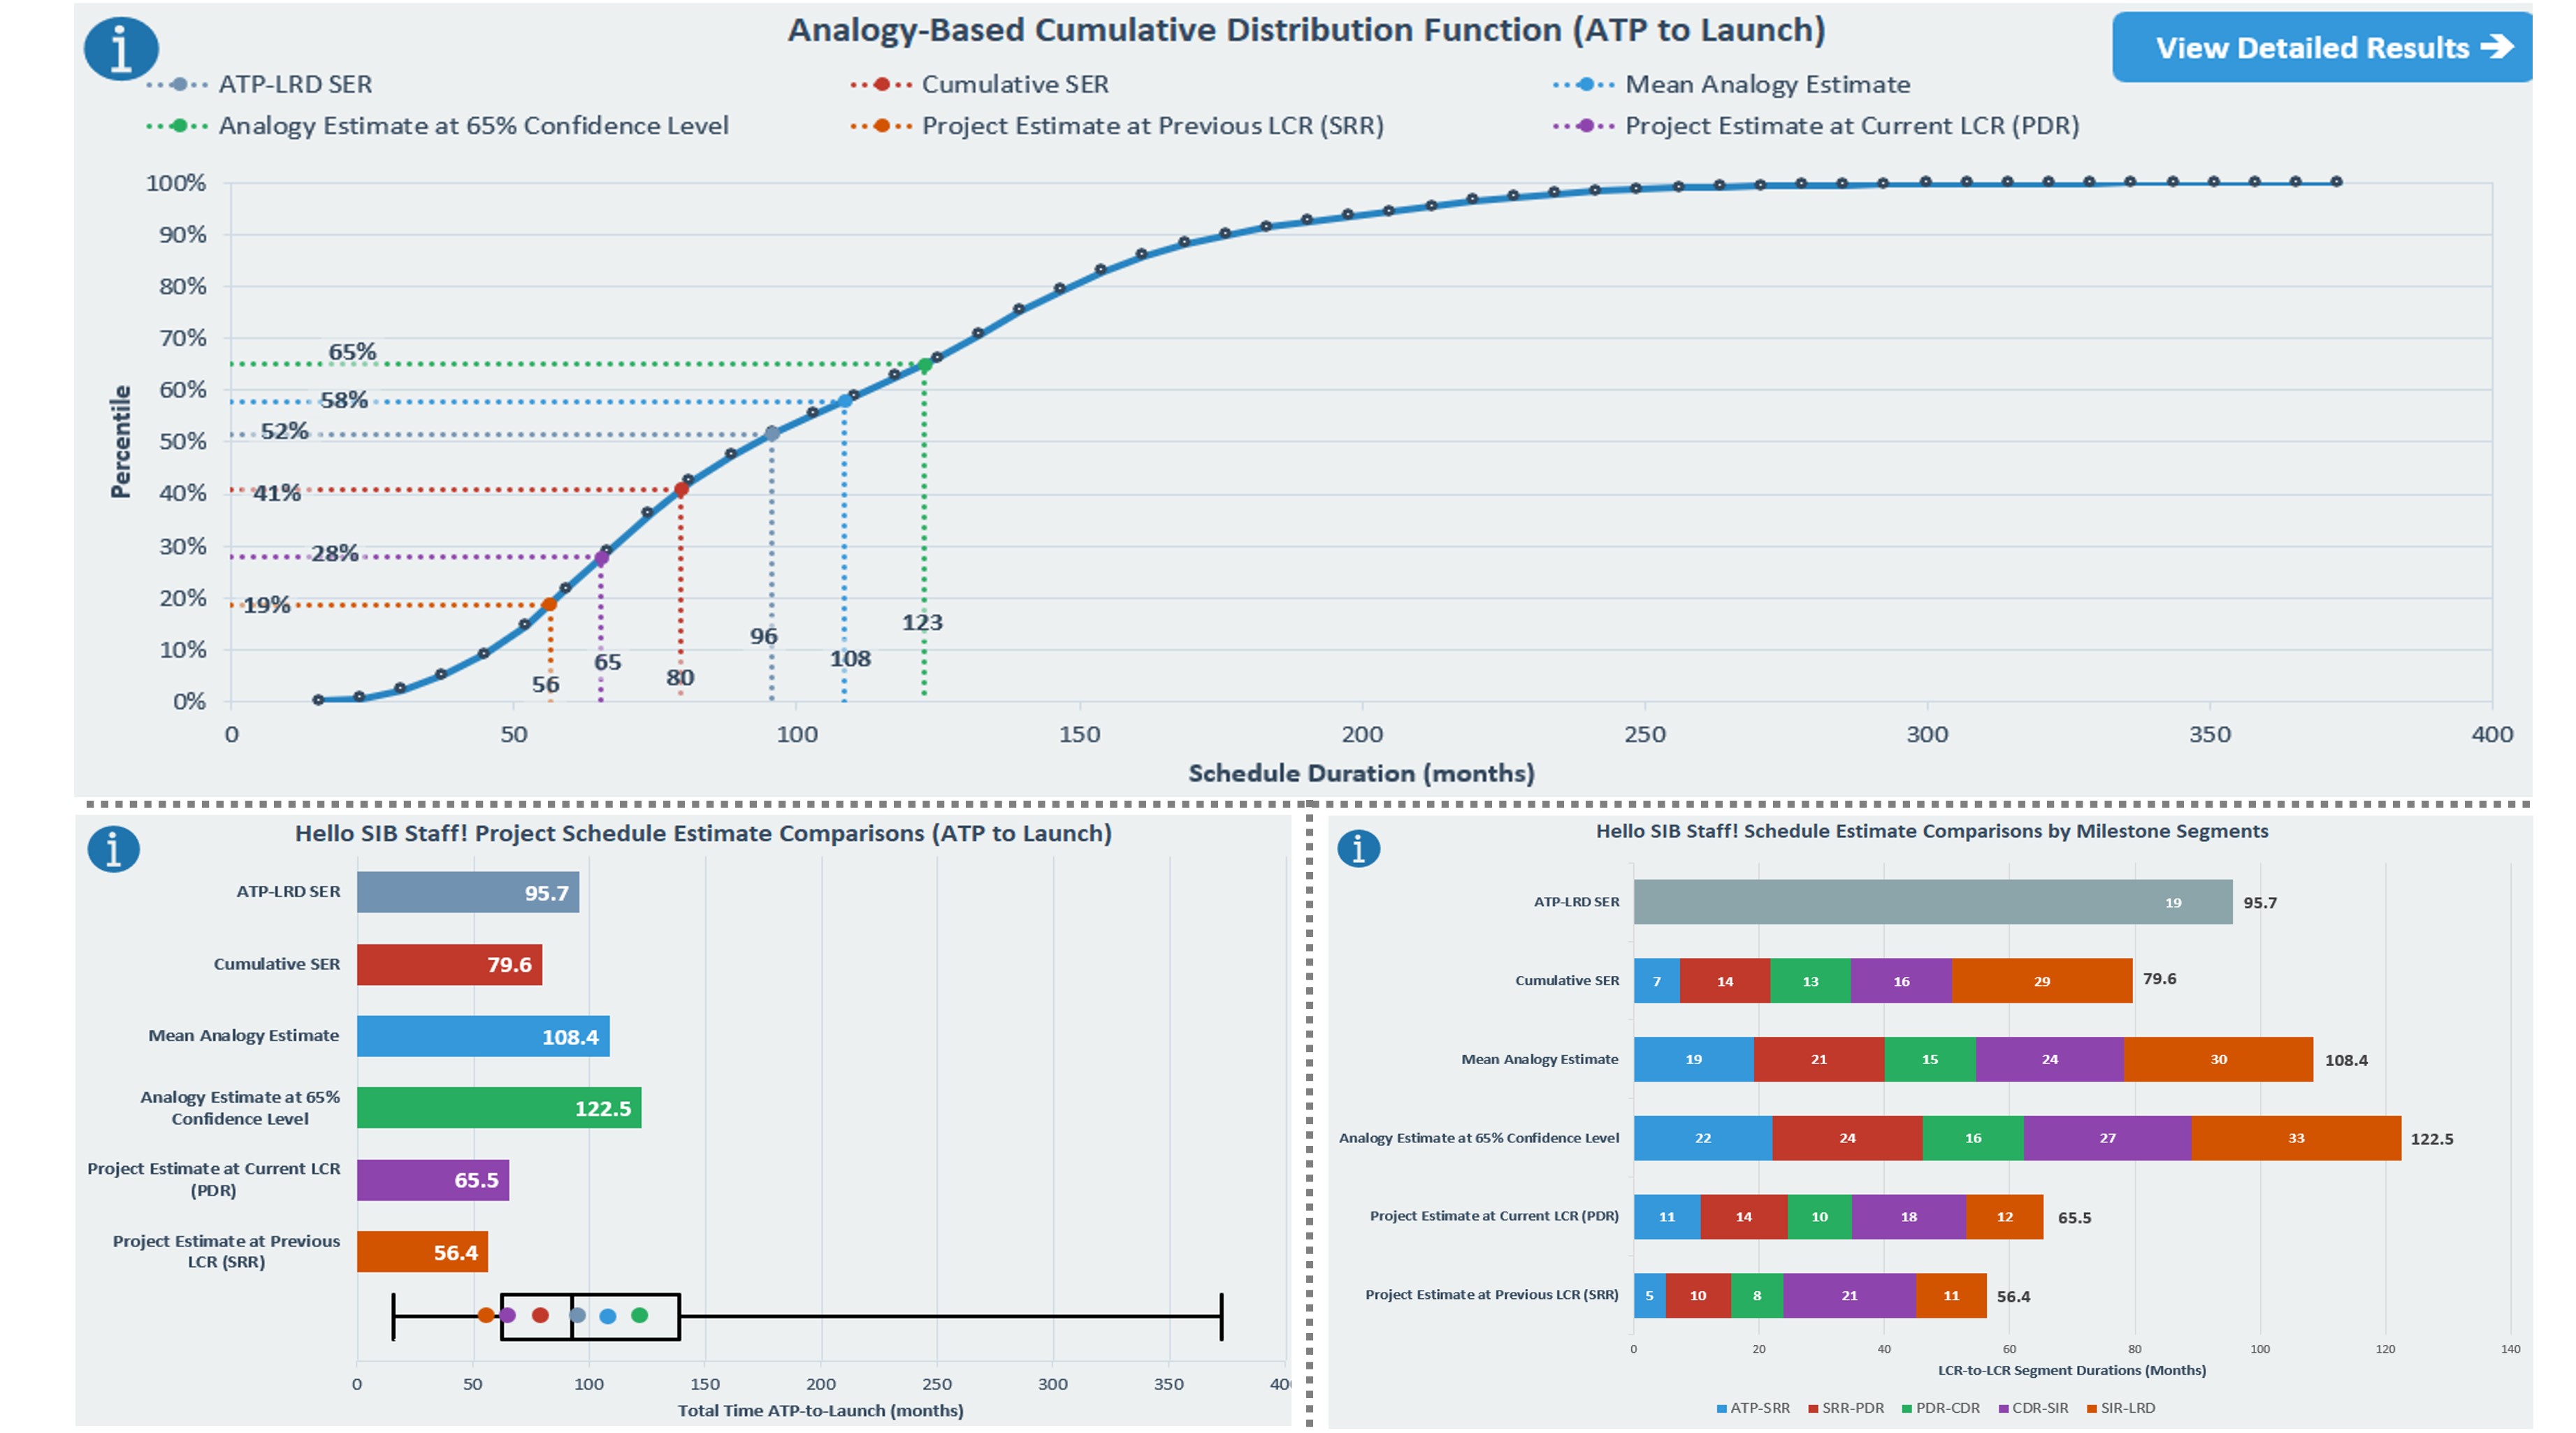
LCR-to-LCR Duration Estimates: A clear display of predicted durations between life cycle reviews, mapped out at both the mean and specified confidence levels.
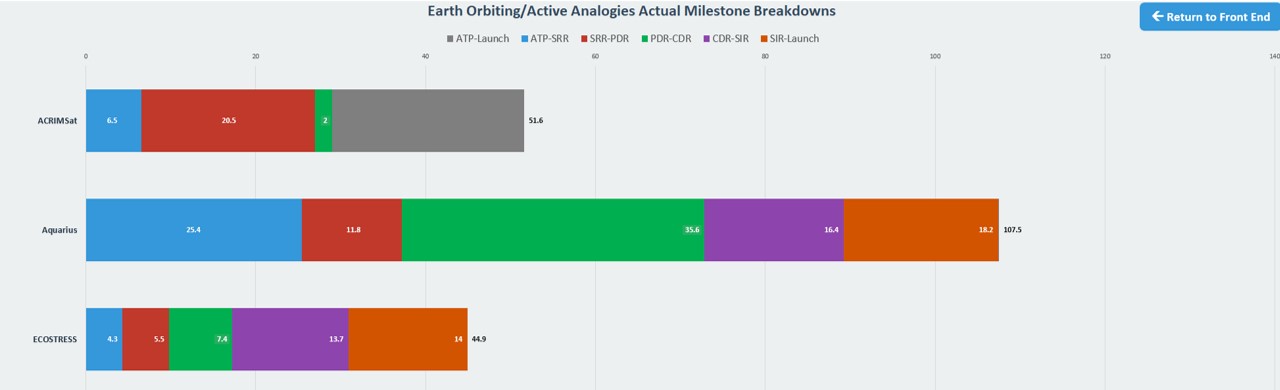
Analogy Milestone Breakdowns: A new chart that displays actual milestone segment breakdowns for all active analogous missions. To maintain consistent timeline comparisons, missing data for specific milestones is bridged using a gray background bar representing the mission’s total ATP-to-Launch duration.
ATP-to-Launch Visualization: A combined bar chart and boxplot that illustrates all total-duration estimates from ATP to Launch.
Segmented Schedule Estimates: Detailed charts providing schedule predictions broken down by individual LCR-to-LCR milestone segments.
Cumulative Distribution Function (CDF): A visual representation plotting the full statistical range of possible schedule estimates.
SMART is being continually updated by HQ OCFO SID to generate more reliable SERs. The tool is available for download from ONCE for NASA Civil Servants and NASA Contractors.