


NASA Satellite Data Shows Joaquin Becoming a Post-Tropical Cyclone
Infrared data from NASA’s Aqua satellite showed Hurricane Joaquin weakening over cooler waters and transitioning into a post-tropical cyclone.
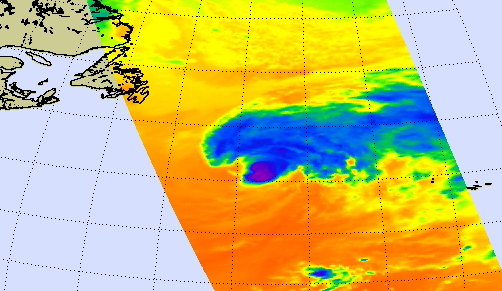
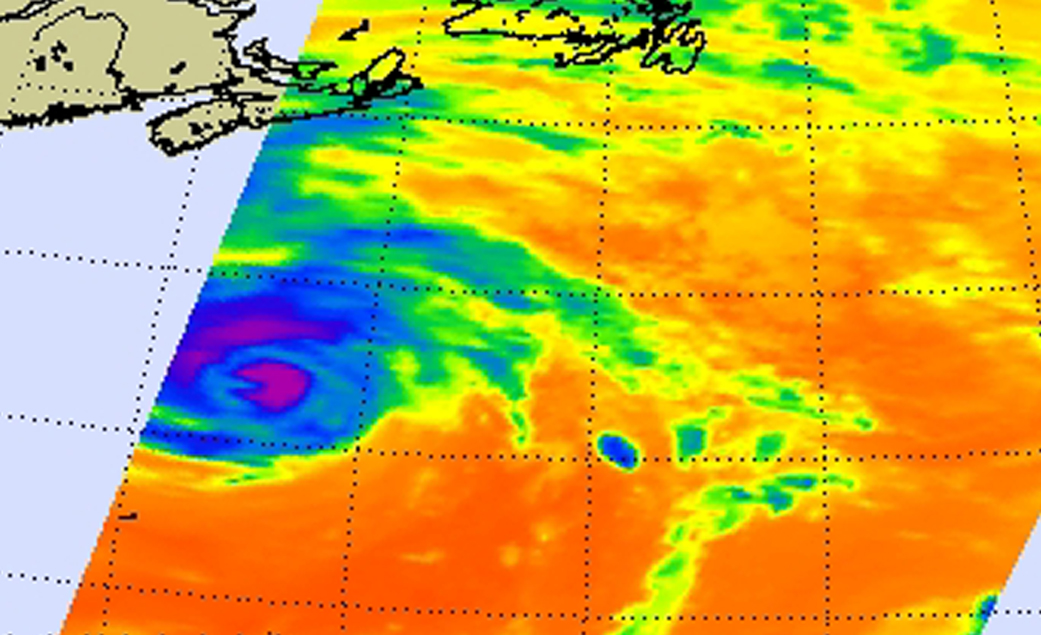
An infrared image of Hurricane Joaquin was taken from the AIRS (Atmospheric Infrared Sounder) instrument aboard NASA’s Aqua satellite on Oct. 7 at 15:41 UTC (11:41 a.m. EDT). The infrared data, which shows temperature, showed the highest, coldest clouds and the bulk of cold clouds were being pushed from the center to northeast of the center by westerly winds. Cloud top temperatures had also warmed since the previous day indicating weaker storms and less uplift in the air. AIRS infrared data also showed the sea surface temperatures were colder than the 80F (26.6C) required to help a tropical cyclone maintain intensity.
Because Joaquin lacked sufficient organized deep convection (and developing thunderstorms) to qualify as a tropical cyclone, at 11 p.m. EDT on October 7, the National Hurricane Center declared Joaquin as a post-tropical cyclone.
At 11 p.m. EDT on October 7 (0300 UTC, Oct.8), the center of Post-Tropical Cyclone Joaquin was located near latitude 42.0 North, longitude 37.0 West. That’s about 595 miles (960 km) west-northwest of the Azores. The post-tropical cyclone was moving toward the east near 35 mph (56 kph), and this general motion is expected over the next couple of days. Maximum sustained winds have decreased to near 65 mph (100 kph) and additional weakening is forecast during the next 48 hours. The estimated minimum central pressure was 977 millibars.
National Hurricane Center forecaster Pasch said “Satellite imagery indicates that the system no longer resembles a tropical cyclone, with a disorganized area of multi-layered cloudiness sheared off well to the northeast of the ill-defined low-level center. However, model analyses and surface data indicate that the cyclone is not yet embedded within a frontal zone, and therefore is not extratropical at this time.”
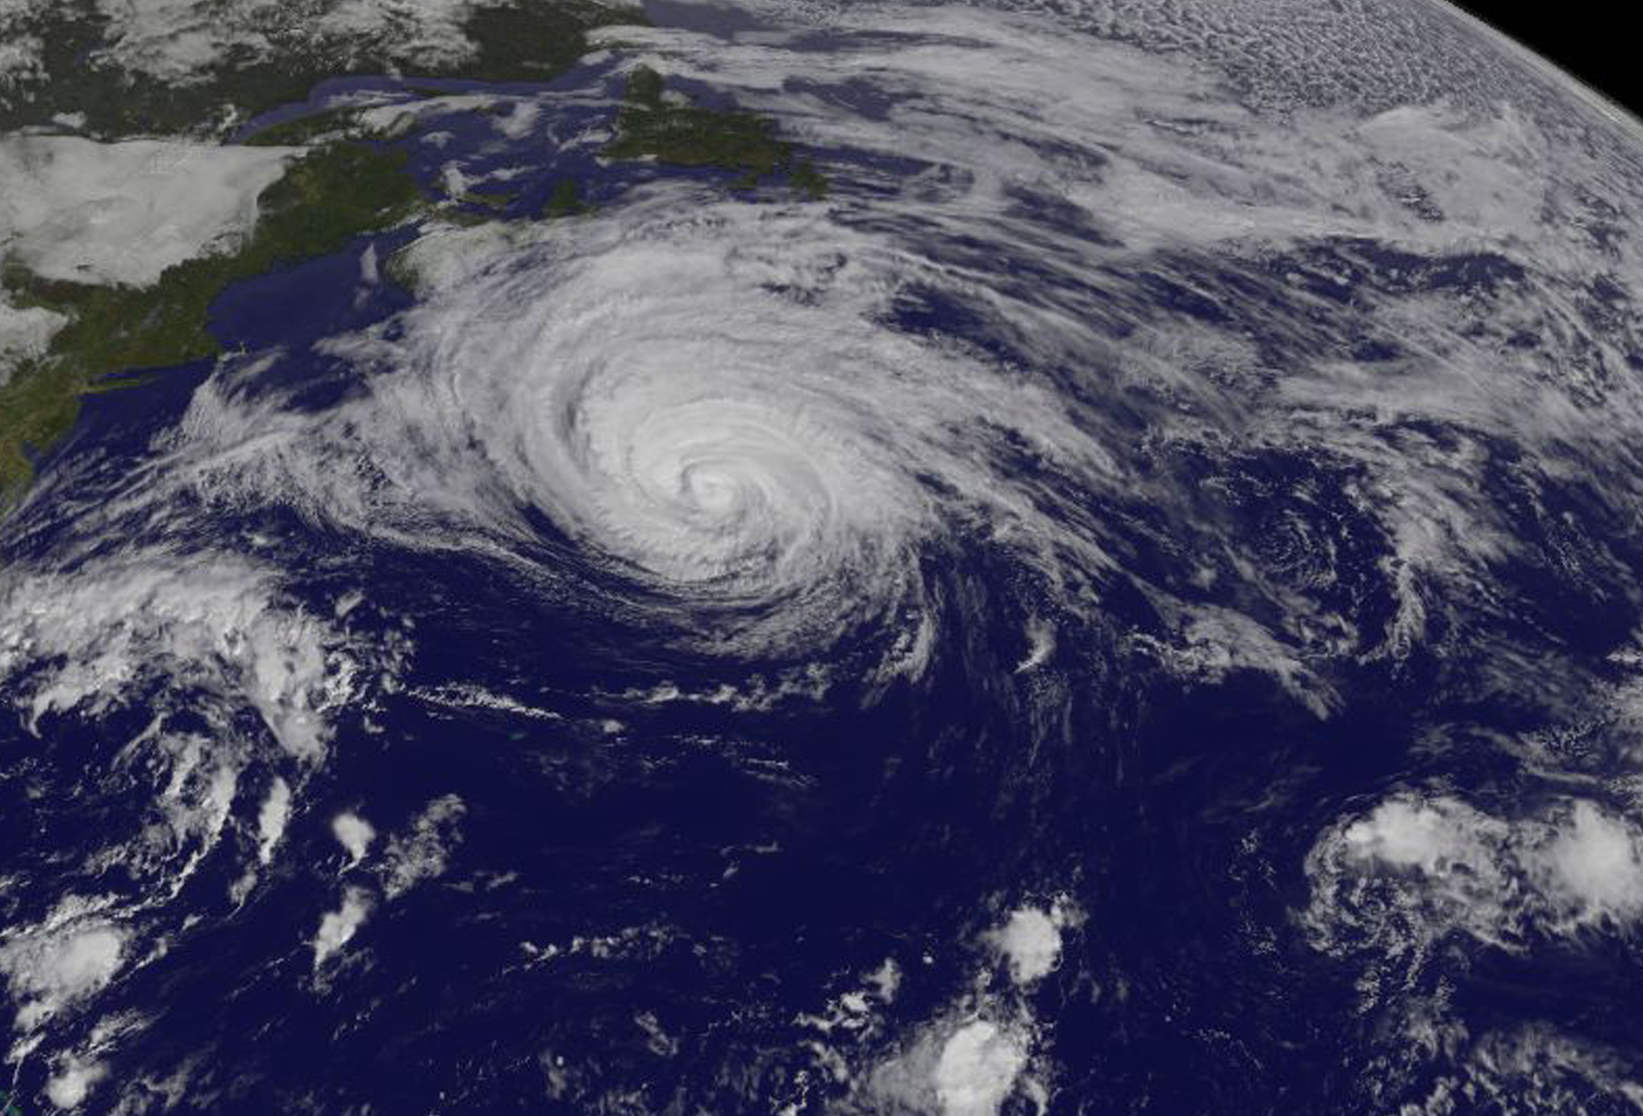
A visible image of Joaquin was taken from NOAA’s GOES-East satellite on Oct. 8 at 1145 UTC (7:45 a.m. EDT) as it sped through the northern Atlantic Ocean. The image showed that most of the clouds associated with the post-tropical cyclone were northeast of the center. The image was created by the NASA/NOAA GOES Project at NASA’s Goddard Space Flight Center in Greenbelt, Maryland.
Future information on this system can be found in NOAA’s High Seas Forecasts issued by the National Weather Service at: http://www.opc.ncep.noaa.gov/shtml/NFDHSFAT1.shtml.
Post-tropical Joaquin continued to move rapidly toward the east at 30 knots while embedded in strong mid-latitude westerlies (winds).The National Hurricane Center expects the storm to continue weakening and turn to the southeast ahead of a trough (elongated area) of low pressure. That would take Joaquin’s remnants toward Portugal and Spain over the weekend of October 10 and 11.
Rob Gutro
NASA’s Goddard Space Flight Center
Oct. 07, 2015 – NASA Provides an Infrared Look at Hurricane Joaquin Over Time
A series of NASA infrared images of Hurricane Joaquin from October 1 to 6 show the development and movement of the storm, and its moisture stream into South Carolina.
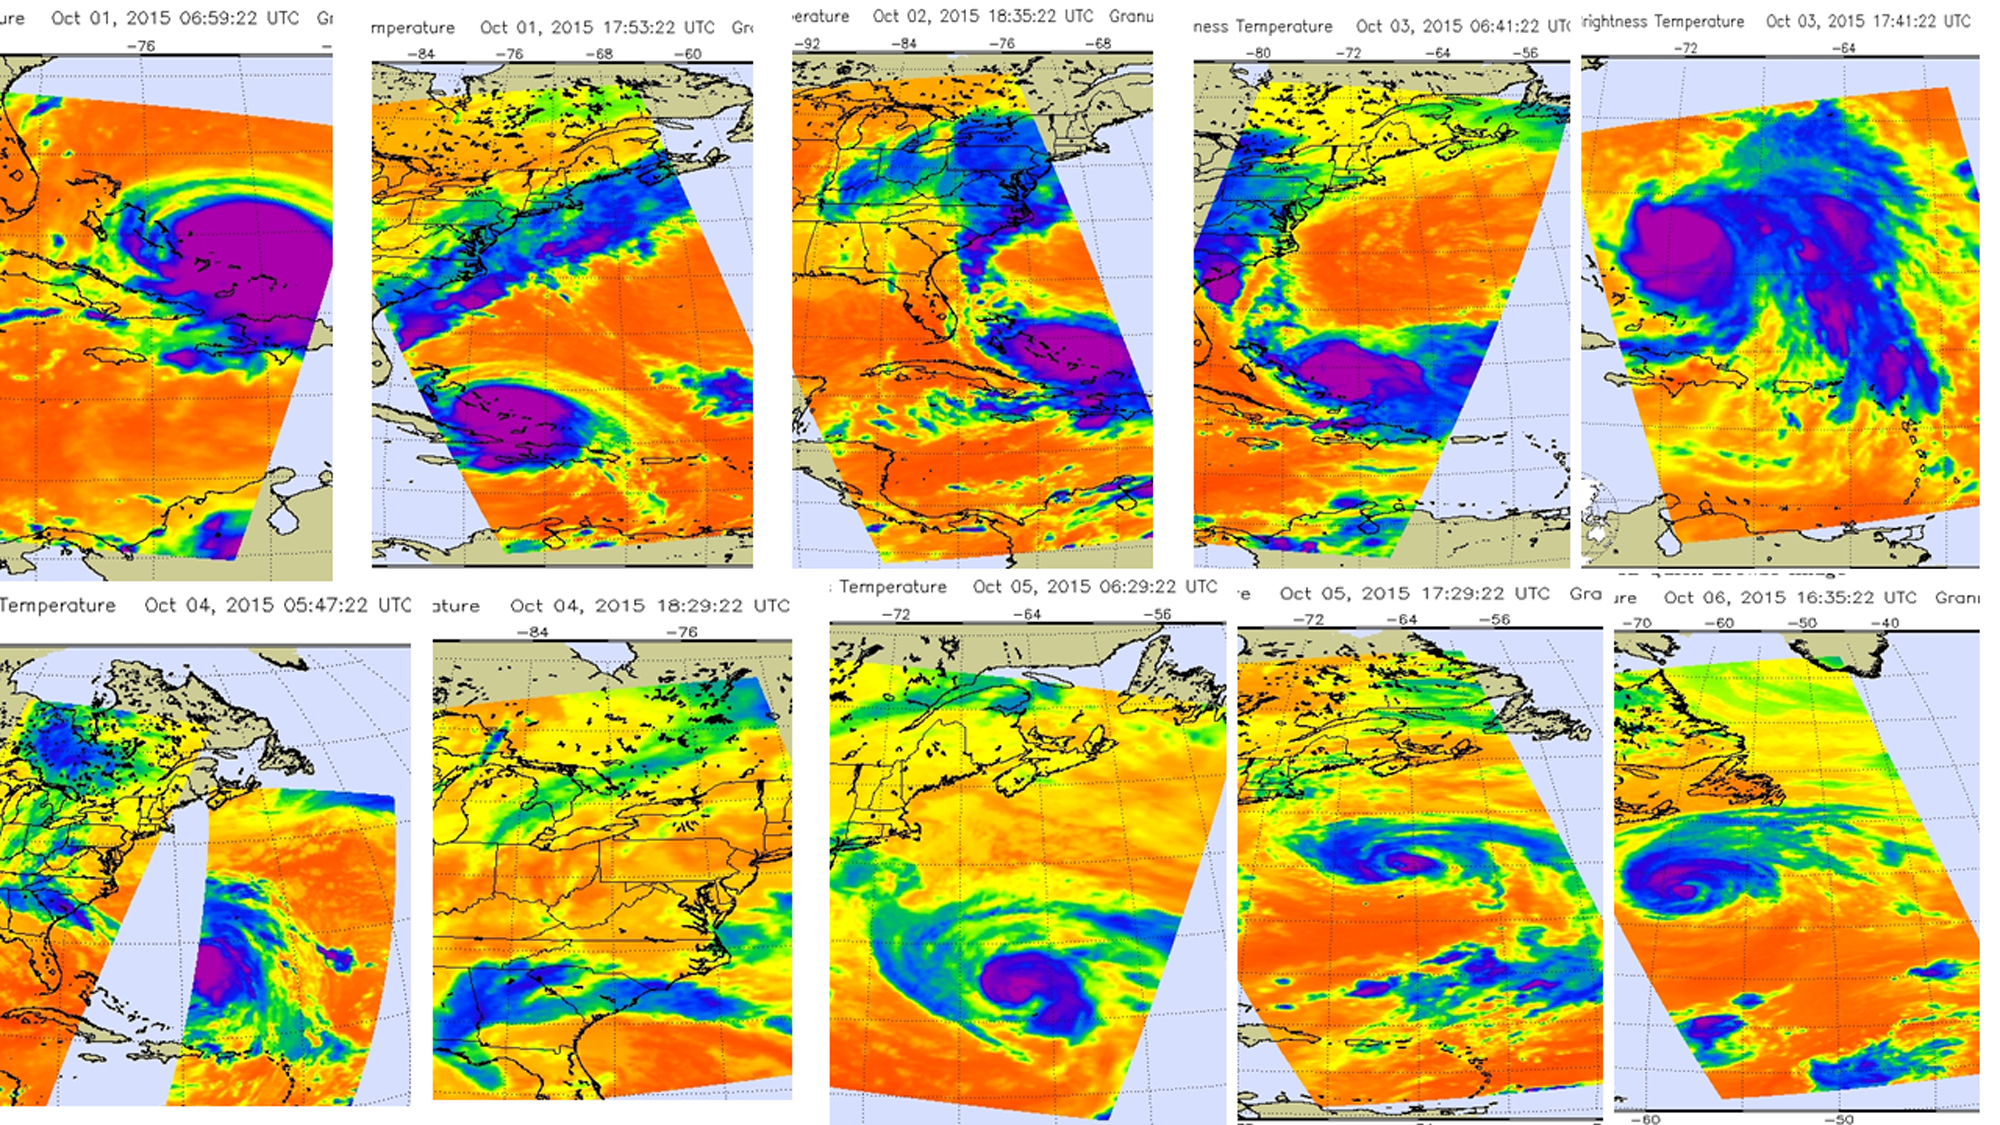
The Atmospheric Infrared Sounder or AIRS instrument flies aboard NASA’s Aqua satellite, which circles the Earth twice a day. AIRS gathers temperature data using infrared light, and took many images of Hurricane Joaquin from October 1 through October 6. NASA put together a timeline of the infrared imagery showing the movement of Hurricane Joaquin and the plume of moisture connected to the Category Four storm that streamed over South Carolina.
The AIRS imagery showed Joaquin over the Bahamas on October 1 and then as it moved north, connected with another weather system that brought intense rainfall and both inland and coastal flooding to South Carolina. That moisture plume is visible on the AIRS imagery from October 2 through October 4 where thunderstorms with very high, cold cloud tops made a line from the Bahamas to the U.S. mainland. Cloud top temperatures in the line of storms were as cold as or colder than -63 Fahrenheit/-53 Celsius. NASA research has shown that cloud tops that cold can produce heavy rain.
Cloud top temperatures around the eye of Hurricane Joaquin were even colder. Some cloud tops were in excess of -81F/-63C/210K.
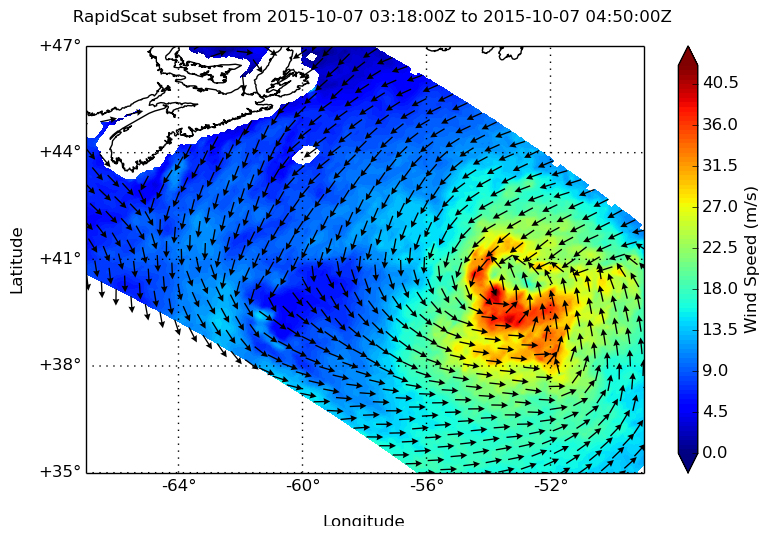
Looking at Joaquin’s Winds
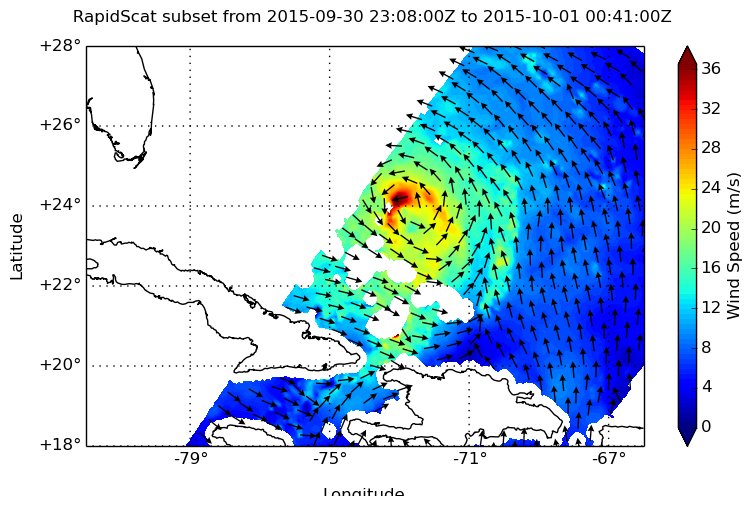
As AIRS looked at cloud top temperatures another NASA instrument looked at surface wind speed in Joaquin. On October 7 at 12:00 a.m. EDT, the RapidScat instrument that flies aboard the International Space Station saw the sustained winds in Hurricane Joaquin. Strongest winds measured 40.5 meters per second (90.6 mph/145.8 kph) in all quadrants of the storm except the northeastern quadrant where winds were less intense. RapidScat measures wind speed at the surface which is always lower than speeds at higher altitude.
Where is Joaquin Now?
At 11 a.m. EDT (1500 UTC) on October 7, 2015 the center of Tropical Storm Joaquin was located near latitude 41.0 North and longitude 45.6 West. That’s about 540 miles (870 km) southeast of Cape Race Newfoundland, Canada. Joaquin was moving toward the east-northeast near 35 mph (56 km/h) and the National Hurricane Center expects that motion to continue for the next day or two with some decrease in forward speed forecast on Friday.
Maximum sustained winds have decreased to near 70 mph (110 kph) and some weakening is forecast during the next 48 hours. Joaquin is forecast to become a large extratropical cyclone by Thursday.
Rob Gutro
NASA’s Goddard Space Flight Center
Oct. 06, 2015 – Satellites See Hurricane Joaquin Moving Through Northern Atlantic
NASA and NOAA satellites have been watching Hurricane Joaquin move to the northeast through the northern Atlantic Ocean. Although Joaquin is moving away from the U.S. and Canada it is still generating dangerous surf conditions.
The National Hurricane Center noted on October 6 that “Swells generated by Joaquin will continue to affect Bermuda the next day or so. Swells are affecting much of the mid-Atlantic and northeast coast of the United States and are increasing along coastal areas of Atlantic Canada, and these swells are expected to continue for the next day or two. Life-threatening surf and rip current conditions are likely in association with these swells.”
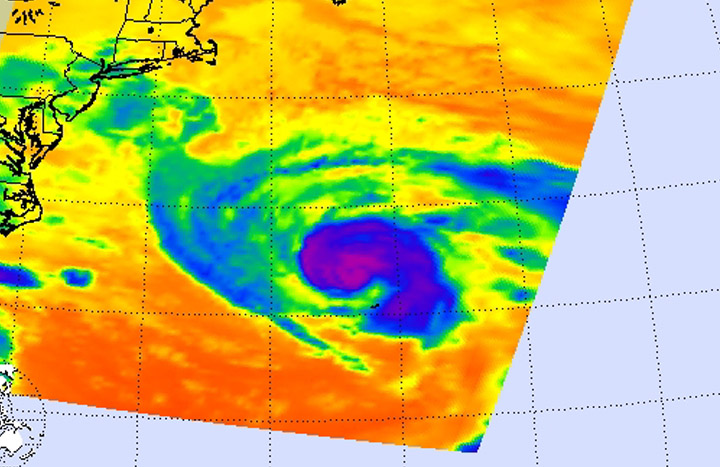
On October 6 at 0529 UTC (1:29 a.m. EDT) NASA’s Aqua satellite passed over Hurricane Joaquin and the AIRS instrument aboard captured infrared data that revealed cloud top temperatures. AIRS data was made into a false-colored image at NASA’s Jet Propulsion Laboratory in Pasadena, California. AIRS showed powerful thunderstorms around the center with cloud top temperatures near -63F/-53C.
A visible image from NOAA’s GOES-East satellite showed Hurricane Joaquin at 1445 UTC (10:45 a.m. EDT) far to the east of New England. The storm still appeared rounded with bands of thunderstorms surrounding the low-level center. The image was created by NASA/NOAA’s GOES Project at NASA’s Goddard Space Flight Center in Greenbelt, Maryland.
At 11 a.m. EDT (1500 UTC), the center of Hurricane Joaquin was located near latitude 38.3 North, longitude 59.6 West. Joaquin was moving toward the northeast near 18 mph (30 kph). The National Hurricane Center expects a turn toward the east-northeast with some further increase in forward speed expected later today through Wednesday, October 7. Maximum sustained winds have decreased to near 80 mph (130 kph) and additional slow weakening is forecast.
Joaquin is expected to become extratropical late Wednesday, October 7. That’s because of increasing southwesterly wind shear and cooler waters along Joaquin’s track. In addition, cooler and drier air to the north of the storm is expected to start affecting the circulation over the next two days, further weakening the storm.
The National Hurricane Center expects the storm to speed east across the Atlantic where it may affect Ireland and the United Kingdom by October 10.
Rob Gutro
NASA’s Goddard Space Flight Center
Oct. 05, 2015 – NASA’s Aqua and Terra Satellites Analyze Hurricane Joaquin Near Bermuda
Hurricane Joaquin maintained its comma shape as it brought heavy rains, strong winds and ocean swells to Bermuda on October 5 when NASA satellites passed overhead.

Infrared data of the hurricane was captured on Oct. 5 at 06:29 UTC (2:29 a.m. EDT) when NASA’s Aqua satellite passed overhead. The Atmospheric Infrared Sounder or AIRS instrument that flies aboard Aqua took a look at the storm’s temperatures and those of the surrounding ocean. At NASA’s Jet Propulsion Laboratory, a false-colored infrared image was created using the AIRS data that showed powerful, heavy rainmaking storms with cold cloud tops colder than -63F/-53C in a comma shape. AIRS data showed a small area of cloud tops colder than -94F/-70C just west of the center. Those powerful thunderstorms circled the center and extended east and southeast in a thick band.
Earlier, on Oct. 4, 2015 at 15:20 UTC (11:20 a.m.) the Moderate Resolution Imaging Spectroradiometer aboard NASA’s Terra satellite captured a visible image of Hurricane Joaquin that showed the northeastern quadrant of the storm was over Bermuda. The eye was still visible in the Terra image, although somewhat obscured by clouds. On October 5, microwave satellite data showed a well-defined small eye still existed, which was also seen in Bermuda Doppler radar.
At 11 a.m. EDT on October 5, a Tropical Storm Warning was still in effect for Bermuda. At that time, the center of Hurricane Joaquin was located near latitude 35.0 North and longitude 64.6 West. That’s about 185 miles (300 km) north of Bermuda. Joaquin was moving toward the north-northeast near 13 mph (20 kph), and the National Hurricane Center expects a turn toward the northeast followed by a turn toward the east-northeast on Tuesday. On the forecast track, the
center of Joaquin will continue to move away from Bermuda.
Maximum sustained winds are near 85 mph (140 kph) with higher gusts. Gradual weakening is forecast during the next 48 hours, and Joaquin is expected to transition to a large extratropical low pressure system on Wednesday, October 6. The estimated minimum central pressure is 964 millibars.
According to NHC, a sustained wind speed of 43 mph (69 kph) and a gust to 58 mph (93 kph) were reported at the Bermuda International Airport in the late morning on October 4.
Joaquin continued moving away from Bermuda but tropical storm conditions continued on the island.
Rob Gutro
NASA’s Goddard Space Flight Center
Oct. 05, 2015 – NASA IMERG Measures Historic Rainfall from a Nor’easter and Joaquin
NASA’s Integrated Multi-satellite Retrievals for the Global Precipitation Measurement mission (IMERG) data were used to estimate the historic amount of rain that fell in the Carolinas and from Hurricane Joaquin over the Bahamas.
Credits: SSAI/NASA/JAXA, Hal Pierce
Record rainfall fell over the Carolinas from September 26 to October 5 from a plume of moisture from Hurricane Joaquin when it was located over the Bahamas and moved to Bermuda. The IMERG showed highest rainfall totals near 1,000 mm (39.3 inches) in a small area of South Carolina and rainfall between 700 and 900 mm (27.5 and 37.4 inches) over a large area of South Carolina.
The analysis, created at NASA’s Goddard Space Flight Center in Greenbelt, Maryland, indicated that major Hurricane Joaquin also dropped over 700 mm (27.5 inches) and a large part of the south and central Bahamas. Hurricane Joaquin has weakened from a category four hurricane in the Bahamas and moved northeast toward Bermuda.
The South Carolina Department of Transportation noted that hundreds of roads remain closed Monday across the state. On October 5, the National Weather Service (NWS) still carried Flash Flood warnings for portions of Charleston County, Berkeley County and Dorchester County all in southeastern South Carolina. NWS in Charleston, South Carolina said on Oct. 5 at 6:58 a.m. EDT, “low pressure off the northeast South Carolina coast will move slowly offshore through Tuesday [Oct. 6].”
GPM is the Global Precipitation Measurement mission core satellite, managed by both NASA and the Japan Aerospace Exploration Agency.
Hal Pierce
NASA’s Goddard Space Flight Center
Oct. 02, 2015 – Update #2 – Hurricane Joaquin May Be Experiencing Eyewall Replacement in NASA Imagery
The National Hurricane Center indicated on October 2 that powerful Hurricane Joaquin may be experiencing eyewall replacement. The eye was visible on NASA Aqua satellite imagery October 1, but obscured twelve hours later. In addition, NASA’s RapidScat instrument helped determine what part of the storm had the strongest winds.

An Inside Look at Joaquin’s Strongest Winds
On September 30 at about 7:40 p.m. EDT, the International Space Station passed over Hurricane Joaquin in the Bahamas. The RapidScat instrument which flies aboard ISS measures sustained winds over open ocean and saw the hurricane’s strongest sustained winds in the north and northwestern quadrants, stronger than 36 meters per second (80 mph/129.6 kph).
Visible Imagery
The Moderate Resolution Imaging Spectroradiometer or MODIS instrument that flies aboard NASA’s Aqua satellite captured a visible image of Hurricane Joaquin over Bahamas on Oct. 1 at 17:55 UTC (1:55 p.m. EDT). In the image, the eye was still visible. However, twelve hours later, visible imagery from NOAA’s GOES-East satellite showed an eye obscured by clouds which forecasters at NOAA said could indicate that the eyewall of the storm was undergoing a replacement.
Eyewall Replacement
In powerful hurricanes, a new eye begins to develop around the old eye. The new eye gradually decreases in diameter and replaces the old eye. When that happens, the intensity of the hurricane usually decreases. Despite the fact that eyewall replacement can mean a weakening in a powerful hurricane, it can also spread the hurricane force winds out over a larger area.
National Hurricane Center (NHC) Forecaster Brennan noted in the 5 a.m. EDT NHC discussion on October 2,”The eye of Joaquin has not been apparent in recent infrared imagery. The last pass of the Hurricane Hunter aircraft through the center around 04Z [midnight] showed indications of a double wind maximum at flight level, which could indicate that an eyewall replacement cycle is underway. The last report from the aircraft indicated that the central pressure still around 935 millibars. The initial intensity remains 115 knots pending the arrival of the next aircraft before 12Z [8 a.m. EDT]. Some fluctuations in intensity are possible during the next 12 to 24 hours due to eyewall replacement.”
Warnings and Watches
On October 2, a Hurricane Warning was in effect for the central Bahamas, northwestern Bahamas including the Abacos, Berry Islands, Eleuthera, Grand Bahama Island, and New Providence, and The Acklins, Crooked Island, and Mayaguana in the southeastern Bahamas. A Hurricane Watch was in effect for Bimini and Andros Island.
In addition, a Tropical Storm Warning was in effect for the remainder of the southeastern Bahamas including the Turks and Caicos Islands, Andros Island, Cuban provinces of Camaguey, Los Tunas, Holguin, and Guantanamo.
Latest Update on Joaquin from the National Hurricane Center
At 8 a.m. EDT (1200 UTC), the center of Hurricane Joaquin was located near latitude 23.4 North, longitude 74.8 West. Joaquin was drifting toward the northwest near 3 mph (6 kph). The NHC expects a faster northward motion to begin later today (Oct. 2), followed by a turn toward the northeast and an increase in forward speed tonight and Saturday. On the forecast track, the core of the strongest winds of Joaquin will continue moving over portions of the central and northwestern Bahamas today. Joaquin will begin to move away from the Bahamas tonight and Saturday.
Maximum sustained winds are near 130 mph (215 kph) with higher gusts. Joaquin is a dangerous category 4 hurricane on the Saffir-Simpson Hurricane Wind Scale. Some fluctuations in intensity are possible during the next 24 hours. Slow weakening is expected to begin on Saturday.
Hurricane force winds extend outward up to 50 miles (85 km) from the center and tropical storm force winds extend outward up to 205 miles (335 km). The minimum central pressure just reported by an Air Force Reserve Hurricane Hunter aircraft is 937 millibars.
For the latest forecasts, visit the NHC website: www.nhc.noaa.gov.
The NHC noted that gradual weakening is forecast after October 3 as the cyclone encounters increasing southwesterly wind shear, but Joaquin is expected to remain a powerful hurricane for the next several days.
Rob Gutro
NASA’s Goddard Space Flight Center
October 02, 2015 – Update #1 – A 3-D Look at Hurricane Joaquin from NASA’s GPM Satellite

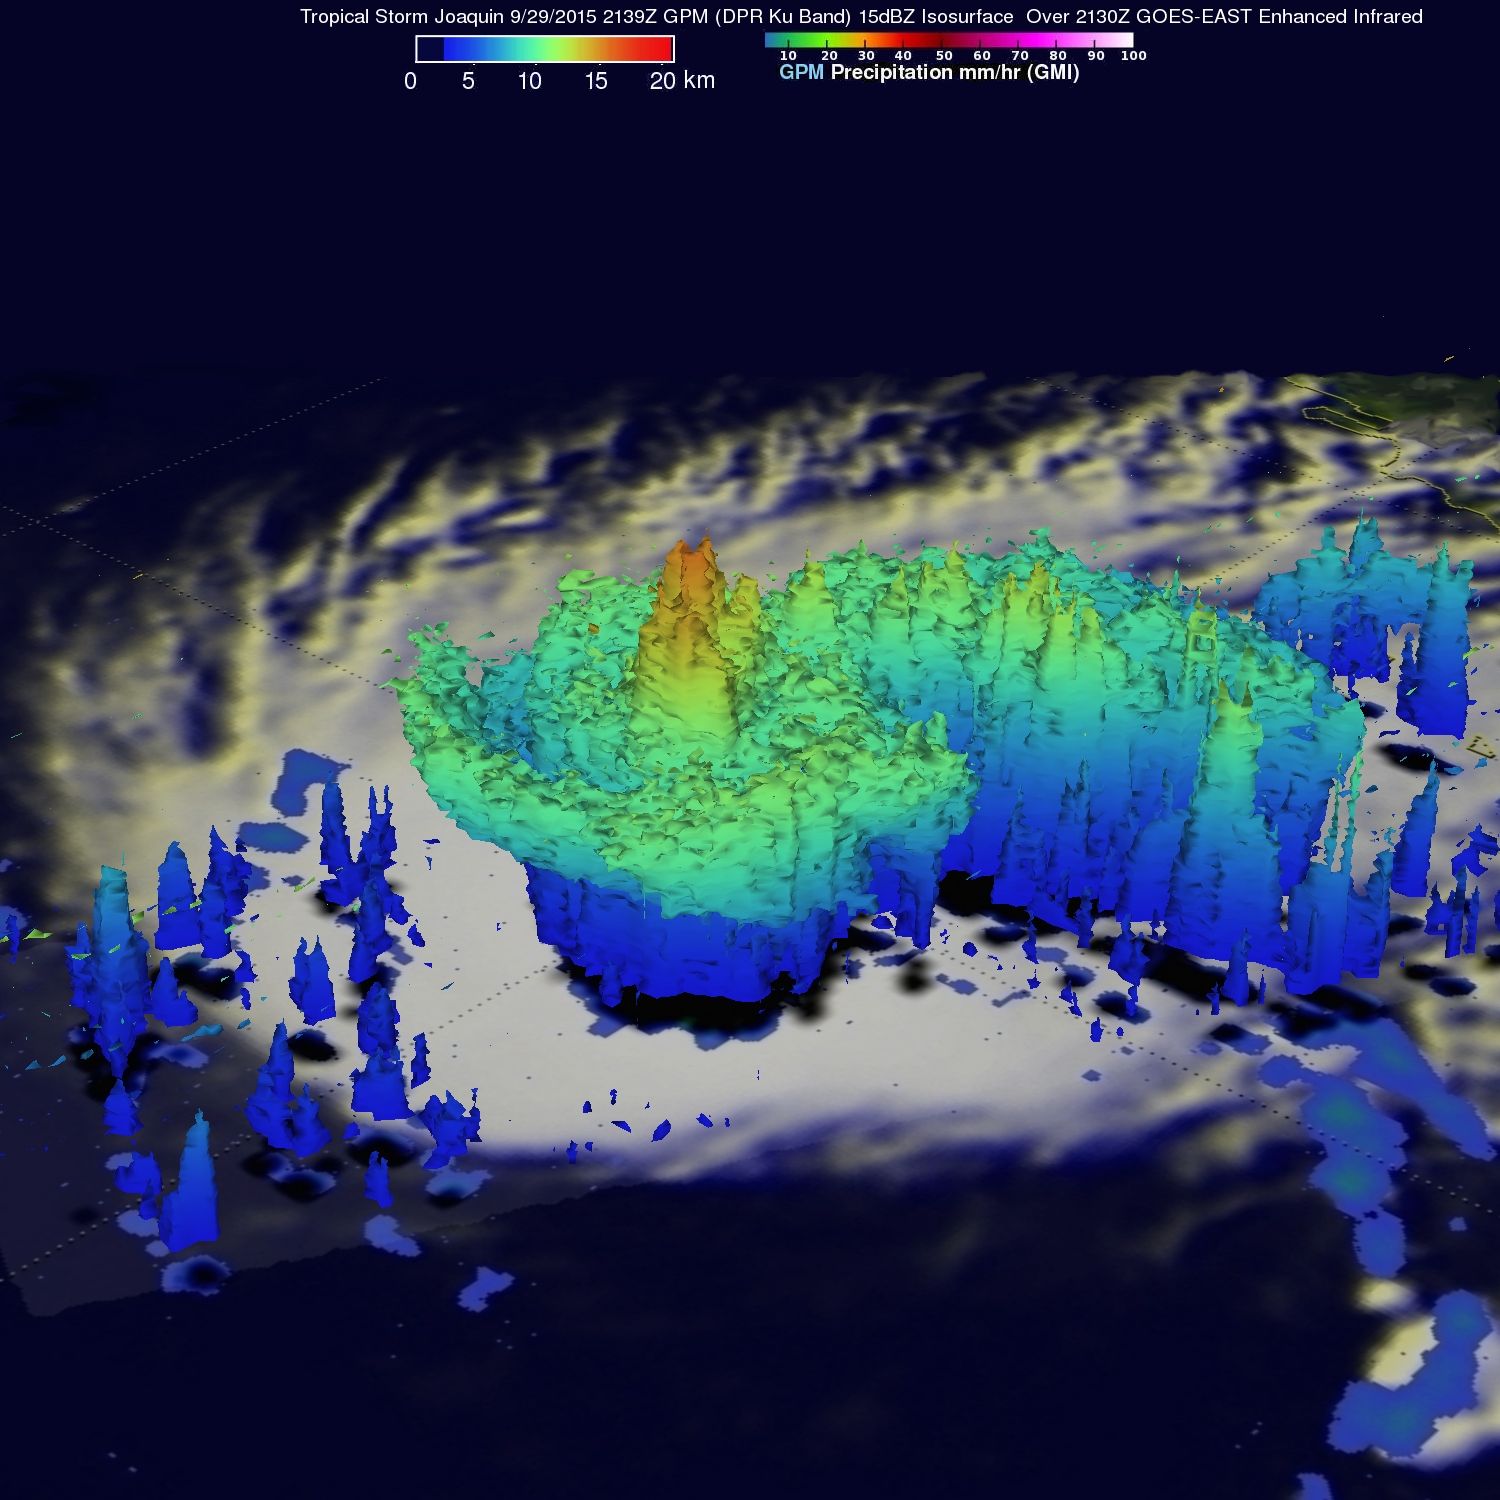
This 3-D view of Hurricane Joaquin was created using data from The Global Precipitation Measurement (GPM) Dual-frequency Precipitation Radar on September 29th, 2015 at 21:39 UTC (5:39 p.m. EDT). The visualization shows a large area of very intense rain with rain rates ranging from around 50 to 132 mm/hr (~2 to 5 inches) just to the right of the center. This is a strong indication that large amounts of heat are being released into the storm’s center, fueling its circulation and providing the means for its intensification.
Associated with the area of intense rain is an area of tall convective towers with tops reaching above 16 km (9.9 miles). The blue snow aloft shows an anvil shape with precipitation gathering to the western part of the storm. This feature indicates that vertical wind shear (difference of winds with height) is strong, and can serve to rip a storm apart.
At the time of this view, the National Hurricane Center reported that Joaquin’s maximum sustained winds had increased to 65 mph from 40 mph earlier in the day, making Joaquin a strong tropical storm but poised to become a hurricane, which occurred at 8:00 a.m. EDT.
Image: SSAI/NASA/JAXA, Hal Pierce, Text: SSAI/NASA, Steve Lang
Oct. 01, 2015 – Update #3 – Satellites Show Joaquin Become a Category 4 Hurricane
Hurricane Joaquin had become a Category 4 hurricane on the Saffir-Simpson Wind Scale by 2 p.m. EDT on Oct. 1. At NASA, satellite imagery from NOAA’s GOES-East satellite was compiled into an animation that showed the hurricane strengthening. Earlier in the day, NASA-NOAA’s Suomi NPP satellite saw powerful thunderstorms within, indicating further strengthening.
Credits: NASA/NOAA GOES Project
The GOES-East satellite is managed by NOAA, and at NASA’s GOES Project at the NASA Goddard Space Flight Center in Greenbelt, Maryland, imagery from GOES-East we compiled into an animation. The infrared and visible imagery from Sept. 29 to Oct. 1 from showed Hurricane Joaquin become a major hurricane in the Bahamas.
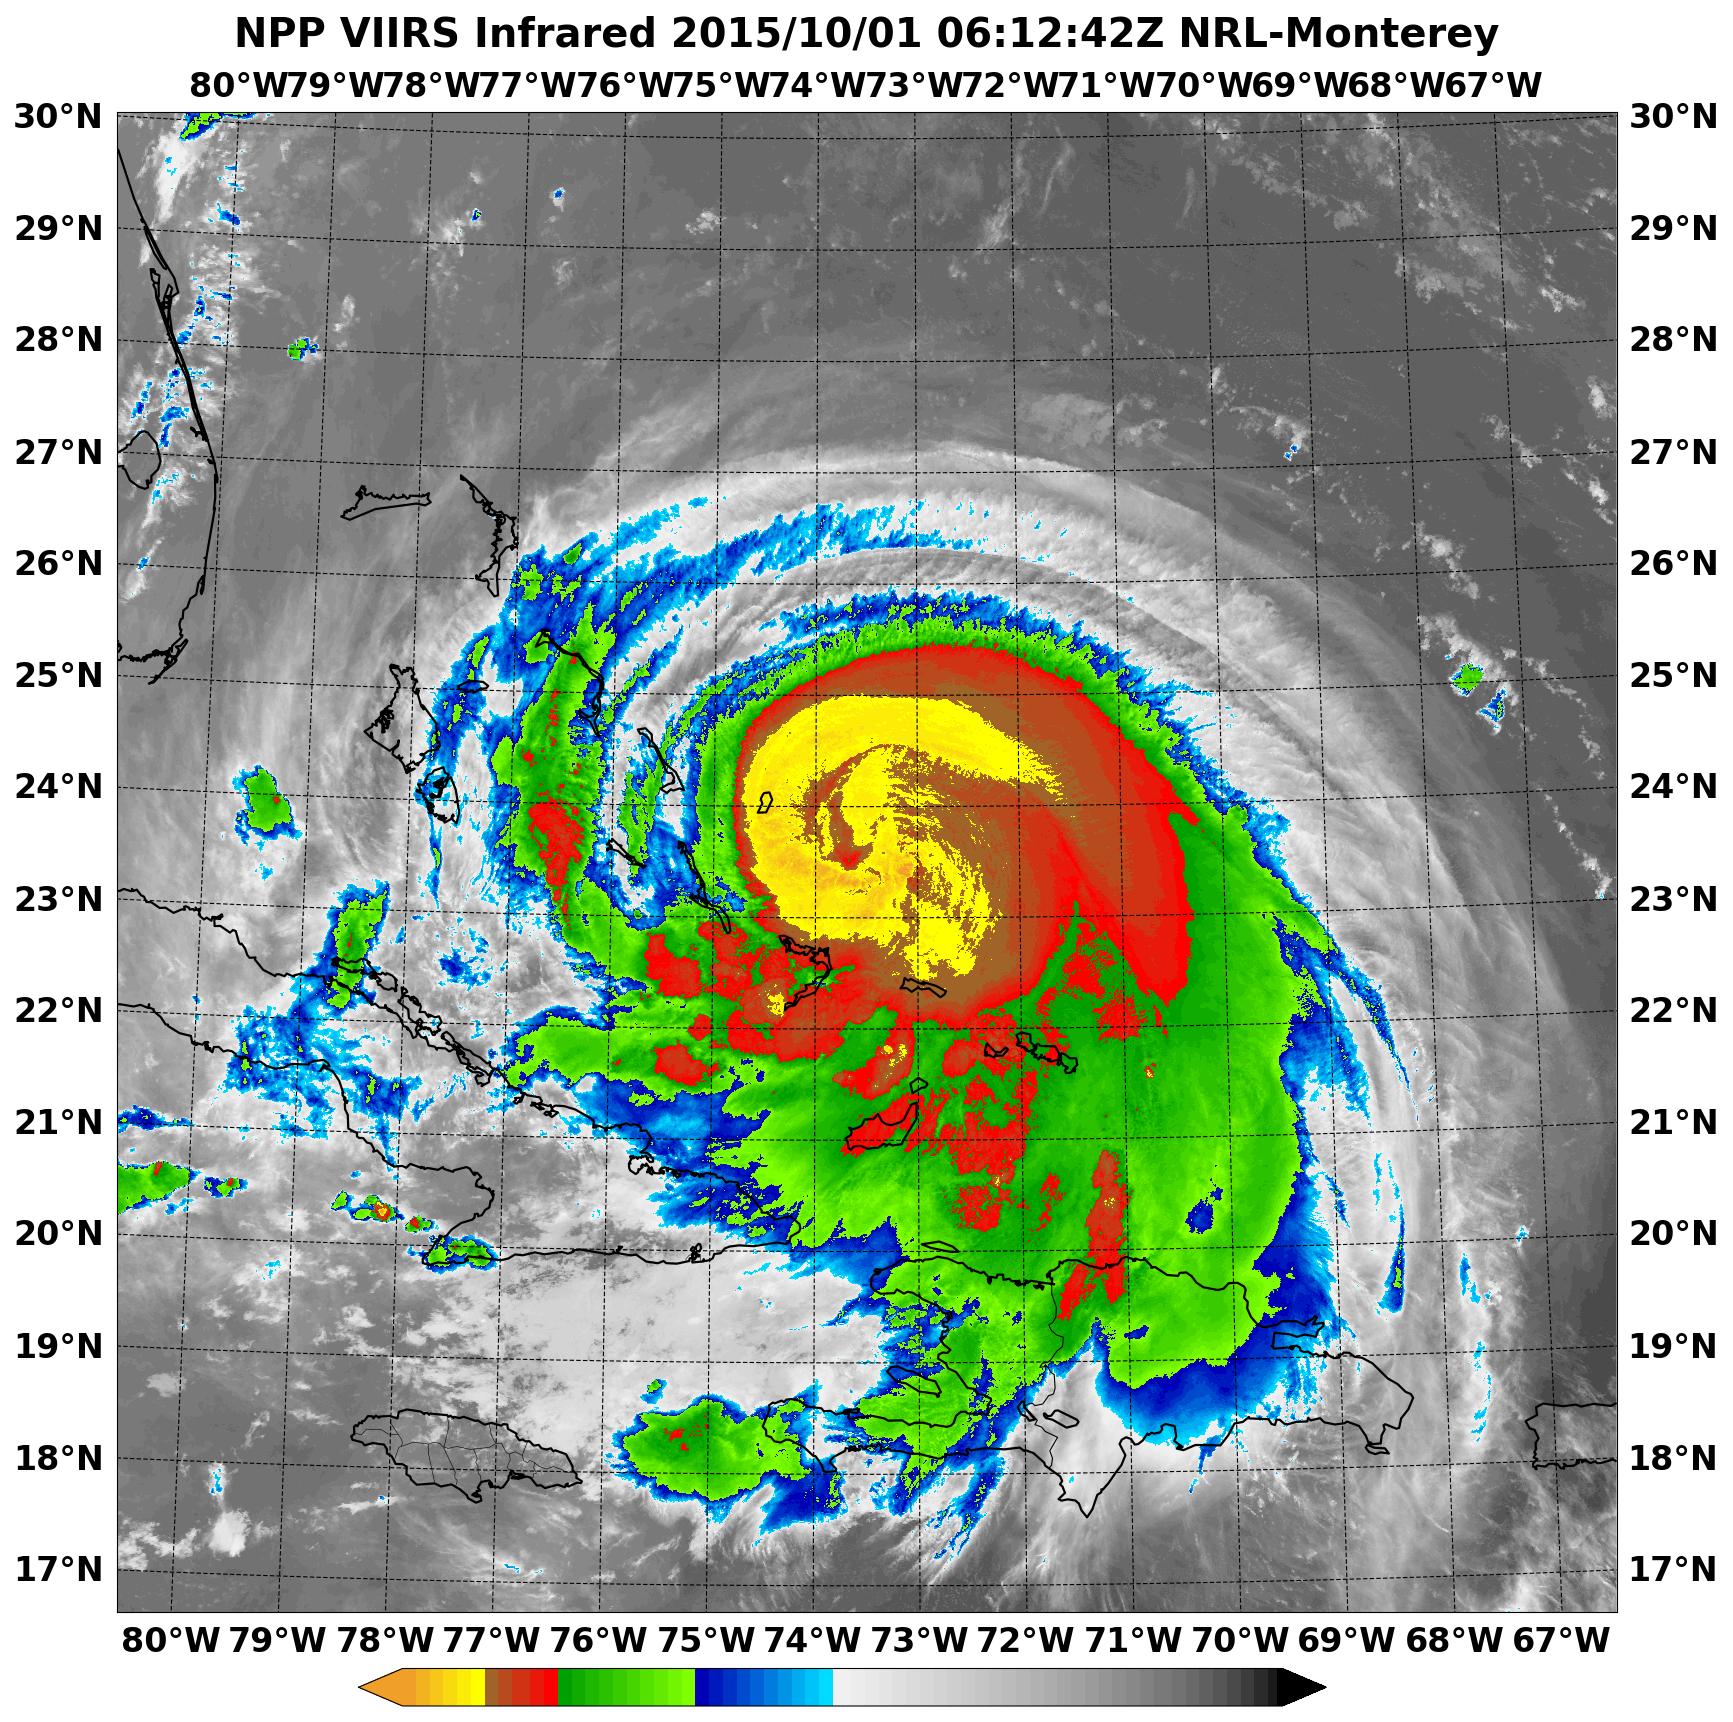
Earlier in the morning, NASA-NOAA’s Suomi NPP satellite passed over Joaquin at 06:10 UTC (2:10 a.m. EDT) as it was strengthening from a Category 2 to a Category 3 hurricane. The Visible Infrared Imaging Radiometer Suite (VIIRS) instrument aboard captured an infrared image that showed cloud top temperatures colder than -63F/-53C, indicative of powerful storms within the hurricane. NASA research has shown that storms with cloud tops that high (and that stretch that high into the troposphere) have the capability to generate heavy rain.
On Oct. 1, a Hurricane Warning was in effect for the Central Bahamas, Northwestern Bahamas including the Abacos, Berry Islands, Eleuthera, Grand Bahama Island, and New Providence, The Acklins, Crooked Island, and Mayaguana in the southeastern Bahamas. A Hurricane Watch was in effect for Bimini and Andros Island, and a Tropical Storm Warning was in effect for the remainder of the southeastern Bahamas excluding the Turks and Caicos Islands and Andros Island.
At 2 p.m. EDT (1800 UTC), the center of Hurricane Joaquin was located near latitude 23.0 North, longitude 74.2 West. Joaquin was moving generally southwestward at about 6 mph (9 kph), and the National Hurricane Center forecast a turn toward the northwest and north on Friday, Oct. 2. On the forecast track, the center of Joaquin will move near or over portions of the central Bahamas today and tonight and pass near or over portions of the northwestern Bahamas on Friday, Oct. 2.
Reports from an Air Force Reserve Hurricane Hunter aircraft indicated that maximum sustained winds have increased to near 130 mph (210 kph) with higher gusts. Joaquin is now a category 4 hurricane on the Saffir-Simpson Hurricane Wind Scale. Some additional strengthening is possible during the next 24 hours, with some fluctuations in intensity possible Friday night and Saturday.
Hurricane force winds extend outward up to 45 miles (75 km) from the center and tropical storm force winds extend outward up to 140 miles (220 km).
The latest minimum central pressure extrapolated from Hurricane Hunter aircraft data is 936 millibars. For effects on the Bahamas, updates to forecasts, watches and warnings, visit the National Hurricane Center website: www.nhc.noaa.gov.
The NHC updated forecast takes Joaquin on a more northerly track from Saturday, Oct. 3 through Tuesday, October 6 toward Long Island, New York. Tracks and forecasts are subject to change.
Rob Gutro
NASA’s Goddard Space Flight Center
Update #2 – NASA Provides Various Views of Hurricane Joaquin
Hurricane Joaquin continued to intensify in the Bahamas on October 1 and NASA and NOAA satellites have been providing valuable data on the storm. NASA’s GPM and Terra satellites and NOAA’s GOES-East satellite provided rainfall, cloud extent, cloud height and other data to forecasters. Joaquin became a major hurricane today, Oct. 1, reaching Category 3 status on the Saffir-Simpson Wind Scale.

NASA/JAXA’s GPM satellite provided a 3-D side view of Tropical Storm Joaquin on Sept. 29 showing the internal precipitation structure. The image showed very high thunderstorms with frozen precipitation in the cloud tops. Those storms were dropping heavy rainfall. GPM data identified the areas of heaviest precipitation in Joaquin.
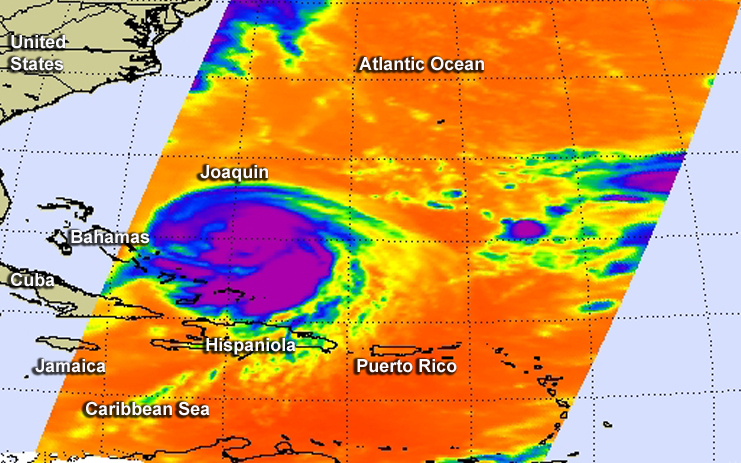
On Sept. 30 at 15:45 UTC (11:45 a.m. EDT) the Moderate Resolution Imaging Spectroradiometer or MODIS instrument aboard NASA’s Terra satellite saw Hurricane Joaquin off the Bahamas. The visible image showed that an eye was beginning to form and that bands of thunderstorms were wrapping into the low-level center from the south.
On Oct. 1 at 1330 UTC (9:30 a.m. EDT) NOAA’s GOES-East satellite captured this visible image of Hurricane Joaquin covering the southern Bahamas and extending over southeastern Cuba, and the island of Hispaniola (which includes Haiti and the Dominican Republic). Joaquin’s eye had become completely visible now that the storm had reached Category 3 status.
On Oct. 1, a Hurricane Warning was in effect for the Central Bahamas, Northwestern Bahamas including the Abacos, Berry Islands, Eleuthera, Grand Bahama Island, and New Providence, The Acklins, Crooked Island, and Mayaguana in the southeastern Bahamas. A Hurricane Watch was in effect for Bimini and Andros Island, and a Tropical Storm Warning was in effect for the remainder of the southeastern Bahamas excluding the Turks and Caicos Islands and Andros Island.
According to NHC, at 8 a.m. EDT (1200 UTC), the center of Hurricane Joaquin was located near latitude 23.2 North, longitude 73.7 West. That’s just 10 miles (15 km) north of Samana Cays, Bahamas and about 75 miles (120 km) southeast of San Salvador, Bahamas.

Joaquin was moving toward the west-southwest near 5 mph (7 kph), and this motion is expected to continue today. NHC noted that a turn toward the west- northwest is forecast tonight (Oct. 1), followed by a turn toward the north and an increase in forward speed on Friday, Oct. 2. On the forecast track, the center of Joaquin will move near or over portions of the central Bahamas today and tonight and pass near or over portions of the northwestern Bahamas on Friday.
Maximum sustained winds are near 120 mph (195 km/h) with higher gusts. Joaquin is a category 3 hurricane on the Saffir-Simpson Hurricane Wind Scale. Some strengthening is forecast in the next day or so, with some fluctuations in intensity possible on Friday. Hurricane force winds extend outward up to 35 miles (55 km) from the center and tropical storm force winds extend outward up to 140 miles (220 km).
The minimum central pressure just extrapolated by an Air Force Reserve Hurricane Hunter aircraft is 942 millibars.
For updated forecasts, watches and warnings visit the National Hurricane Center (NHC) website: www.nhc.noaa.gov.
Rob Gutro
NASA’s Goddard Space Flight Center
Oct. 01 2015 – Update #1 – Animation of Tropical Storm Joaquin Intensifying Near Bahamas
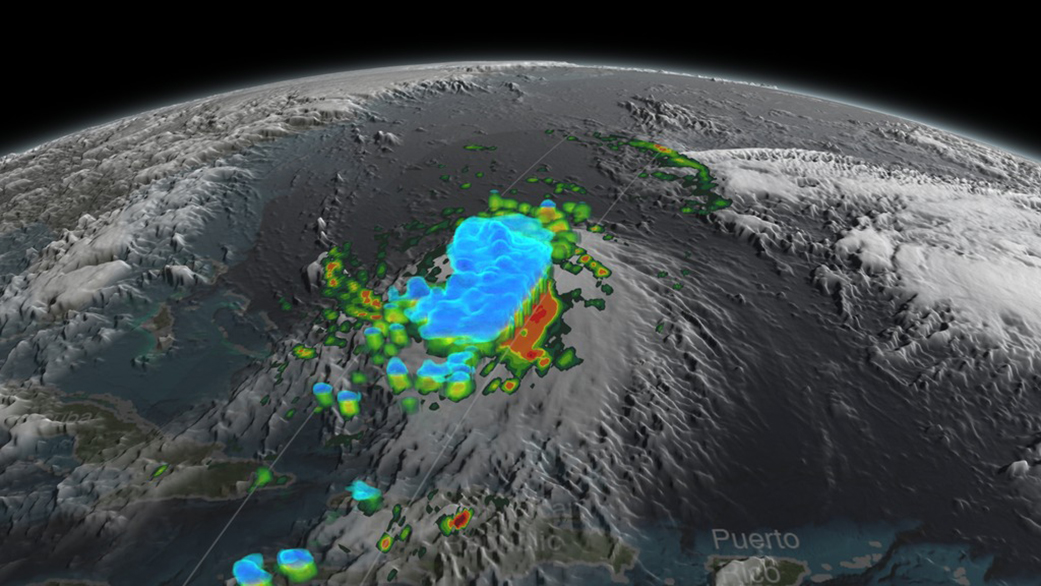
This visualization of Joaquin was made from data obtained by NASA/JAXA’s Global Precipitation Measurement (GPM) mission core satellite. The animation shows rain rates and cloud heights in Joaquin just before it intensified into a hurricane.
Joaquin became a tropical storm Monday evening (EDT), Sept. 28, when it was midway between the Bahamas and Bermuda. By September 30 it strengthened into a hurricane, the 3rd of the season.
GPM captured Joaquin Tuesday, Sept. 29th at 21:39 UTC (5:39 pm EDT) as the hurricane moved slowly towards the west-southwest about 400 miles east of the northwestern Bahamas. At the time, Joaquin had been battling northerly wind shear, which was impeding the storm’s ability to strengthen. However, compared to earlier in the day, the system was beginning to gain the upper hand as the shear began to relax its grip. At the time of this data visualization, Joaquin’s low-level center of circulation was located further within the cloud shield, and the rain area was beginning to wrap farther around the center on the eastern side of the storm while showing signs of increased banding and curvature, a sure sign that Joaquin’s circulation was intensifying. GPM shows a large area of very intense rain with rain rates ranging from around 50 to 132 mm/hr (~2 to 5 inches, shown in red and magenta) just to the right of the center. This is a strong indication that large amounts of heat are being released into the storm’s center, fueling its circulation and providing the means for its intensification. Associated with the area of intense rain is an area of tall convective towers, known as a convective burst, with tops reaching up to 16.3 km (shown in orange). These towers when located near the storm’s core are a strong indication that the storm is poised to strengthen as they too reveal the release of heat into the storm.
At the time this data was taken, the National Hurricane Center reported that Joaquin’s maximum sustained winds had increased to 65 mph from 40 mph earlier in the day, making Joaquin a strong tropical storm but poised to become a hurricane, which occurred this morning at 8:00 am EDT. With the inhibiting wind shear expected to continue to diminish and the system moving over warm waters, the National Hurricane Center is forecasting Joaquin to intensify further, possibly into a major hurricane within the next few days.
Stephen Lang
SSAI/NASA’s Goddard Space Flight Center
Sept. 30, 2015 – NASA Satellites Gather Data on Hurricane Joaquin
The Global Precipitation Measurement or GPM Core satellite and NASA’s Aqua satellite passed over Hurricane Joaquin and looked at rainfall, cloud height and extent, revealing heavy rainfall and a more organized system than the previous day.
Joaquin became a tropical storm Monday evening (EDT), September 29 when it was midway between the Bahamas and Bermuda. By 8 a.m. EDT on Sept. 30, it strengthened into a hurricane and has become the third hurricane of the Atlantic Hurricane season.
On Sept. 30, the National Hurricane Center issued a Hurricane Warning for the central Bahamas including Cat Island, the Exumas, Long Island, Rum Cay, and San Salvador. A Hurricane Watch is in effect for the northwestern Bahamas including the Abacos, Berry Islands, Bimini, Eleuthera, Grand Bahama Island, and New Providence, but excluding Andros Island.
GPM captured an image of Joaquin at 21:39 UTC (5:39 p.m. EDT) on Sept. 29 as Joaquin was moving very slowly towards the west-southwest about 400 miles east of the northwestern Bahamas. Rainfall rates were determined using two instruments aboard GPM. GPM’s microwave imager (GMI) provided rainfall rates from the outer swath and Dual-frequency Precipitation Radar (DPR) space-borne precipitation radar provided data on the inner area.
At the time Joaquin had been battling northerly wind shear, which was impeding the storm’s ability to strengthen. However, compared to earlier in the day, the system was beginning to gain the upper hand as the shear began to relax its grip.
Credits: SSAI/NASA/JAXA, Hal Pierce
“Joaquin’s low-level center of circulation was located further within the cloud shield, and the rain area was beginning to wrap farther around the center on the eastern side of the storm while showing signs of increased banding and curvature, a sure sign that Joaquin’s circulation was intensifying,” said Steve Lang, research meteorologist at NASA’s Goddard Space Flight Center.
GPM Shows Intense Rain
GPM showed a large area of very intense rain with rain rates ranging from around 50 to 132 mm/hour (~2 to 5 inches) just to the right of the center. This is a strong indication that large amounts of heat are being released into the storm’s center, fueling its circulation and providing the means for its intensification. A 3-D view of Joaquin was created at NASA Goddard using GPM’s DPR space-borne radar. Associated with the area of intense rain is an area of tall convective towers, known as a convective burst, with tops reaching up to 16.3 km (10.1 miles). These towers when located near the storm’s core are a strong indication that the storm is poised to strengthen as they, too, reveal the release of heat into the storm.
At the time GPM passed over Joaquin, the National Hurricane Center reported that Joaquin’s maximum sustained winds had increased to 65 mph from 40 mph earlier in the day, making Joaquin a strong tropical storm. GPM is a joint mission between NASA and the Japanese space agency JAXA.

Joaquin on September 30
At 11 a.m. EDT (1500 UTC) on Wednesday, Sept. 30, 2015 the center of Hurricane Joaquin was located near latitude 24.7 North, longitude 72.6 West. That puts the center of Joaquin about 215 miles (345 km) east-northeast of the Central Bahamas.
Joaquin was moving toward the southwest near 6 mph (9 kph). The National Hurricane Center expects Joaquin to turn toward the northwest and a decrease in forward speed on Oct. 1. The center of Joaquin is expected to move near or over portions of the central Bahamas tonight (Sept. 30) and Thursday (Oct. 1).
Maximum sustained winds have increased to near 80 mph (130 kph) with higher gusts and additional strengthening is expected. Joaquin could become a major hurricane during the next couple of days.
Hurricane force winds extend outward up to 35 miles (55 km) from the center and tropical storm force winds extend outward up to 125 miles (205 km). The minimum central pressure estimated from the Hurricane Hunter aircraft data is 971 millibars. For updated forecasts, watches and warnings, visit the National Hurricane Center website: www.nhc.noaa.gov.
Infrared Data Shows Powerful Storms
On Sept. 30 at 2:11 a.m. EDT the Atmospheric Infrared Sounder or AIRS instrument aboard NASA’s Aqua satellite provided an infrared look at Hurricane Joaquin. AIRS data showed strongest storms with coldest cloud tops were around the center of circulation and in a thick band of thunderstorms wrapping into the center from the south. Cloud top temperatures were as cold as -63 Fahrenheit/-53 Celsius, indicative of strong storms with the potential for heavy rain.
Swells generated by Joaquin will affect portions of the Bahamas during the next few days, and will begin to affect portions of the southeastern coast of the United States by Thursday. These swells are likely to cause life-threatening surf and rip current conditions.
With the inhibiting wind shear expected to continue to diminish and the system moving over warm waters, the National Hurricane Center is forecasting Joaquin to intensify farther, possibly into a major hurricane within the next few days.
There is still some uncertainty in the forecast track. Joaquin is expected to continue moving toward the Bahamas for the next day, taking the center very close to the islands, before turning northward ahead of an upper-level trough over the Southeast U.S. All interests should pay close attention to the latest developments from the National Hurricane Center.
Steve Lang
SSAI/NASA’s Goddard Space Flight Center
Sept. 29, 2015 – Update #2 – NASA Sees Wind Shear Affecting Tropical Storm Joaquin
Despite being battered with vertical wind shear, Tropical Depression 11 strengthened and organized into Tropical Storm Joaquin. NASA’s Aqua satellite and NOAA’s GOES satellite both captured images of the slightly elongated storm near the Bahamas.
On Monday, Sept. 28, NASA’s Aqua satellite passed over Tropical Depression 11 at 17:23 UTC (1:23 p.m. EDT). The Atmospheric Infrared Sounder or AIRS instrument analyzed the storm in infrared light, providing temperature data to forecasters. AIRS showed that bands of thunderstorms southeast of the center had cloud top temperatures as cold as -63F/-53C, indicating strong storms. NASA research has shown that storms that high in the troposphere (lowest layer of the atmosphere) have the capability to generate heavy rain.
At 11 p.m. EDT on Sept. 28, Tropical Depression 11 strengthened into Tropical Storm Joaquin.
At 5 a.m. EDT (0900 UTC) on Tuesday, Sept. 29, 2015 the center of Tropical Storm Joaquin was located near latitude 26.6 North, longitude 70.6 West. That’s about 385 miles (.620 km) northeast of the central Bahamas. Joaquin was moving toward the west near 5 mph (7 km/h), and this general motion is expected to continue through Wednesday. The National Hurricane Center expects a decrease in forward speed and a turn toward the west-northwest by Wednesday night.
Maximum sustained winds are near 40 mph (65 km/h) with higher gusts. Slow strengthening is forecast during the next 48 hours. Tropical storm force winds extend outward up to 70 miles (110 km) from the center. The estimated minimum central pressure is 1002 millibars. There are no coastal watches or warnings in effect.
Forecaster Brennan of the National Hurricane Center (NHC) noted on September 29, that the low-level center of Joaquin remains exposed on the northwestern edge of the deep convection (clouds and thunderstorms) due to about 20 knots of vertical wind shear.
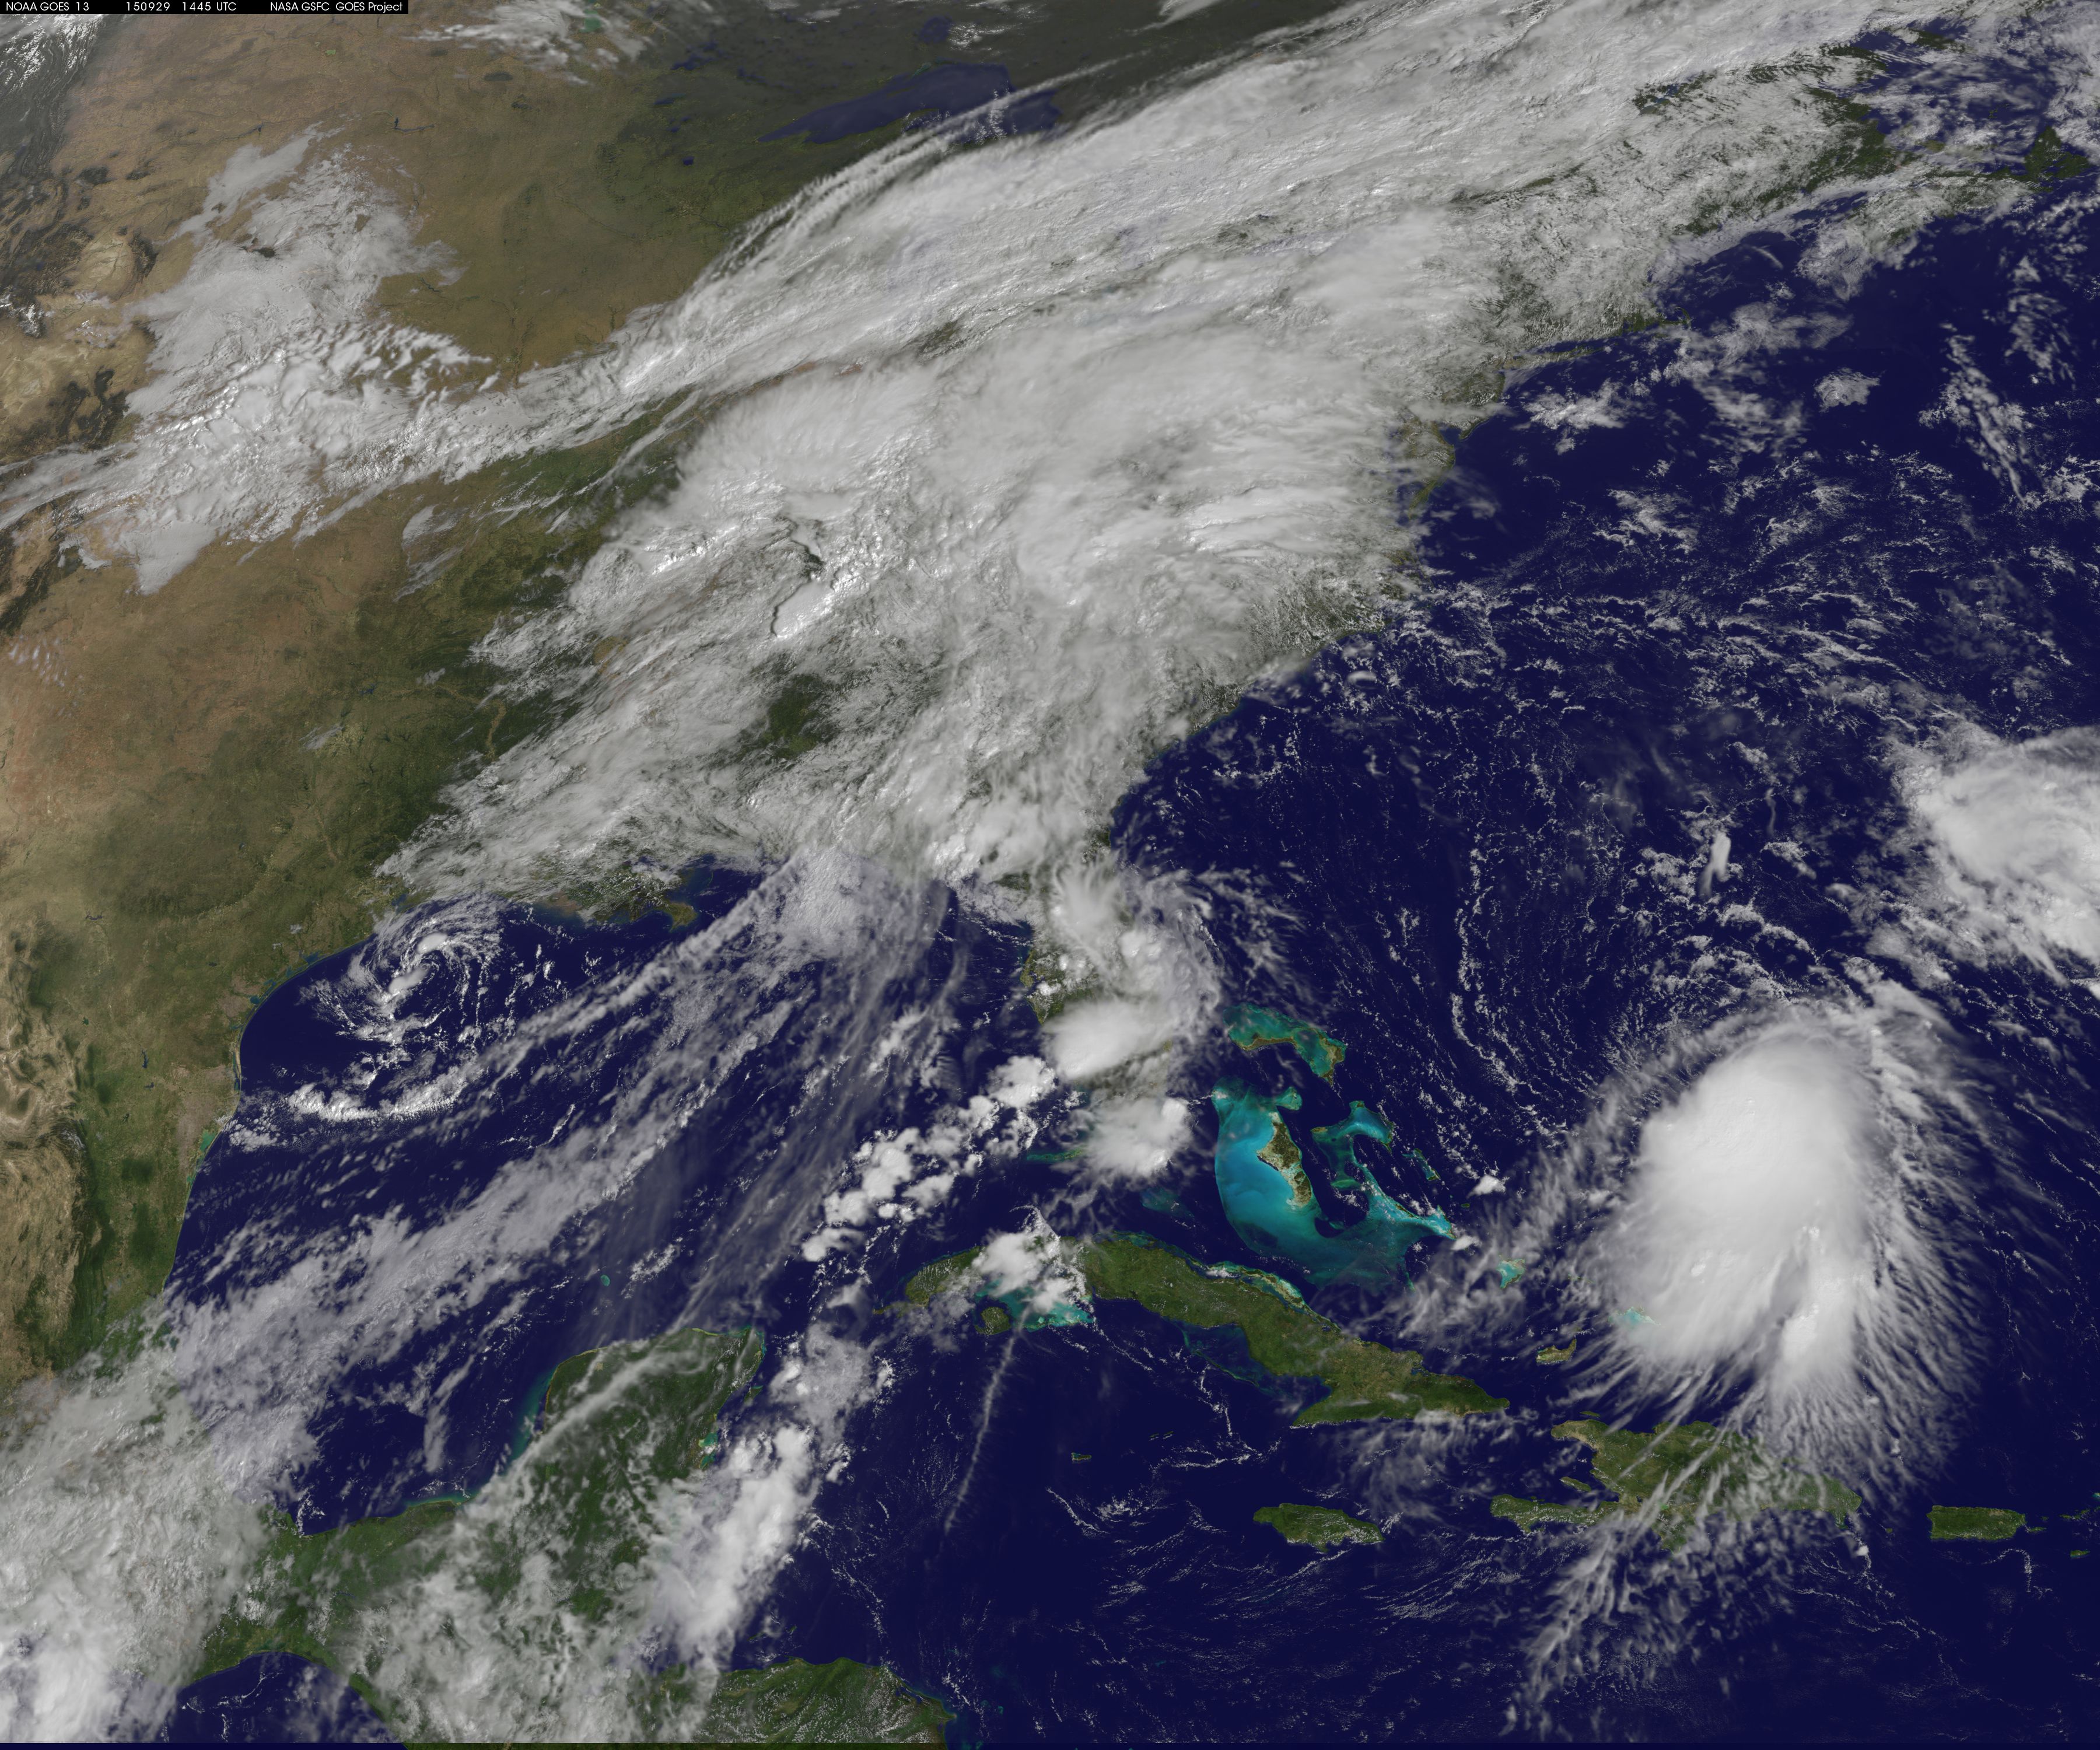
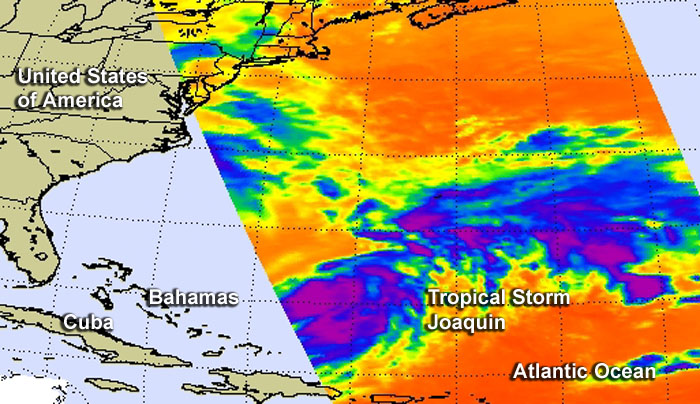
NOAA’s GOES-East satellite captured a visible image of Tropical Storm Joaquin east of the Bahamas on Sept. 29 at 1400 UTC (10 a.m. EDT). In the image, Joaquin continued to appear slightly elongated which is attributed to vertical wind shear. Vertical wind shear continued to push clouds south and east of the center of circulation. The image was created by the NASA/NOAA GOES Project at NASA’s Goddard Space Flight Center in Greenbelt, Maryland.
NHC expects Joaquin to track to the west and then turn northward on Thursday, Oct. 1.
For updated forecasts, visit the National Hurricane Center website: www.nhc.noaa.gov.
Rob Gutro
NASA’s Goddard Space Flight Center
Sept. 29, 2015 – Update #1 – NASA’s GPM Sees Tropical Storm Joaquin Form in Western Atlantic
Tropical Storm Joaquin became the 10th named storm of the season after forming late last night (Sept. 28 EDT) in the western Atlantic midway between the Bahamas and Bermuda from what was previously a tropical depression (#11), which itself had formed a day earlier from an area of low pressure that had been lingering in the region since Saturday.
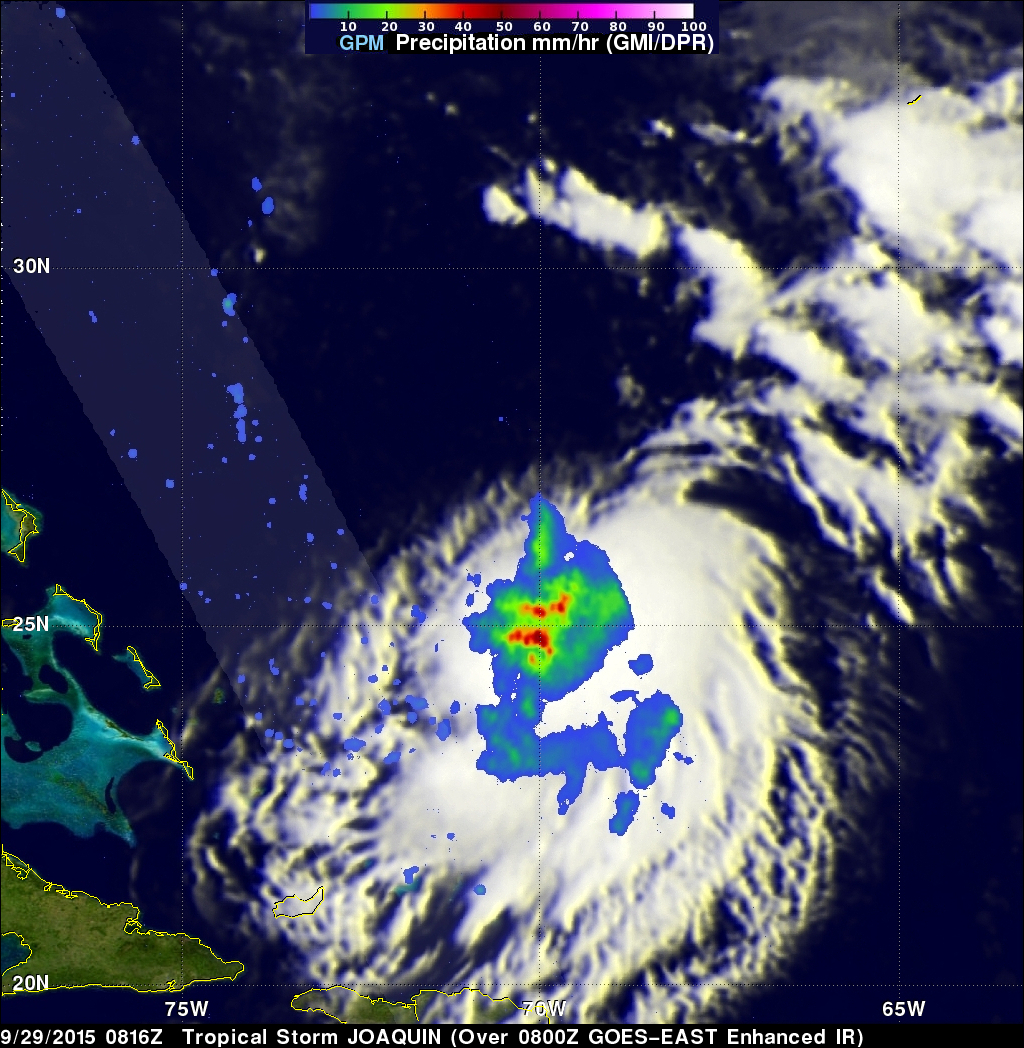
The Global Precipitation Measurement (GPM) mission core satellite captured an image of Joaquin early this morning at 8:16 UTC (4:16 am EDT) on the 29th of September as the storm was slowly drifting westward about 390 miles east of the northern Bahamas. The image showed rain rates derived from the GPM GMI (outer swath) and DPR (inner swath) overlaid on IR data from the GOES-East satellite. At the time, the low-level center of circulation was located on the northwest edge of the rain area, which reveals the presence of northwesterly shear as reported by the National Hurricane Center (NHC).
Within Joaquin’s rain field there are areas of heavy rain with rates of up to 60 mm/hr (~2.4 inches/hr). There is also some evidence of weak banding in the rain features, which is consistent with a weak but established cyclonic wind circulation. Near the time of GPM’s pass over the storm, Joaquin’s maximum sustained winds were reported 40 mph by NHC, making it a weak tropical storm. The shear, which is currently inhibiting the storm’s ability to strengthen is expected to continue for the next day or so before diminishing, which could then allow Joaquin to strengthen.
NHC is forecasting Joaquin to become a strong tropical storm in about 2 days as it continues slowly westward towards the Bahamas before turning northward ahead of an upper-level trough over the Southeast U.S. At the moment, Joaquin is not expected to reach the Bahamas and to parallel the U.S. East Coast off shore; however, there is still some uncertainty in the forecast at this point.
GPM is a joint mission between NASA and the Japanese space agency JAXA.
Stephen Lang
SSAI/NASA Goddard Space Flight Center
Sept. 28, 2015 – NASA Views New Atlantic Tropical Depression in Infrared
The eleventh tropical depression of the Atlantic Ocean formed early on September 28 over 400 miles southwest of Bermuda as NASA’s Aqua satellite passed overhead and looked at the storm in infrared light.
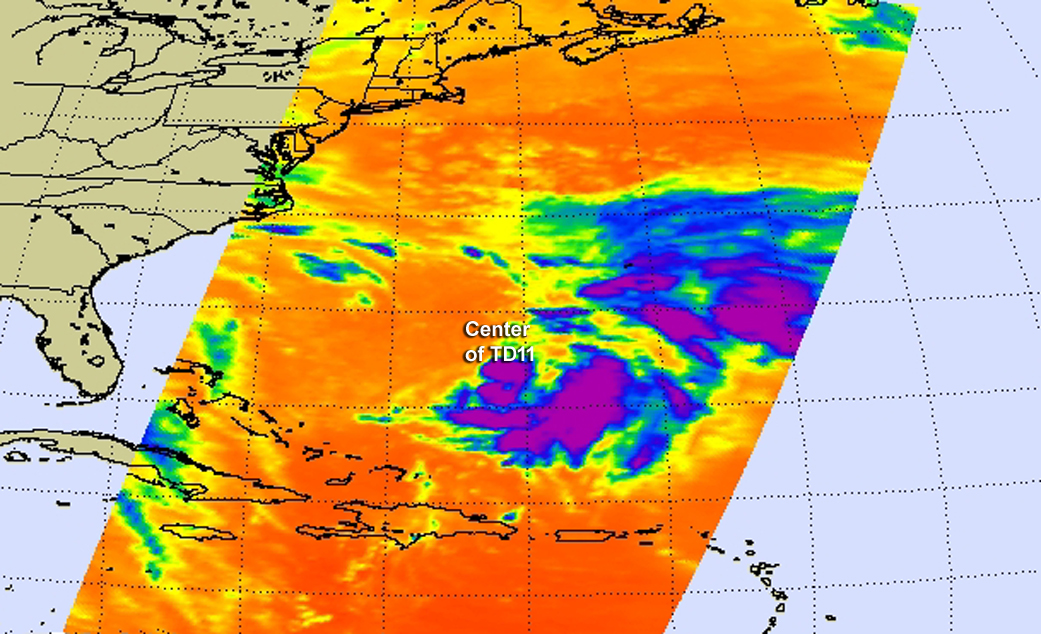
The Atmospheric Infrared Sounder or AIRS instrument that flies aboard NASA’s Aqua satellite gathers data in infrared light that provides information about temperatures. The colder the cloud top temperature, the higher the storms are in the troposphere (because the higher you go in the troposphere, the colder it gets). When storms get very high, cloud top temperatures get as cold or colder than -63 Fahrenheit/-53 Celsius, which is what AIRS data showed east and south of the center of newborn Tropical Depression 11 (TD11) Sept. 28 at 623 UTC (2:23 a.m. EDT). Storms with cloud top temperatures that high have been shown to produce heavy rainfall.
At 11 a.m. EDT (1500 UTC), the center of Tropical Depression Eleven was located near latitude 27.8 North, longitude 69.6 West. That’s about 425 miles (680 km) southwest of Bermuda. The depression was moving toward the west-northwest near 5 mph (7 kph) and the National Hurricane Center (NHC) forecasts a slow west-northwestward to northwestward motion during the next couple of days.
Maximum sustained winds were near 35 mph (55 kph) with higher gusts AND Strengthening is forecast. The NHC expects the depression to become a tropical storm later in the day.