


CORRECTION (Earth’s distance from the Milky Way’s center was erroneously reported. 150,000 trillion miles is the correct distance.)
A new visualization provides an exceptional virtual trip — complete with a 360-degree view — to the center of our home galaxy, the Milky Way. This project, made using data from NASA’s Chandra X-ray Observatory and other telescopes, allows viewers to control their own exploration of the fascinating environment of volatile massive stars and powerful gravity around the monster black hole that lies in the center of the Milky Way.
The Earth is located about 26,000 light years, or about 150,000 trillion miles, from the center of the Galaxy. While humans cannot physically travel there, scientists have been able to study this region by using data from powerful telescopes that can detect light in a variety of forms, including X-ray and infrared light.
This visualization builds on infrared data with the European Southern Observatory’s Very Large Telescope of 30 massive stellar giants called Wolf-Rayet stars that orbit within about 1.5 light years of the center of our Galaxy. Powerful winds of gas streaming from the surface of these stars are carrying some of their outer layers into interstellar space.
When the outflowing gas collides with previously ejected gas from other stars, the collisions produce shock waves, similar to sonic booms, which permeate the area. These shock waves heat the gas to millions of degrees, which causes it to glow in X-rays. Extensive observations with Chandra of the central regions of the Milky Way have provided critical data about the temperature and distribution of this multimillion-degree gas.
Astronomers are interested in better understanding what role these Wolf-Rayet stars play in the cosmic neighborhood at the Milky Way’s center. In particular, they would like to know how the stars interact with the Galactic center’s most dominant resident: the supermassive black hole known as Sagittarius A* (abbreviated Sgr A*). Pre-eminent yet invisible, Sgr A* has the mass equivalent to some four million Suns.
The Galactic Center visualization is a 360-degree movie that immerses the viewer into a simulation of the center of our Galaxy. The viewer is at the location of Sgr A* and is able to see about 25 Wolf-Rayet stars (white, twinkling objects) orbiting Sgr A* as they continuously eject stellar winds (black to red to yellow color scale). These winds collide with each other, and then some of this material (yellow blobs) spirals towards Sgr A*. The movie shows two simulations, each of which start around 350 years in the past and span 500 years. The first simulation shows Sgr A* in a calm state, while the second contains a more violent Sgr A* that is expelling its own material, thereby turning off the accretion of clumped material (yellow blobs) that is so prominent in the first portion.
Scientists have used the visualization to examine the effects Sgr A* has on its stellar neighbors. As the strong gravity of Sgr A* pulls clumps of material inwards, tidal forces stretch the clumps as they get closer to the black hole. Sgr A* also impacts its surroundings through occasional outbursts from its vicinity that result in the expulsion of material away from the giant black hole, as shown in the later part of the movie. These outbursts can have the effect of clearing away some of the gas produced by the Wolf-Rayet winds.
The researchers, led by Christopher Russell of the Pontifical Catholic University of Chile, used the visualization to understand the presence of previously detected X-rays in the shape of a disk that extend about 0.6 light years outward from Sgr A*. Their work shows that the amount of X-rays generated by these colliding winds depends on the strength of outbursts powered by Sgr A*, and also the amount of time that has elapsed since an eruption occurred. Stronger and more recent outbursts result in weaker X-ray emission.
The information provided by the theoretical modeling and a comparison with the strength of X-ray emission observed with Chandra led Russell and his colleagues to determine that Sgr A* most likely had a relatively powerful outburst that started within the last few centuries. Moreover, their findings suggest the outburst from the supermassive black hole is still affecting the region around Sgr A* even though it ended about one hundred years ago.
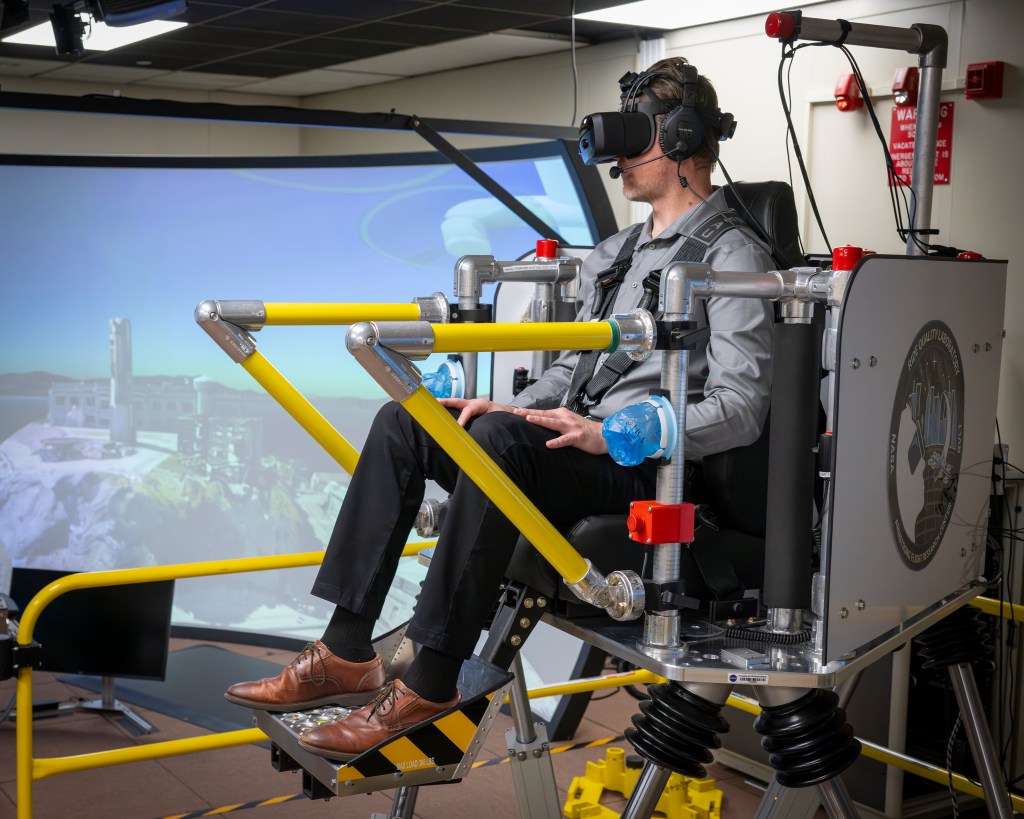
The 360-degree video of the Galactic Center is ideally viewed in virtual reality (VR) goggles, such as Samsung Gear VR or Google Cardboard. The video can also be viewed on smartphones using the YouTube app. Moving the phone around pans to show a different portion of the movie, mimicking the effect in the VR goggles. Finally, most browsers on a computer also allow 360-degree videos to be shown on YouTube. To look around, either click and drag the video, or click the direction pad in the corner.
Christopher Russell presented this new visualization and the related scientific findings at the 231st meeting of the American Astronomical Society in Washington, DC. Some of the results are based on a paper by Russell et al published in 2017 in the Monthly Notices of the Royal Astronomical Society. An online version is here. The co-authors of this paper are Daniel Wang from University of Massachusetts in Amherst, Mass. and Jorge Cuadra from Pontifical Catholic University of Chile. NASA’s Marshall Space Flight Center in Huntsville, Alabama, manages the Chandra program for NASA’s Science Mission Directorate in Washington. The Smithsonian Astrophysical Observatory in Cambridge, Massachusetts, controls Chandra’s science and flight operations.
Read More from NASA’s Chandra X-ray Observatory.
For more Chandra images, multimedia and related materials, visit: