


![Request for Information – Potential [Placeholder for Prize]](https://assets.science.nasa.gov/dynamicimage/assets/science/missions/a-step/FFR_Earth_Background_20251120%20.png?w=1024)


Risk is inherent in human spaceflight. However, specific risks can and should be understood, managed, and mitigated to reduce threats posed to astronauts. Risk management in the context of human spaceflight can be viewed as a trade-based system. The relevant evidence in life sciences, medicine, and engineering is tracked and evaluated to identify ways to minimize overall risk to the astronauts and to ensure mission success. The Human System Risk Board (HSRB) manages the process by which scientific evidence is utilized to establish and reassess the postures of the various risks to the Human System during all of the various types of existing or anticipated crewed missions. The HSRB operates as part of the Health and Medical Technical Authority of the Office of the Chief Health and Medical Officer of NASA via the JSC Chief Medical Officer.
The HSRB approaches to human system risks is analogous to the approach the engineering profession takes with its Failure Mode and Effects Analysis in that a process is utilized to identify and address potential problems, or failures to reduce their likelihood and severity. In the context of risks to the human system, the HSRB considers eight missions which different in their destinations and durations (known as Design Reference Missions [DRM]) to further refine the context of the risks. With each DRM a likelihood and consequence are assigned to each risk which is adjusted scientific evidence is accumulated and understanding of the risk is enhanced, and mitigations become available or are advanced.
This framework enables the principles of Continuous Risk Management and Risk Informed Decision Making (RIDM) to be applied in an ongoing fashion to the challenges posed by Human System Risks. Using this framework consistently across the 29 risks allows management to see where risks need additional research or technology development to be mitigated or monitored and for the identification of new risks and concerns. Further information on the implementation of the risk management process can be found in the following documents:
- Human System Risk Management Plan – JSC-66705
- NASA Health and Medical Technical Authority (HMTA) Implementation – NPR 7120.11A
- NASA Space Flight Program and Project Management Requirements – NPR 7120.5
Human System Risk Board Management Office
The HSRB Risk Management Office governs the execution of the Human System Risk management process in support of the HSRB. It is led by the HSRB Chair, who is also referred to as the Risk Manager.
Risk Custodian Teams
Along with the Human System Risk Manager, a team of risk custodians (a researcher, an operational researcher or physician, and an epidemiologist, who each have specific expertise) works together to understand and synthesize scientific and operational evidence in the context of spaceflight, identify and evaluate metrics for each risk in order to communicate the risk posture to the agency.
Directed Acyclic Graphs
Summary
The HSRB uses Directed Acyclic Graphs (DAG), a type of causal diagramming, as visual tools to create a shared understanding of the risks, improve communication among those stakeholders, and enable the creation of a composite risk network that is vetted by members of the NASA community and configuration managed (Antonsen et al., NASA/TM– 20220006812). The knowledge captured is the Human Health and Performance community’s knowledge about the causal flow of a human system risk, and the relationships that exist between the contributing factors to that risk.
DAGs are:
- Intended to improve communication between:
- Managers and subject matter experts who need to discuss human system risks
- Subject matter experts in different disciplines where human system risks interact with one another in a potentially cumulative fashion
- Visual representations of known or suspected relationships
- Directed – the relationship flows in one direction between any two nodes
- Acyclic – cycles in the graph are not allowed
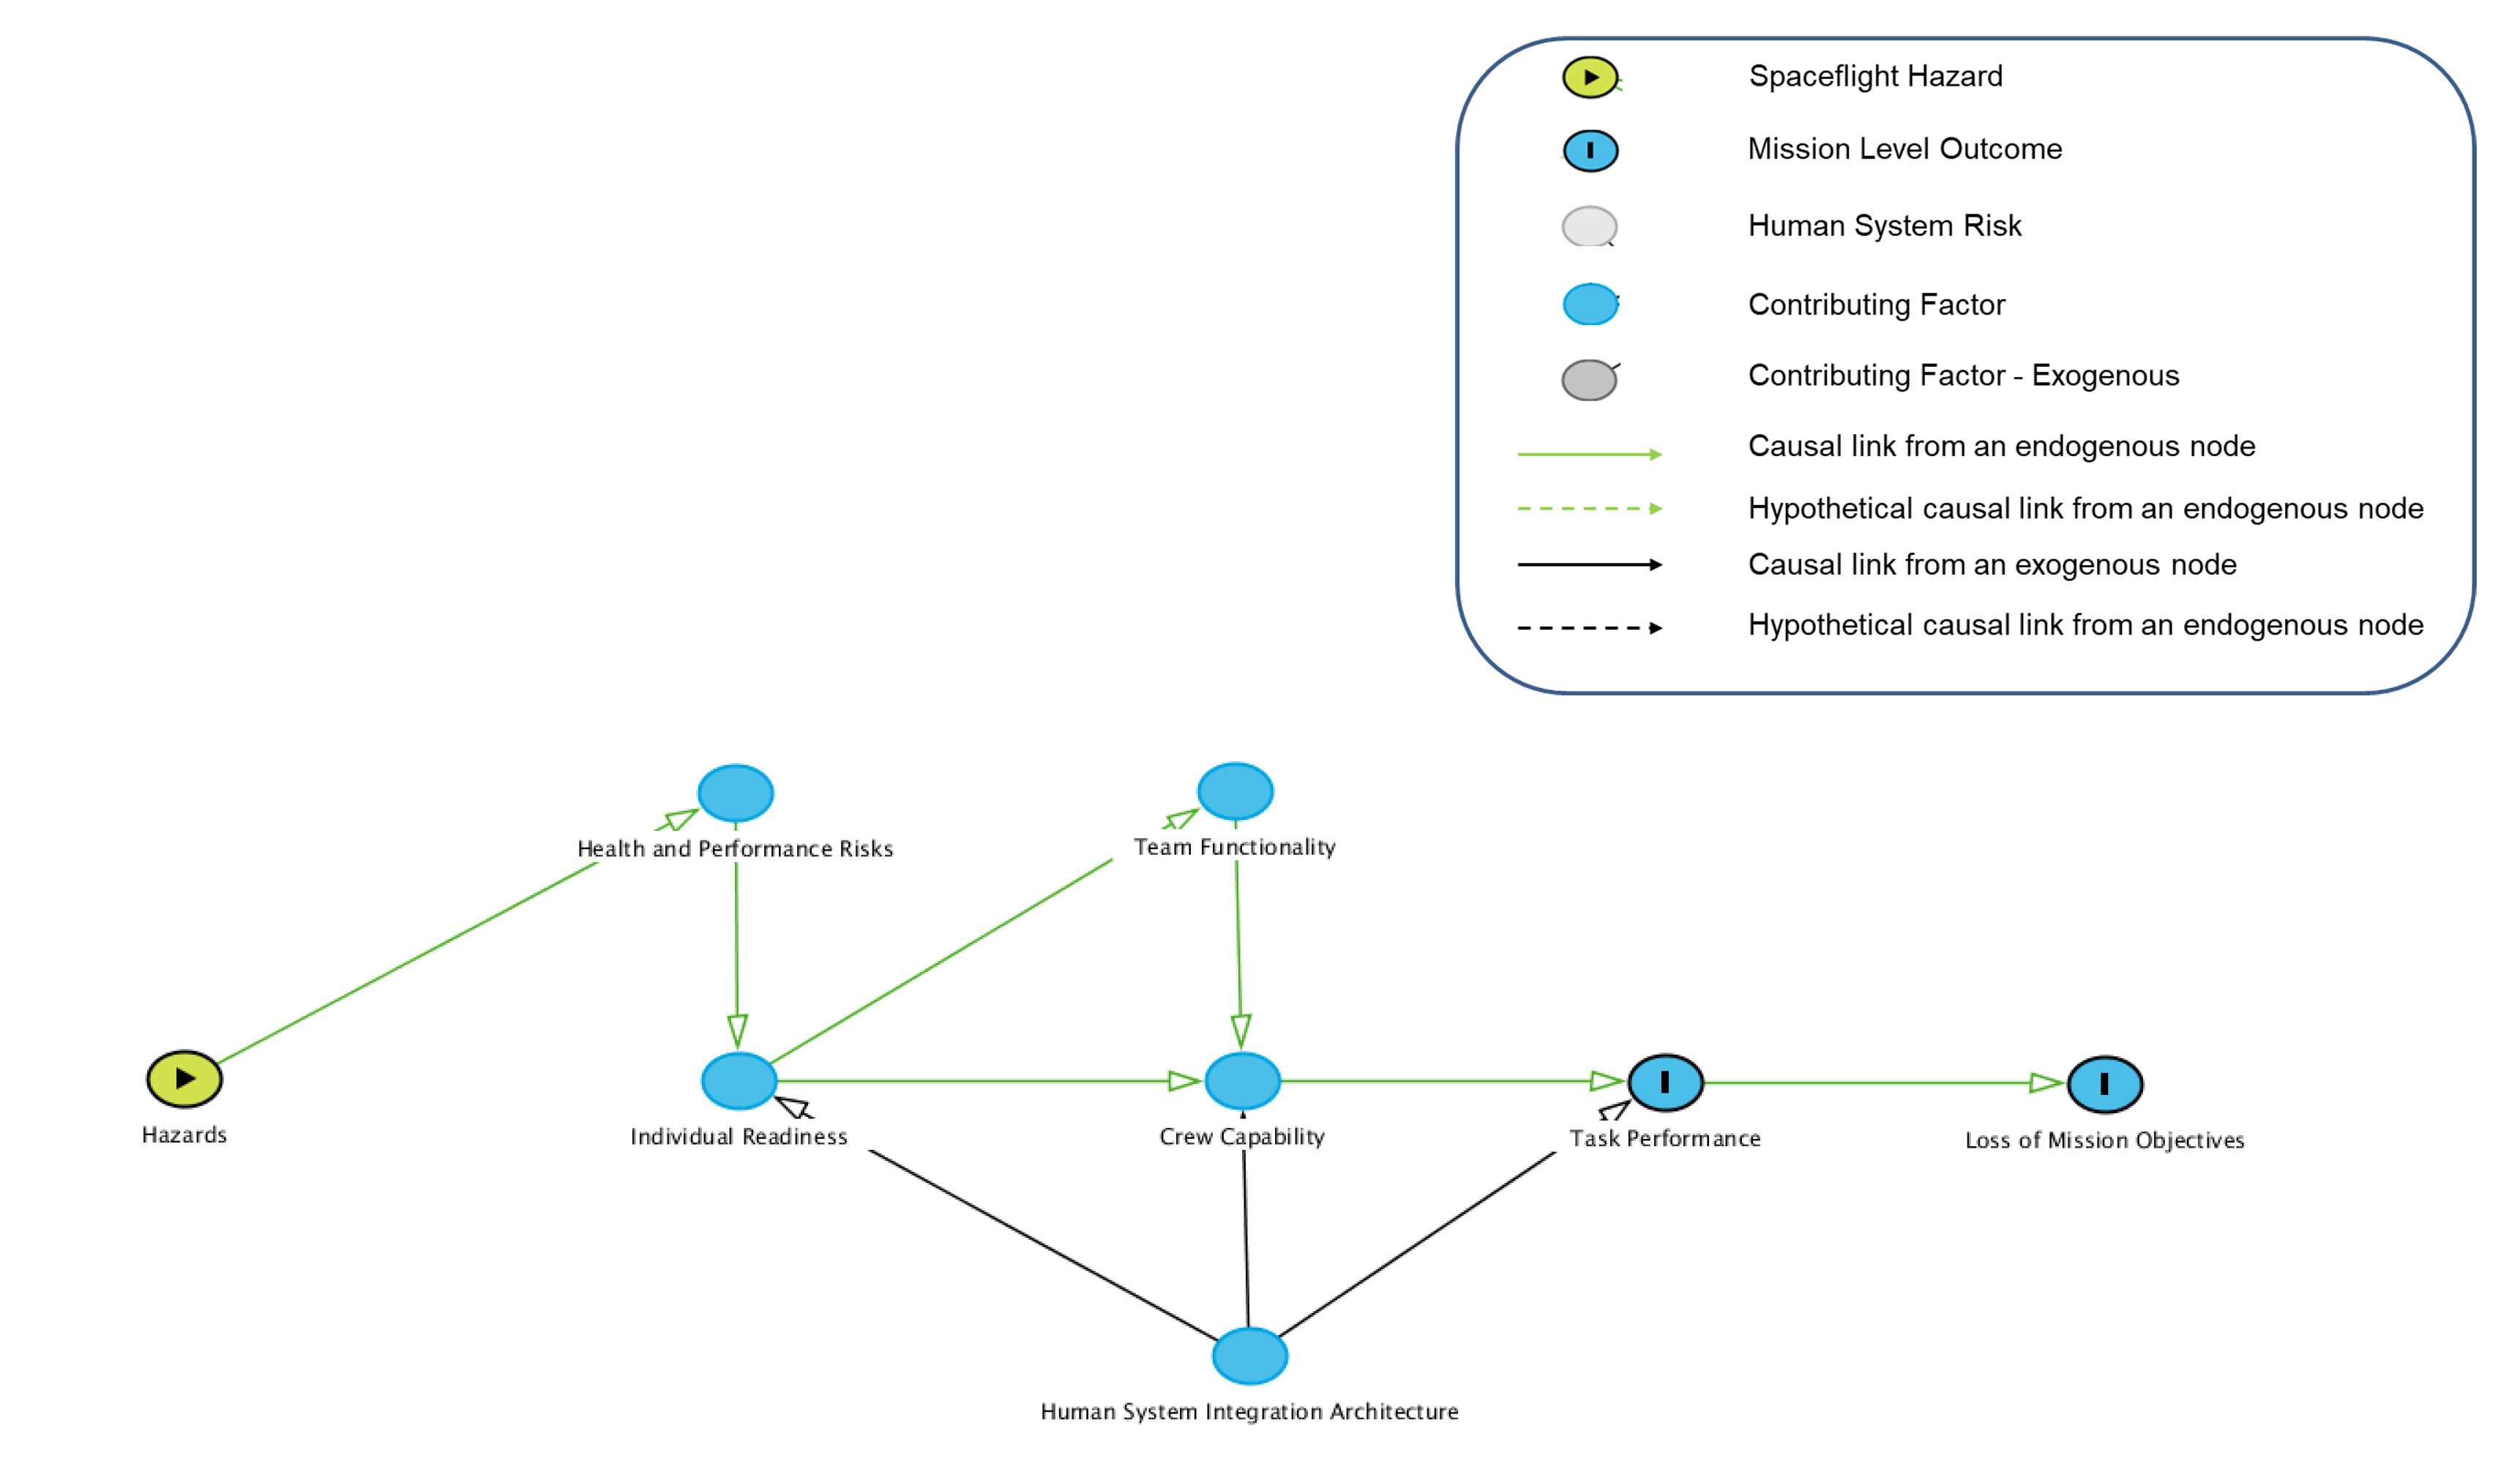
View Larger (Example of a Directed Acyclic Graph) Image
Details
At NASA, the Human System Risks have historically been conceptualized as deriving from five Hazards present in the spaceflight environment. These are: altered gravity, isolation and confinement, radiation, a hostile closed environment, and distance from Earth. These Hazards are aspects of the spaceflight environment that are encountered when someone is launched into space and therefore are the starting point for causal diagramming of spaceflight-related risk issues for the HSRB.
These Hazards are often interpreted in relation to physiologic changes that occur in humans as a result of the exposure; however, interaction between human crew (behavioral health and performance), which may be degraded due to the spaceflight environment – and the vehicle and mission systems that the crew must operate – can also be influenced by these Hazards.
Each Human System Risk DAG is intended to show the causal flow of risk from Hazards to Mission Level Outcomes. As such, the structure of each DAG starts with at least one Hazard and ends with at least one of the pre-defined Mission Level Outcomes. In between are the nodes and edges of the causal flow diagrams that are relevant to the Risk under consideration. These are called ‘contributing factors’ in the HSRB terminology, and include countermeasures, medical conditions, and other Human System Risks. A graph data structure is composed of a set of vertices (nodes), and a set of edges (links). Each edge represents a relationship between two nodes. There can be two types of relationships between nodes: directed and undirected. For example, if an edge exists between two nodes A and B and the edge is undirected, it is represented as A–B, (no arrow). If the edge were directed, for example from A to B, then this is represented with an arrow (A->B). Each directed arrow connecting one node to another on a DAG indicates a claim of causality. A directed graph can potentially contain a cycle, meaning that, from a specific node, there exists a path that would eventually return to that node. A directed graph that has no cycles is known as acyclic. Thus, a graph with directed links and no cycles is a DAG. DAGs are a type of network diagram that represent causality in a visual format.
DAGs are updated with the regular Human System Risk updates generally every 1-2 years. Approved DAGs can be found in the NASA/TP 20220015709 below or broken down under each Human System Risk.
Documents
- Directed Acyclic Graph Guidance Documentation – NASA/TM 20220006812
- Directed Acyclic Graphs: A Tool for Understanding the NASA Human Spaceflight System Risks – NASA/TP 20220015709
Points of Contact
Mary Van Baalen
Dan Buckland
Bob Scully
Kim Lowe