


Dust storms from Africa’s Saharan Desert traveling across the Atlantic Ocean are nothing new, but the current dust storm has been quite expansive and NASA satellites have provided a look at the massive June plume. NASA-NOAA’s Suomi NPP satellite showed the blanket of dust had moved over the Gulf of Mexico and extended into Central America and over part of the eastern Pacific Ocean.
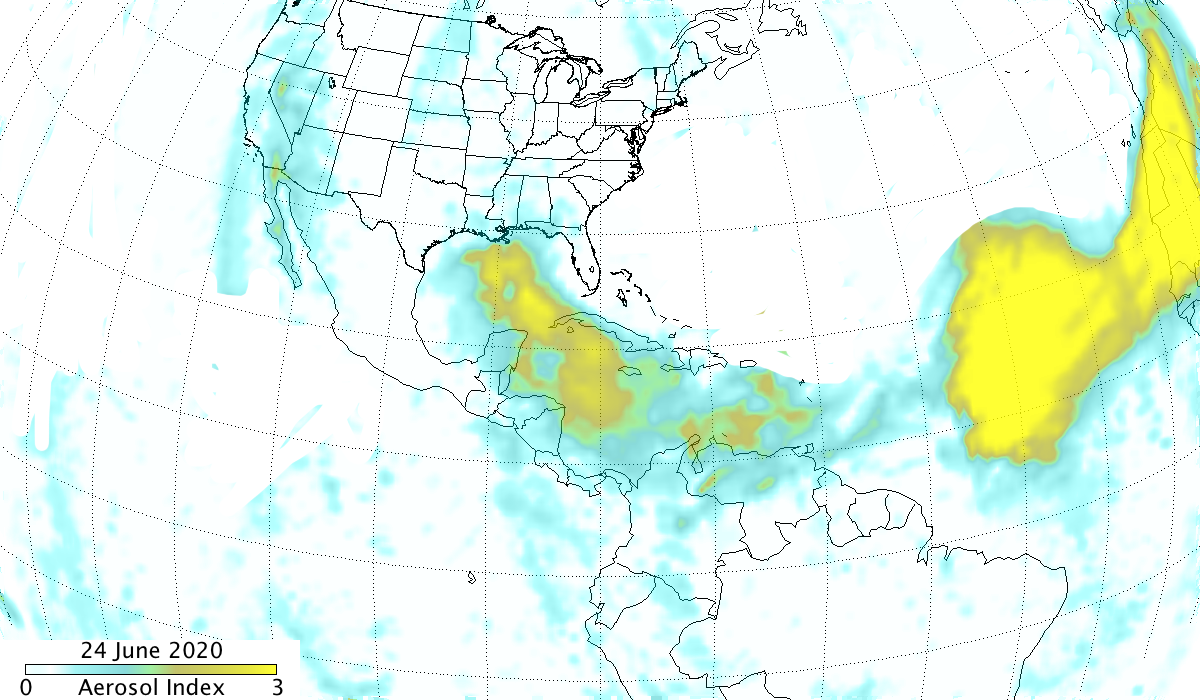
NASA uses satellites and other resources to track aerosol particles made of desert dust, smoke, and volcanic ash. The Visible Infrared Imaging Radiometer Suite (VIIRS) instrument aboard Suomi NPP provided a visible image while the Ozone Mapping and Profiling Suite (OMPS) Nadir-Mapper (NM) instrument aboard the Suomi-NPP satellite provided absorbing aerosol index values. The OMPS index indicates the presence of light absorbing aerosol particles (ultraviolet (UV)-absorbing particles in the air) such as desert dust. The absorbing aerosol index is related to both the thickness and height of the aerosol layer.
The Absorbing Aerosol Index is useful for identifying and tracking the long-range transport of volcanic ash from volcanic eruptions, smoke from wildfires or biomass burning events and dust from desert dust storms. These aerosol particals can even be tracked over clouds and areas covered by snow and ice.
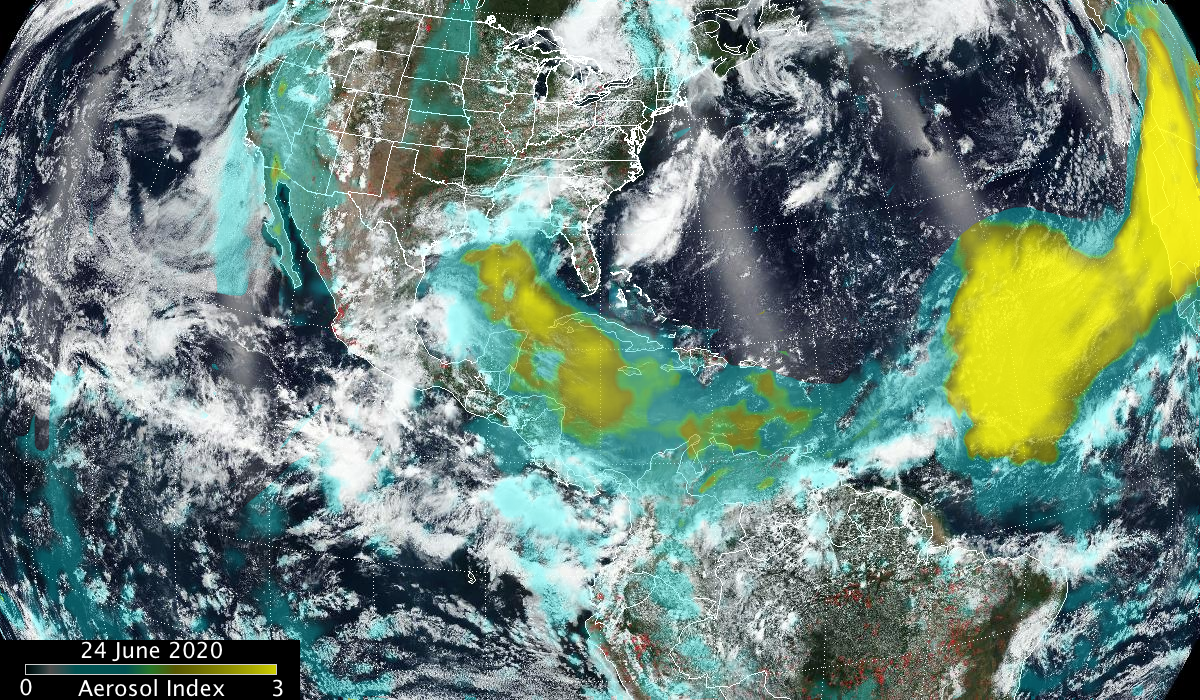
Colin Seftor, an atmospheric scientist at NASA’s Goddard Space Flight Center in Greenbelt, Md., created imagery from the Suomi NPP OMPS absorbing aerosol index and visible imagery from the VIIRS instrument He said that on June 23 and 24 the dust plume had moved completely over Mexico’s Yucatan Peninsula, up through the Gulf of Mexico and into southern Texas. “At that point, the situation becomes more complicated because the absorbing aerosol index signal seen further north into Texas, Oklahoma, Nebraska, etc., is probably a mix of dust and smoke from the numerous fires burning in the southwest U.S. You can also see that the dust traveled over Central America and out into the Eastern Pacific Ocean.”
On June 25, an animation that combined OMPS aerosol index and VIIRS visible imagery from NASA/NOAA’s Suomi NPP satellite was created at NASA Goddard showing the movement the Saharan dust cloud from June 15 to 25, 2020,. The animation showed the dust plume streamed from Africa’s west coast over the Atlantic into the Caribbean Sea and up through the Gulf of Mexico over some of the Gulf states.
Aerosol particles absorb and scatter incoming sunlight, which reduces visibility and increases the optical depth. Aerosol particles have an effect on human health, weather and the climate. Aerosol particles are produced from many events including human activities such as pollution from factories and natural processes such as smoke from fires, dust from dust storms, sea salt from breaking waves, and volcanic ash from volcanoes. Aerosol particles compromise human health when inhaled by people with asthma or other respiratory illnesses. Aerosol particles also affect weather and climate by cooling or warming the earth as well as enhancing or preventing cloud formation.
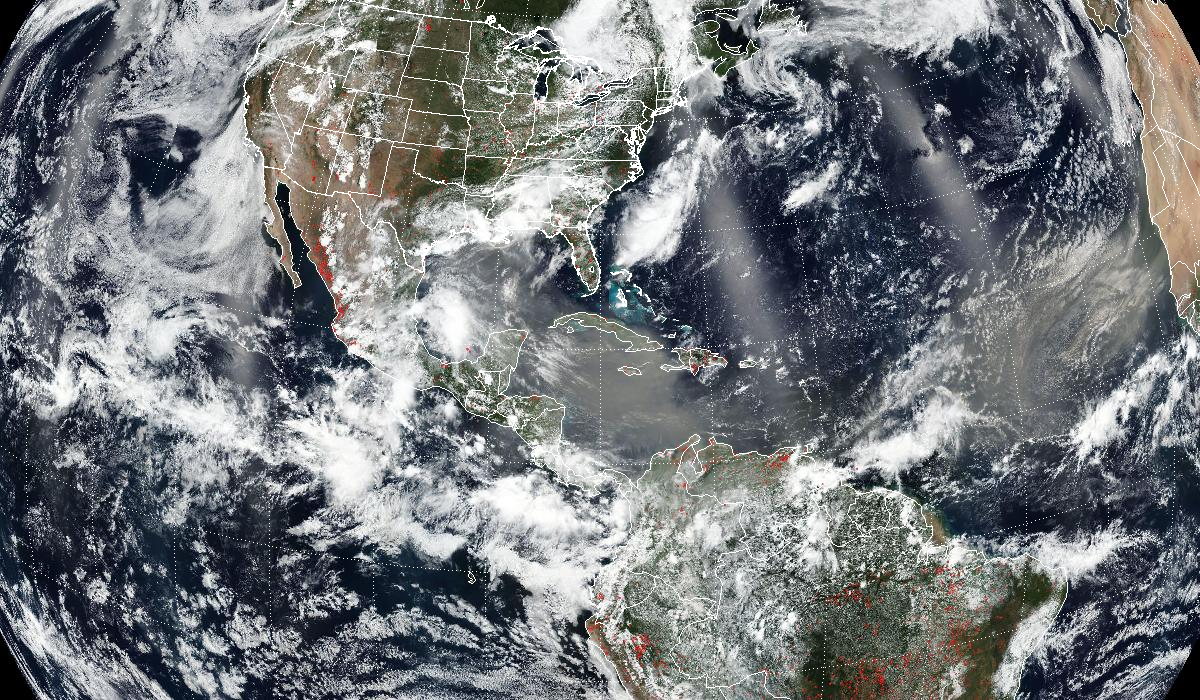
On June 18, NASA’s Earth Observatory noted the thickest parts of the plume appeared to stretch about 2,500 kilometers (1,500 miles) across the Atlantic Ocean. By June 24, the plume extended over 5,000 miles.
Dust from Africa can affect air quality as far away as North and South America if it is mixed down to ground level. But dust can also play an important ecological role, such as, fertilizing soils in the Amazon and building beaches in the Caribbean. The dry, warm, and windy conditions associated with Saharan Air Layer outbreaks from Africa can also suppress the formation and intensification of tropical cyclones.
“While Saharan dust transport across the ocean to the Americas is not uncommon, the size and strength of this particular event is quite unusual,” Seftor said. “Also, if you look off the coast of Africa you can see yet another large cloud coming off the continent, continuing to feed the long chain of dust traveling across the Atlantic.”
Animated GIFs of the dust storm’s activity: