


Over the past several weeks, NASA satellite measurements have revealed significant reductions in air pollution over the major metropolitan areas of the Northeast United States. Similar reductions have been observed in other regions of the world. These recent improvements in air quality have come at a high cost, as communities grapple with widespread lockdowns and shelter-in-place orders as a result of the spread of COVID-19.
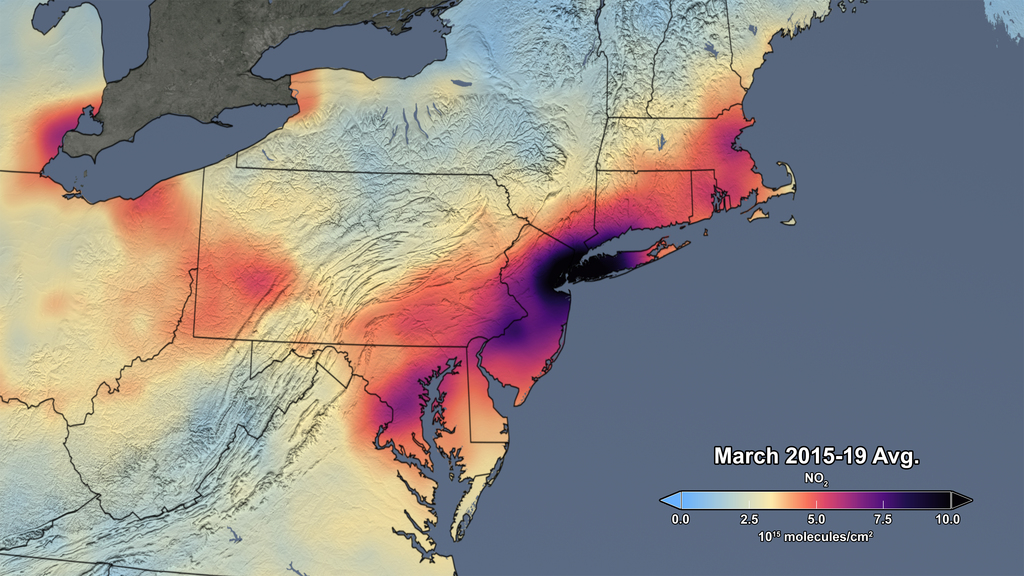
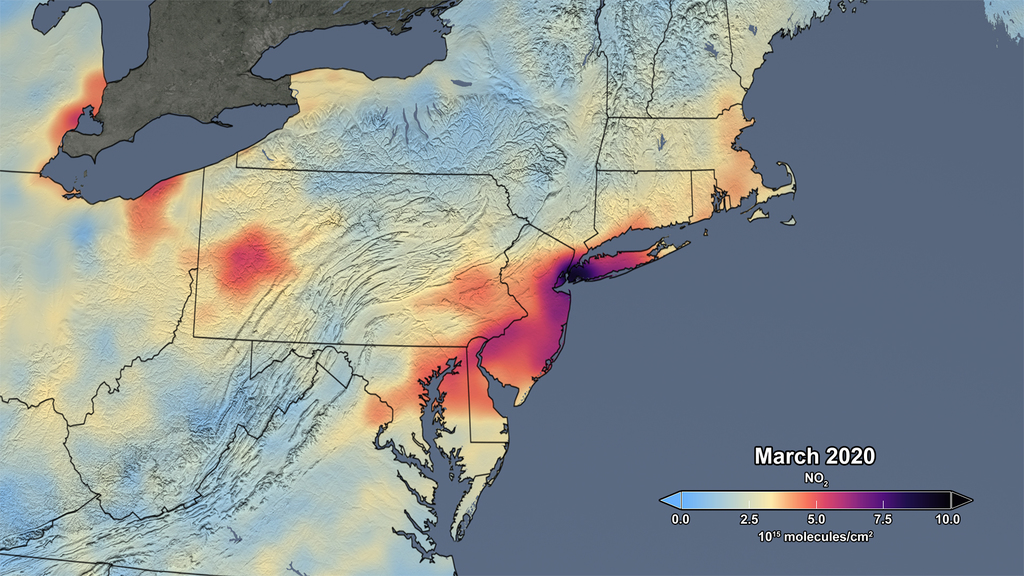
Nitrogen dioxide, primarily emitted from burning fossil fuels for transportation and electricity generation, can be used as an indicator of changes in human activity. The images below show average concentrations of atmospheric nitrogen dioxide as measured by the Ozone Monitoring Instrument (OMI) on NASA’s Aura satellite, as processed by a team at NASA’s Goddard Space Flight Center, Greenbelt, Maryland. The left image in the slider shows the average concentration in March of 2015-19, while the right image in the slider shows the average concentration measured in March of this year.
Though variations in weather from year to year cause variations in the monthly means for individual years, March 2020 shows the lowest monthly atmospheric nitrogen dioxide levels of any March during the OMI data record, which spans 2005 to the present. In fact, the data indicate that the nitrogen dioxide levels in March 2020 are about 30% lower on average across the region of the I-95 corridor from Washington, DC to Boston than when compared to the March mean of 2015-19. Further analysis will be required to rigorously quantify the amount of the change in nitrogen dioxide levels associated with changes in emissions versus natural variations in weather.
If processed and interpreted carefully, nitrogen dioxide levels observed from space serve as an effective proxy for nitrogen dioxide levels at Earth’s surface, though there will likely be differences in the measurements from space and those made at ground level. It is also important to note that satellites that measure nitrogen dioxide cannot see through clouds, so all data shown is for days with low cloudiness. Such nuances in the data make long-term records vital in understanding changes like those shown in this image.
For more information on NASA’s air quality research, visit airquality.gsfc.nasa.gov.
The visual in this article can be downloaded at NASA’s Scientific Visualization Studio.
For more information please contact:
Peter Jacobs
Earth Public Affairs, Acting
peter.jacobs@nasa.gov