


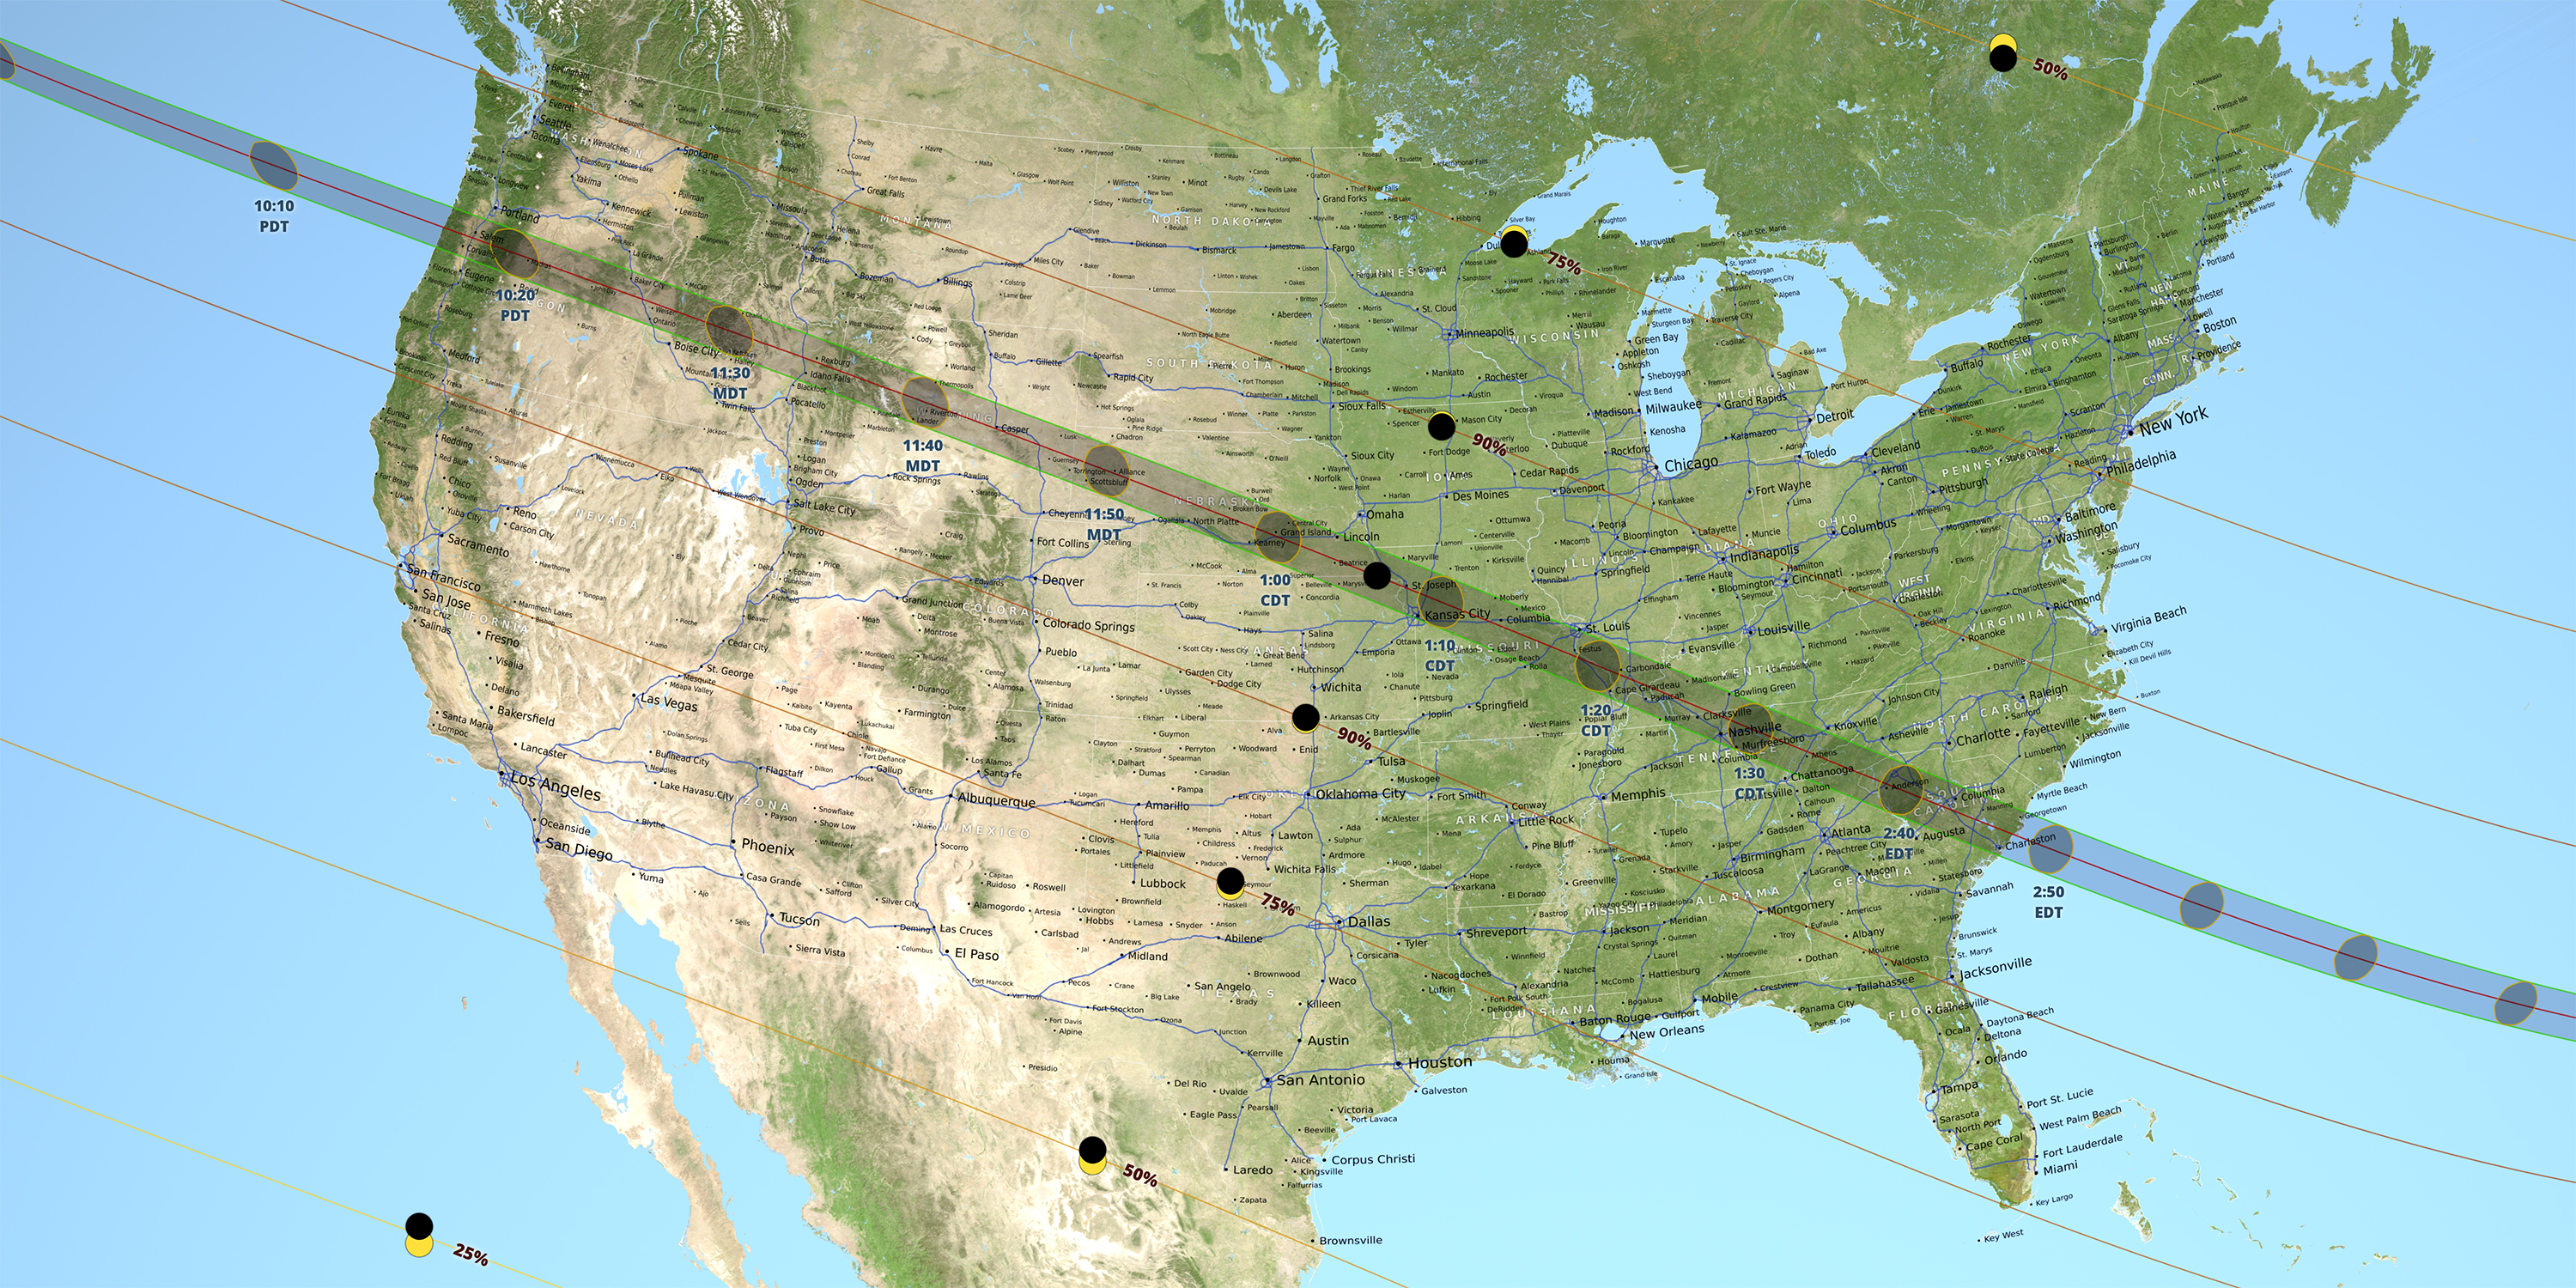
On Monday, Aug. 21, 2017, millions in the U.S. will have their eyes to the sky as they witness a total solar eclipse. The moon’s shadow will race across the United States, from Oregon to South Carolina. The path of this shadow, also known as the path of totality, is where observers will see the moon completely cover the sun. And thanks to elevation data of the moon from NASA’s Lunar Reconnaissance Orbiter, or LRO, coupled with detailed NASA topography data of Earth, we have the most accurate maps of the path of totality for any eclipse to date.
This video is public domain and can be downloaded from the Scientific Visualization Studio.
Early map-making
Eclipse maps have long been used to plot the predicted path of the moon’s shadow as it crosses the face of Earth. Friedrich Wilhelm Bessel and William Chauvenet, two prominent 19th century astronomers and mathematicians, developed the math still used to make eclipse maps — long before computers and the precise astronomical data gathered during the Space Age.
Traditionally, eclipse calculations assume that all observers are at sea level and that the moon is a smooth sphere that is perfectly symmetrical around its center of mass. The calculations do not take into account different elevations on Earth and the moon’s cratered, uneven surface.
For slightly more accurate maps, people use elevation tables and plots of the lunar limb — the edge of the visible surface of the moon as seen from Earth. Until recently, astronomers have used the limb profiles published in 1963 by astronomer Chester Burleigh Watts to create eclipse maps of the moon’s path of totality. To produce his profiles, Watts designed a machine that traced 700 photographs covering every angle of the moon visible from Earth.
However, eclipse calculations have gained even greater accuracy based on topography data from LRO observations.
A new look at an ancient phenomenon
Using LRO elevation maps, NASA visualizer Ernie Wright at Goddard Space Flight Center in Greenbelt, Maryland, created a continuously varying lunar limb profile as the moon’s shadow passes over the United States as it will during the upcoming eclipse. The mountains and valleys along the edge of the moon’s disk affect the timing and duration of totality by several seconds. Wright also used several NASA data sets to provide an elevation map of Earth so that eclipse observer locations were depicted at their true altitude.
The resulting visualizations show something never seen before: the true, time-varying shape of the moon’s shadow, with the effects of both an accurate lunar limb and the Earth’s terrain.
“We couldn’t have done visualizations like this even 10 years ago,” Wright said. “This is a confluence of increasing computing power and new datasets from remote sensing platforms like LRO and the Shuttle Radar Topography Mission.”
The lunar umbra is the part of the moon’s shadow where the entire sun is blocked by the moon. On an eclipse map, this tells you where to stand in order to experience totality. For centuries, eclipse maps have depicted the shape of the moon’s umbra, or darkest part of its shadow, as a smooth ellipse.
As evidenced in the new visualizations, the umbral shape is dramatically altered by both the rugged lunar terrain and the elevations of observers on Earth.
“We’ve known for a while now about the effects of the lunar limb and the elevation of observers on the Earth, but this is the first time we’ve really seen it in this way,” Wright said. “I think it’ll change how people think about mapping eclipses.”
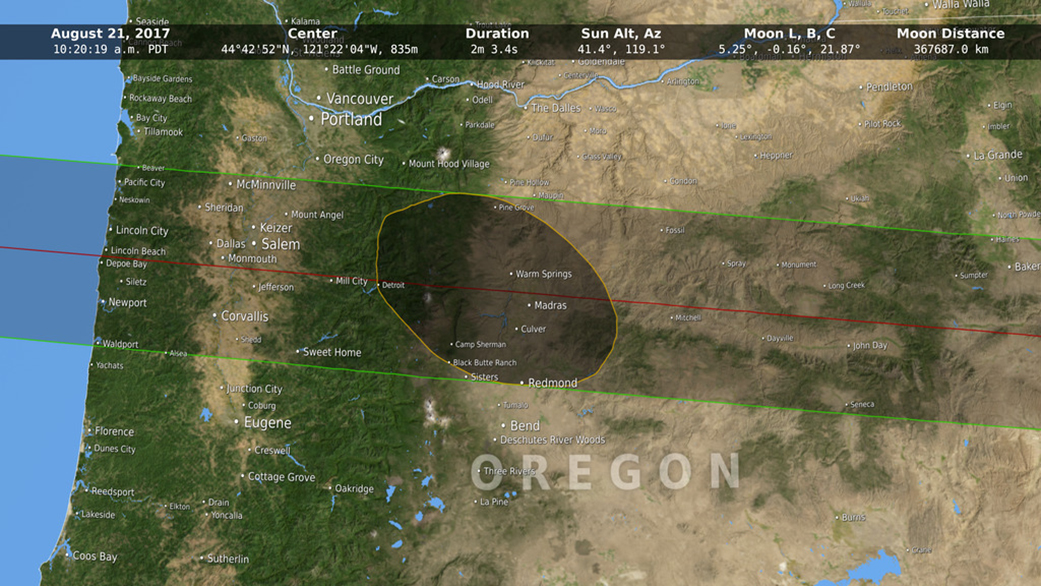
The true shape of the umbra is more like an irregular polygon with slightly curved edges. Each edge corresponds to a single valley on the lunar limb, the last spot on the limb that lets sunlight through. As these edges pass over mountain ranges, they are scalloped by the peaks and valleys of the landscape. The moon’s umbra will cross the Cascades, Rockies and Appalachians during the 2017 eclipse.
“Solar and lunar eclipses provide an excellent opportunity to talk about the moon, since without the moon there would be no eclipses,” said Noah Petro, deputy project scientist for LRO. “Because we know the shape of the moon better than any other planetary body, thanks to LRO, we can now accurately predict the shape of the shadow as it falls on the face of the Earth. In this way, LRO data sheds new light on our predictions for the upcoming eclipse.”
The total solar eclipse on Monday, Aug. 21, 2017 will cross the continental United States beginning in Oregon and ending in South Carolina. The last time a total solar eclipse spanned the United States was in 1918, when the path of totality entered through the southwest corner of Washington and passed over Denver, Colorado, Jackson, Mississippi, and Orlando, Florida before exiting the country at the Atlantic coast of Florida.
For more information about the upcoming 2017 solar eclipse, visit:
https://eclipse2017.nasa.gov
or
https://www.nasa.gov/eclipse
More information on the numerous NASA data sets incorporated into this visualization:
Blue Marble Next Generation was used for color of the land.
Shuttle Radar Topography Mission was used for Earth elevations. This is a global elevation map based on a radar instrument flown on Space Shuttle Endeavour during STS-99 in February 2000.
Lunar Digital Elevation Model and Selene/LRO Digital Elevation Model were used for the lunar limb.
NASA’s Jet Propulsion Laboratory’s DE421 provided Earth, moon, and sun positions.