


NASA scientists have established a new way to use satellites to measure what’s occurring inside plants at a cellular level.
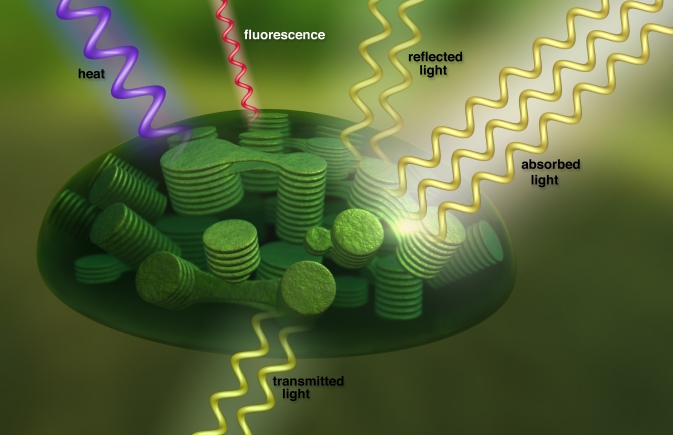
Plants grow and thrive through photosynthesis, a process that converts sunlight into energy. During photosynthesis, plants emit what is called fluorescence – light invisible to the naked eye but detectable by satellites orbiting hundreds of miles above Earth. NASA scientists have now established a method to turn this satellite data into global maps of the subtle phenomenon in more detail than ever before.
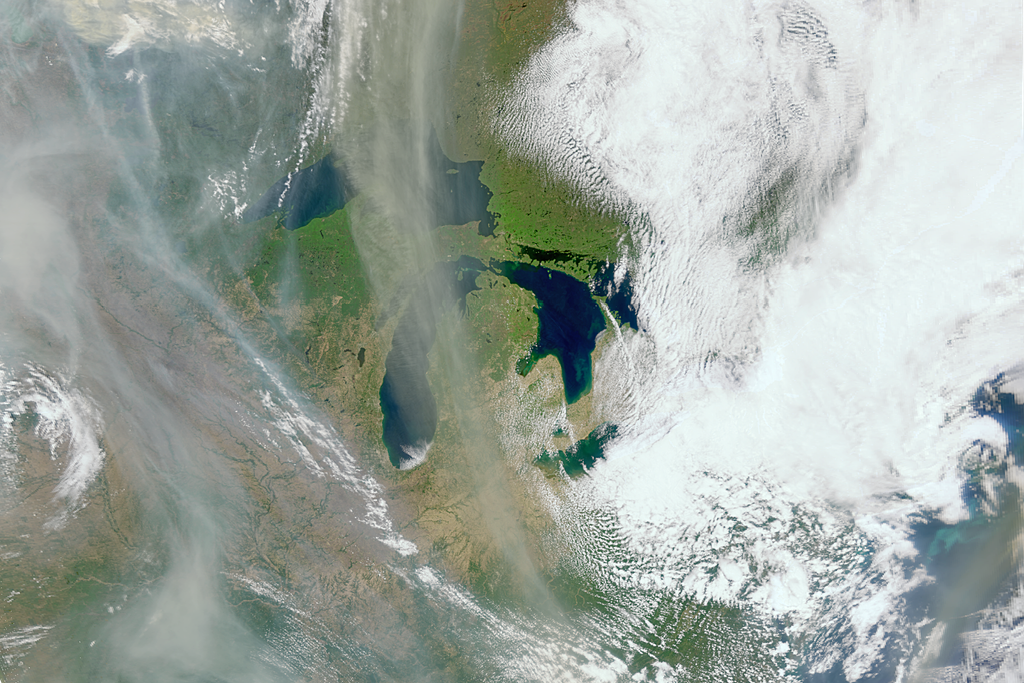
Image Credit: NASA’s Goddard Space Flight Center
Healthy plants use the energy from sunlight to perform photosynthesis, and re-emit some of that light as a faint but measureable glow. In short, abundant fluorescence indicates active photosynthesis and a well functioning plant, while low or no fluorescence can mean that the plant is stressed or shutting down. Maps of the phenomenon give scientists a direct look at plant health.
The new maps – produced by Joanna Joiner of NASA’s Goddard Space Flight Center in Greenbelt, Md., and colleagues – boast a 16-fold increase in spatial resolution and a three-fold increase in temporal resolution over the first proof-of-concept maps released in 2011 from a different satellite instrument. Improved global measurements could have implications for farmers interested in early indications of crop stress and ecologists looking to better understand global vegetation and carbon cycle processes.
“For the first time, we are able to globally map changes in fluorescence over the course of a single month,” Joiner said. “This lets us use fluorescence to observe, for example, variation in the length of the growing season.”
Vegetation dynamics, including the northward migration of plant growth during the northern hemisphere springtime, is already observed indirectly by satellite data used measure the “greenness” of light reflected from Earth’s surface. Fluorescence measurements complement the greenness measurements by providing direct and immediate information about plant productivity. For example, the researchers saw plants start to shut down in the fall before their leaves turned colors. They also clearly detected early plant growth during the warm spring of 2012.
The maps were possible due to the development of a new way to identify the very faint fluorescence signal collected by the Global Ozone Monitoring Instrument 2 (GOME-2) instrument on Metop-A, a European meteorological satellite. Acquiring the measurement is complicated by the fluorescence signal mixing with that of sunlight reflected from Earth’s surface and clouds, and the absorption of sunlight by gases in the atmosphere.
To identify fluorescence, Joiner and colleagues took advantage of that fact that each of these signals has its own unique spectral signature akin to a fingerprint – whether from fluorescence, Earth’s surface or the atmosphere. Match the fingerprint associated with fluorescence and scientists can tease out that data from the rest of the light.
Detangling the signal from atmospheric influences was a complexity not present in the pioneering research in 2011, when Joiner and colleagues produced the first global maps that proved the concept of measuring global land plant fluorescence from space. That study relied on data from a spectrometer aboard a Japanese satellite called the Greenhouse Gases Observing Satellite (GOSAT). Researchers analyzed an unusually dark section of the infrared portion of the solar spectrum where there is little background light, making it possible to distinguish the faint fluorescence signal.
Despite its complexities, the new method allows for more frequent measurements capable of producing higher resolution maps. Previous observations with GOSAT relied on averaging the data over areas of 200 square kilometers every month. Now, with GOME-2, scientists average the data over areas of just 50 square kilometers about every 10 days. The study was published online for review in April in Atmospheric Measurement Techniques.
“The more precise and more frequent sampling is valuable, allowing us to zoom in on the regions with the highest fluorescence signals,” Joiner said. “Our data indicate that agricultural areas in the U.S. Midwest are some of the most productive lands on Earth. We can also now correlate our satellite fluorescence measurements with tower-based observations of carbon dioxide taken up by plants.”
The research also paves the path for fluorescence studies based on measurements from future atmospheric or fluorescent-specific observations. Such observations could come from NASA’s Orbiting Carbon Observatory-2, a mission designed to measure carbon dioxide that will launch no sooner than July 2014, and the European Space Agency’s Fluorescence Explorer mission, which could be selected in 2015 for launch toward the end of the decade.
Related Link
› “First-of-its-Kind Fluorescence Map Offers a New View of World’s Land Plants” (06.06.11)
Kathryn Hansen
NASA’s Earth Science News Team