


Risk Analysis and Solutions Innovators (RASI)
A partnership between scientists and facility managers to enhance climate resilience at NASA.
TODAY
Active Working Groups
Ecosystem Applications
AMES RASI Team

Christopher Potter
Senior Research Scientist

Laura Iraci
Senior Research Scientist
About RASI
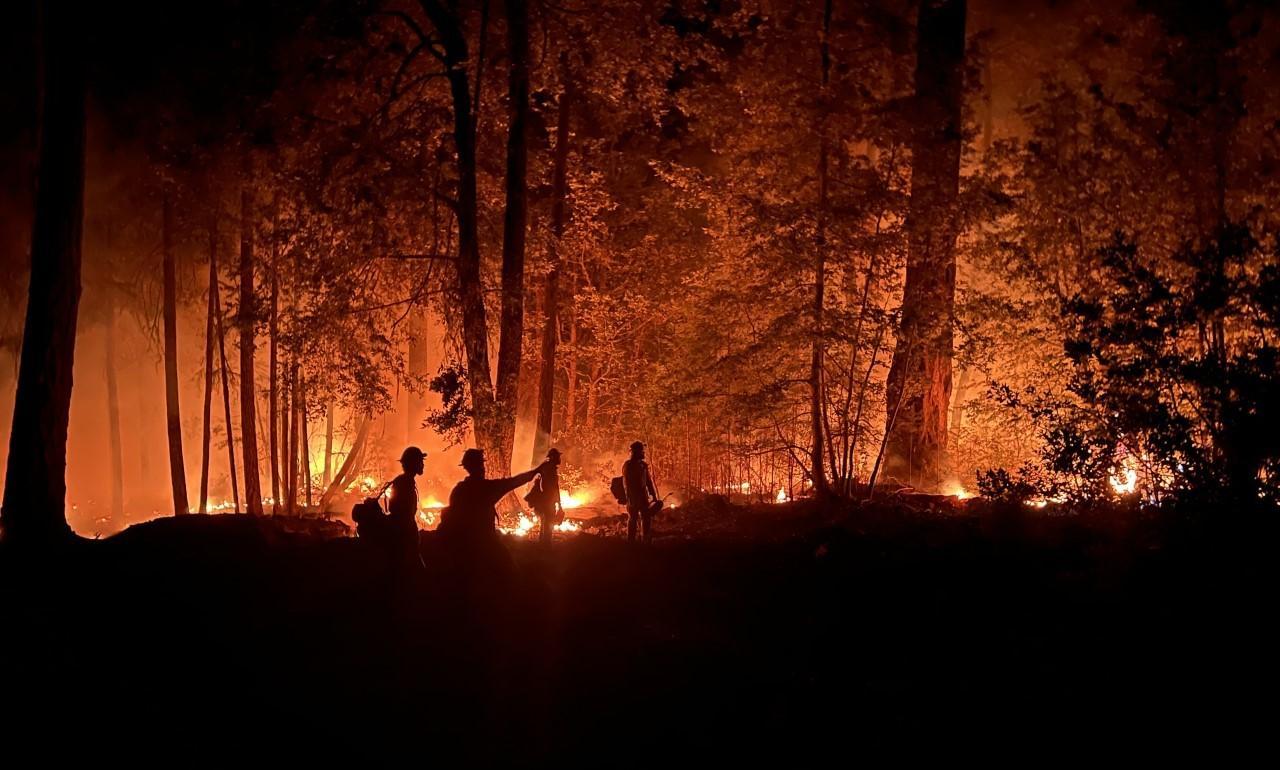
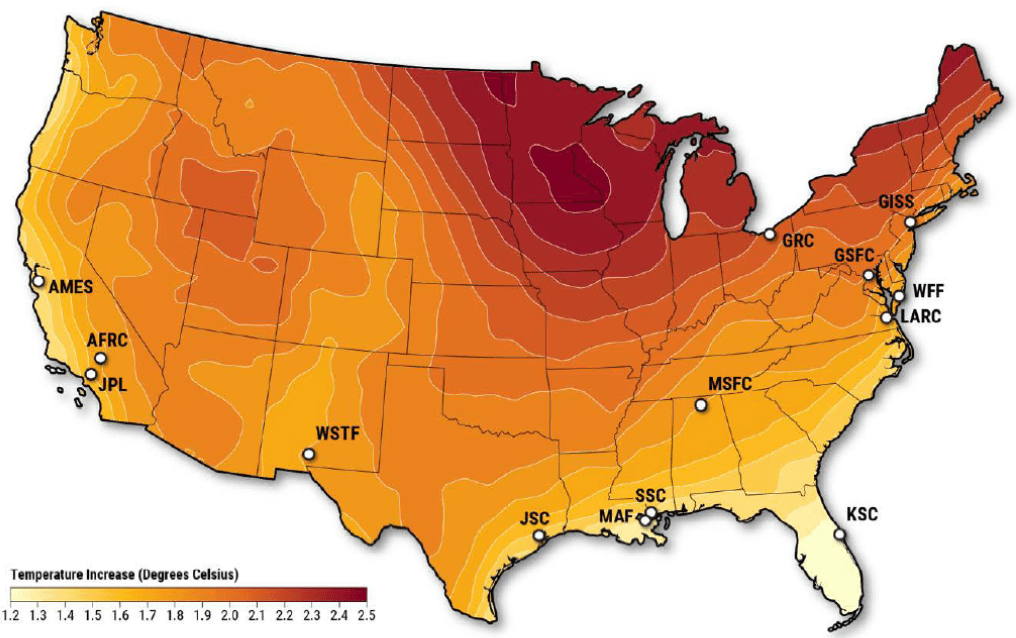
RASI’s mission is to provide the latest scientific research on climate change to help NASA facilities managers adapt to increasing climate risks in timely and effective ways. The RASI science products are created and shared through working groups that include topics such as water management, ecosystems, energy, air quality, wildfires, sea-level rise, and extreme weather events.
RASI Tools:
Ecosystem Workflow
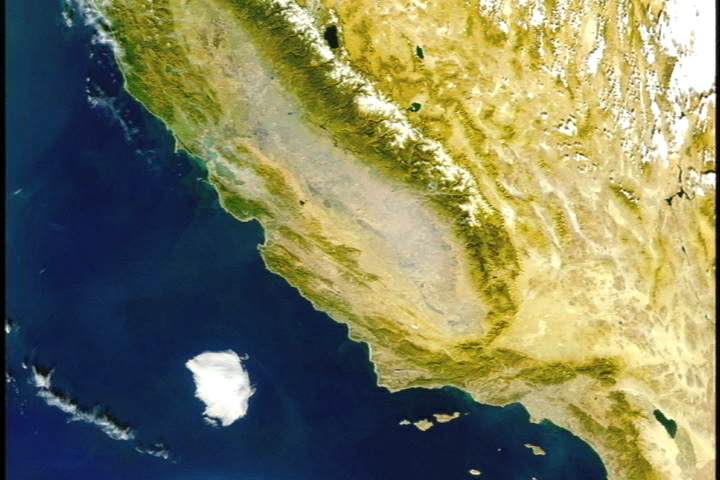
The RASI Ecosystems Workflow provides information for NASA facilities managers and for their surrounding natural landscapes on the presence of endangered species, invasive species, biodiversity, and carbon pools.
Explore the RASI Ecosystem Workflow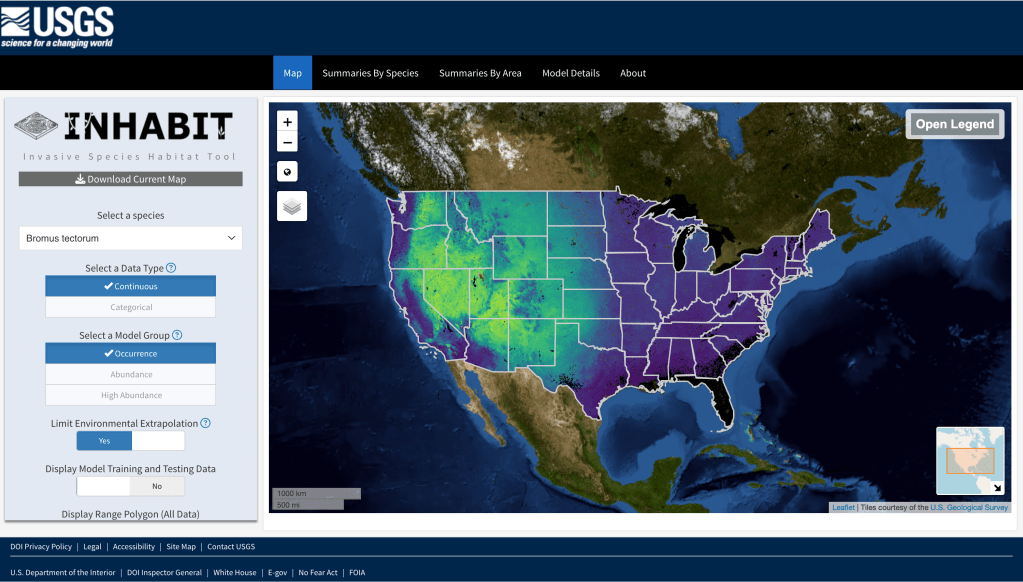
Water Management
RASI supports two primary water management tools: assessments for tropical storm surges and flood risk.
Explore RASI Water Management Tools