


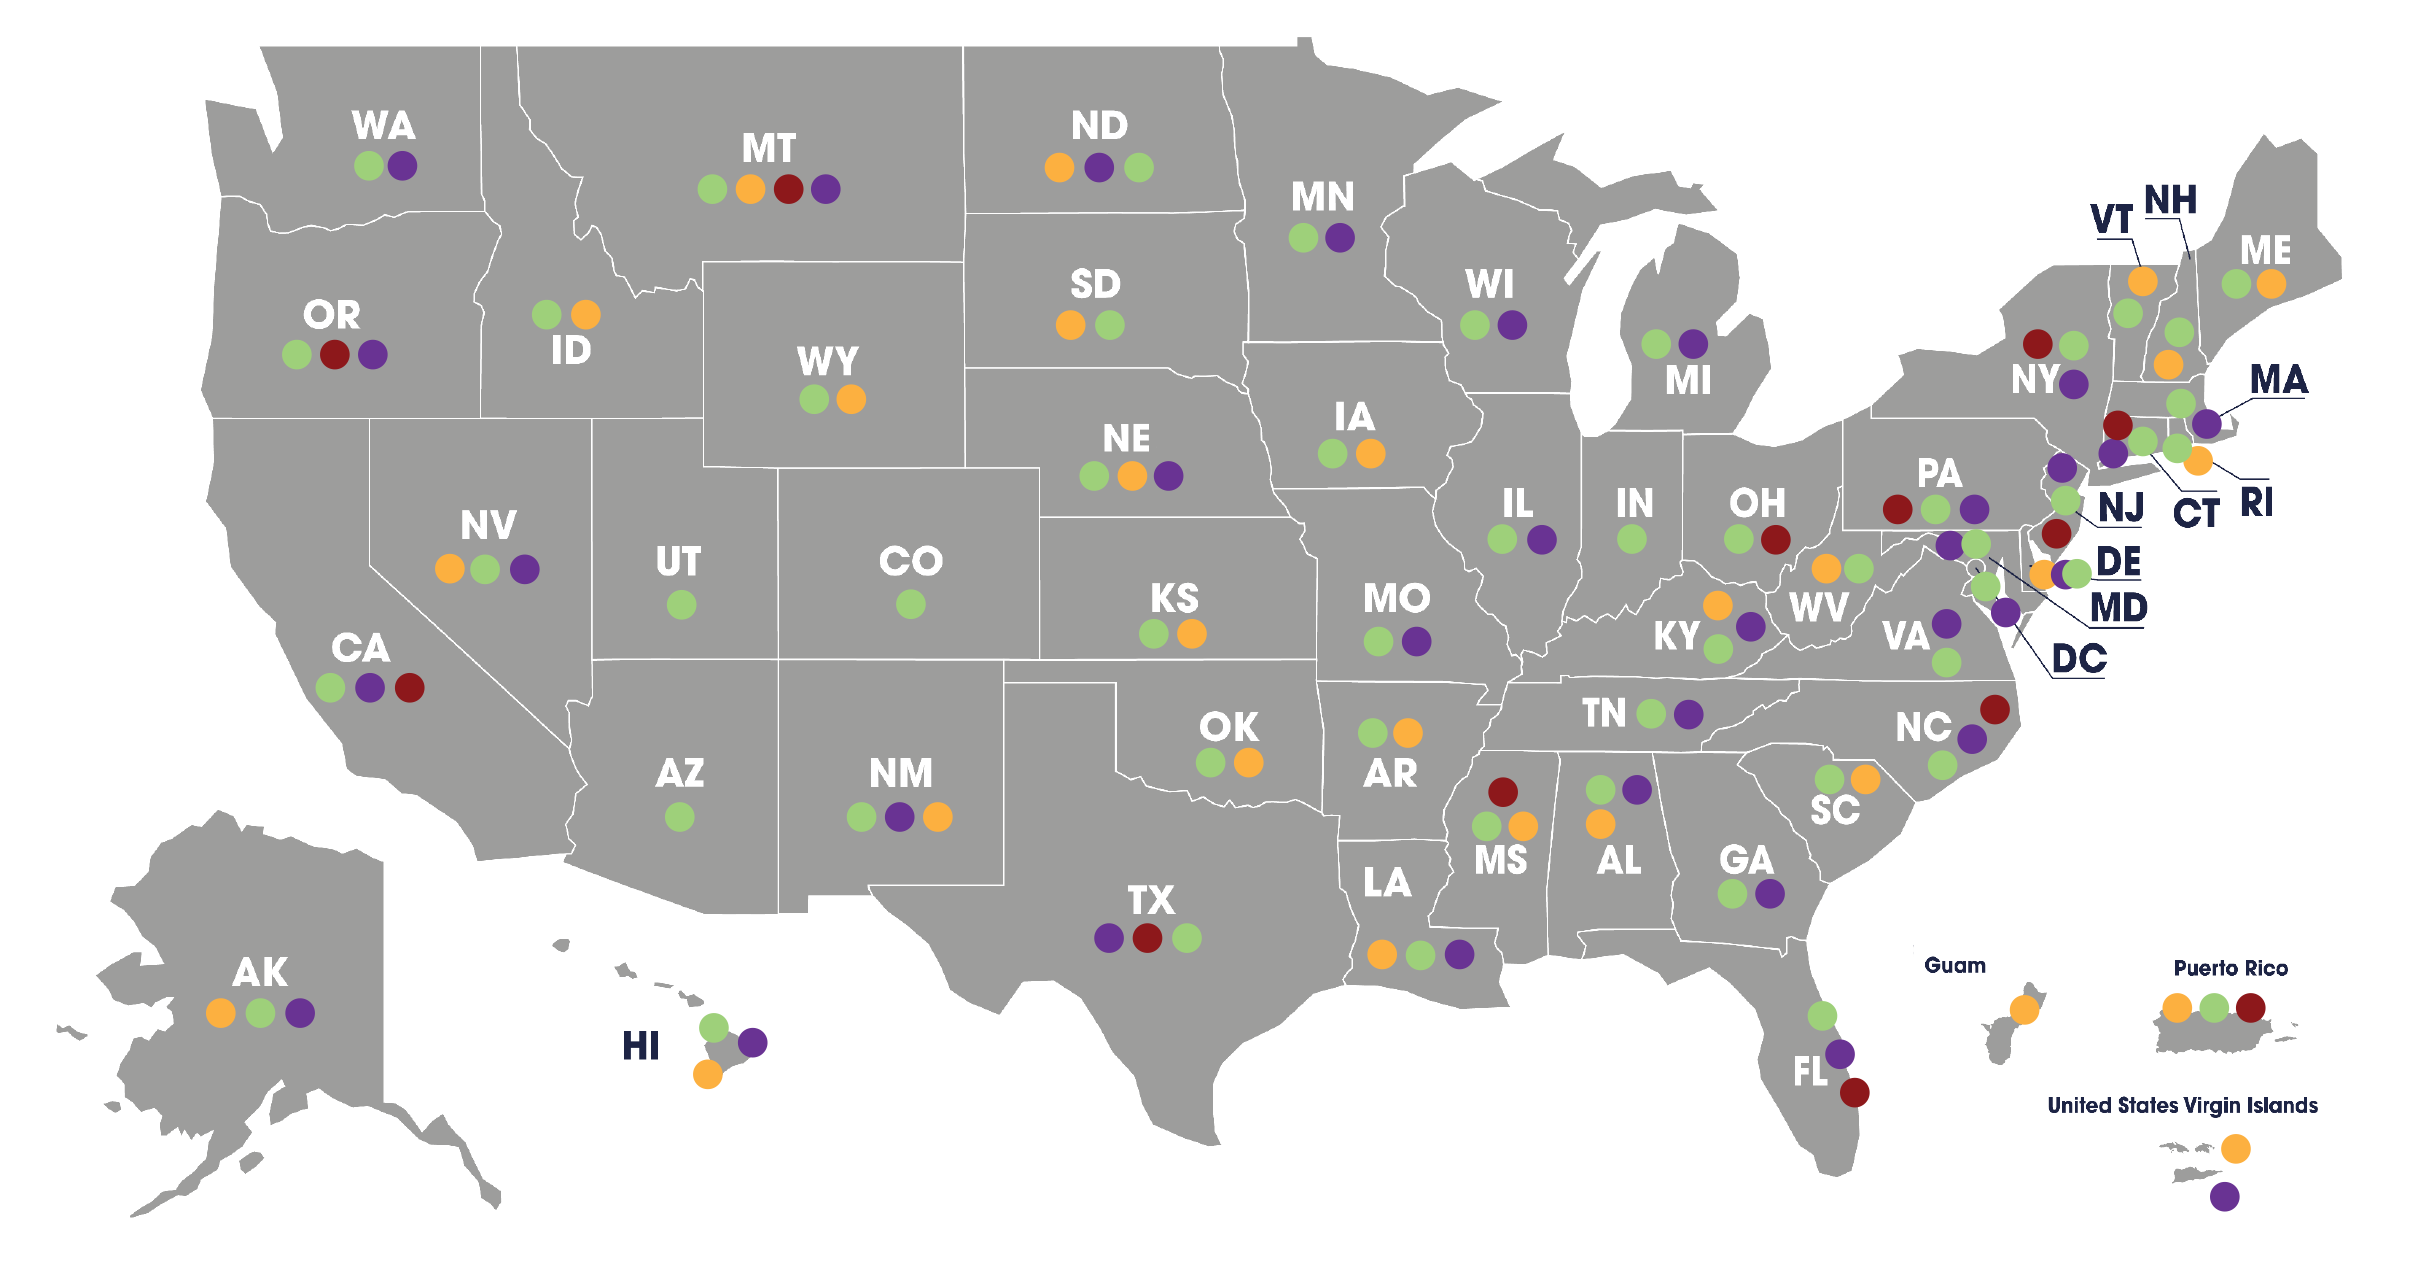
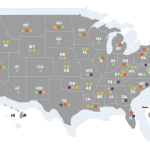
STEM Engagement Reach Map and Metrics
In Fiscal Year 2024, NASA’s Office of STEM Engagement (OSTEM) reached students and educators through institutional awards in all 50 states plus the District of Columbia, Guam, Puerto Rico, and U.S. Virgin Islands.
 | Next Gen STEM • $13.5 million NASA’s Next Gen STEM project is an integrated portfolio of grants, partnerships, activities, educational products, and student opportunities designed to engage K-12 students nationwide in the agency’s missions, people, and resources. The project’s efforts aim to inspire the STEM workforce of tomorrow by bringing the excitement of NASA to students, whether in the classroom, at home, in afterschool programs, or in informal education settings. |
 | Space Grant • $58 million NASA’s National Space Grant College and Fellowship Project (Space Grant) brings together partners from across academia, industry, and government to invest in STEM education and research. Space Grant’s 52 consortia — one in each state as well as Puerto Rico and the District of Columbia — connected to 1,250 affiliated institutions to fund fellowships and awards and create enriching STEM opportunities for Americans to understand and participate in NASA’s aeronautics and space projects. |
 | EPSCoR • $26 million The Established Program to Stimulate Competitive Research (EPSCoR) establishes partnerships with government, higher education, and industry that are designed to effect lasting improvements in a state or region’s research infrastructure, research and development capacity, and its national research and development competitiveness. The NASA EPSCoR project is directed at those jurisdictions that have not participated equitably in competitive aerospace and aerospace-related research activities. Twenty-five states, the Commonwealth of Puerto Rico, the U.S. Virgin Islands, and Guam currently participate. |
 | MUREP • $45.5 million NASA’s Minority University Research and Education Project (MUREP) expands the agency’s reach in communities historically underrepresented in STEM. MUREP offers opportunities for college students at Minority Serving Institutions to contribute to the agency’s exploration goals and also boosts these schools’ research capacity and infrastructure. NASA invests in the Artemis Generation and a diverse future workforce through MUREP’s competitive awards, research opportunities, and engagements at career fairs and conferences. |
STEM Engagement Impacts
See NASA STEM Engagement performance and evaluation impact data and information

STEM Reports
See what NASA STEM Engagement has accomplished
Reach Map and Metrics
See where NASA STEM Engagement has reached learners
Faces of STEM Engagement
Look Who's Interning
Metrics
In Fiscal Year 2024 (October 1, 2023 – September 30, 2024), NASA STEM Engagement Investments (including OSTEM projects) provided 592 awards to institutions and other recipients across 50 states plus the District of Columbia, Guam, Puerto Rico, and U.S. Virgin Islands; engaging 59K+ educator, 970K+ student, and 7.5M+ other participants in NASA STEM engagement activities.
| STEM Engagement Metric (FY 2024) | EPSCoR | NGS | MUREP | Space Grant |
| Institutional Award Data | ||||
| Total # of Institutional Awards | 32 | 17 | 58 (and 25 other recipients) | 53 |
| Total # of Active Awards | 235 | 41 | 193 | 123 |
| Total Institutional Awards Funding Provided | $21.1M | $3.7M | $23.6M | $49.1M |
Institutional Award Data Definitions:
- Institutional Awards represent STEM Engagement investments awarded to lead/primary award institutions (both formal and informal), via a grant/cooperative agreement solicitation and challenge competition processes
- Active Awards represents awards active/operational during the fiscal year
- Institutional Awards Funding Provided represents the amount of funding awarded to lead/primary award institutions (both formal and informal), via a grant/cooperative agreement solicitation and challenge competition processes
| STEM Engagement Metric (FY 2024) | EPSCoR | NGS | MUREP | Space Grant | Other STEM Engagements | Totals |
| Participant Data | ||||||
| Total # of Student Participants | 1136 | 283347 | 21952 | 632094 | 31811 | 970340 |
| Total # of Educator Participants | 911 | 7684 | 1817 | 47308 | 1538 | 59258 |
| Total # of Other Participants | 0 | 7284683 | 1048 | 217571 | 1276 | 7504578 |
Participant Data Definitions:
- Student Participants represents student participants reached through STEM Engagement investments
- Educator Participants represents educator participants reached through STEM Engagement investments
- Other Participants represents general public participants (e.g., uncategorized students of all ages, parents, educators, and adult participants) reached through STEM engagement investments
Additional FY 2024 Key Data Points:
- Space Grant, MUREP, and EPSCoR grantee and awardee institutions reported 3,704 peer-reviewed publications, technical papers and presentations representing opportunities for learners to contribute to NASA’s aeronautics, space and science missions and work
- Notably, 58% percent of the peer-reviewed and other technical publications were authored or coauthored by students
- Over 8.5K students received internships, fellowships, research opportunities, educator professional development, challenges, and other college/pre-college STEM engagement opportunities
- Over $46.9M in direct financial support to higher education participants