


Researchers have untangled puzzling patterns of sinking and rising land to pin down the underground locations where water is being pumped for irrigation.
Scientists have produced a new method that holds the promise of improving groundwater management – critical to both life and agriculture in dry regions. The method sorts out how much underground water loss comes from aquifers confined in clay, which can be drained so dry that they will not recover, and how much comes from soil that’s not confined in an aquifer, which can be replenished by a few years of normal rains.
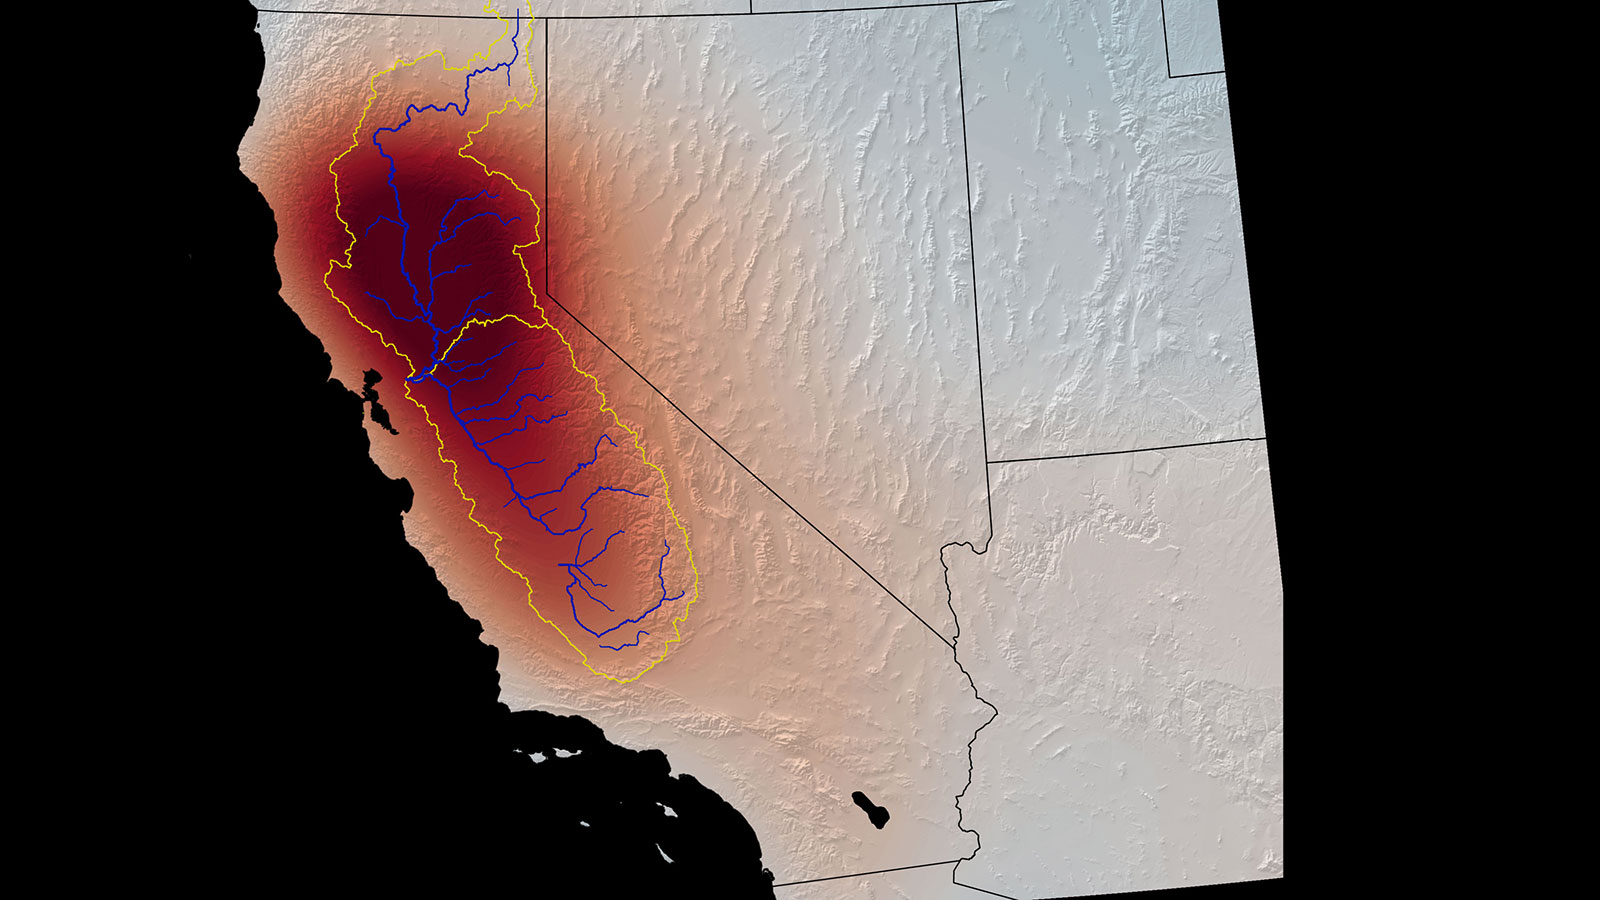
The research team studied California’s Tulare Basin, part of the Central Valley. The team found that the key to distinguishing between these underground sources of water relates to patterns of sinking and rising ground levels in this heavily irrigated agricultural region.
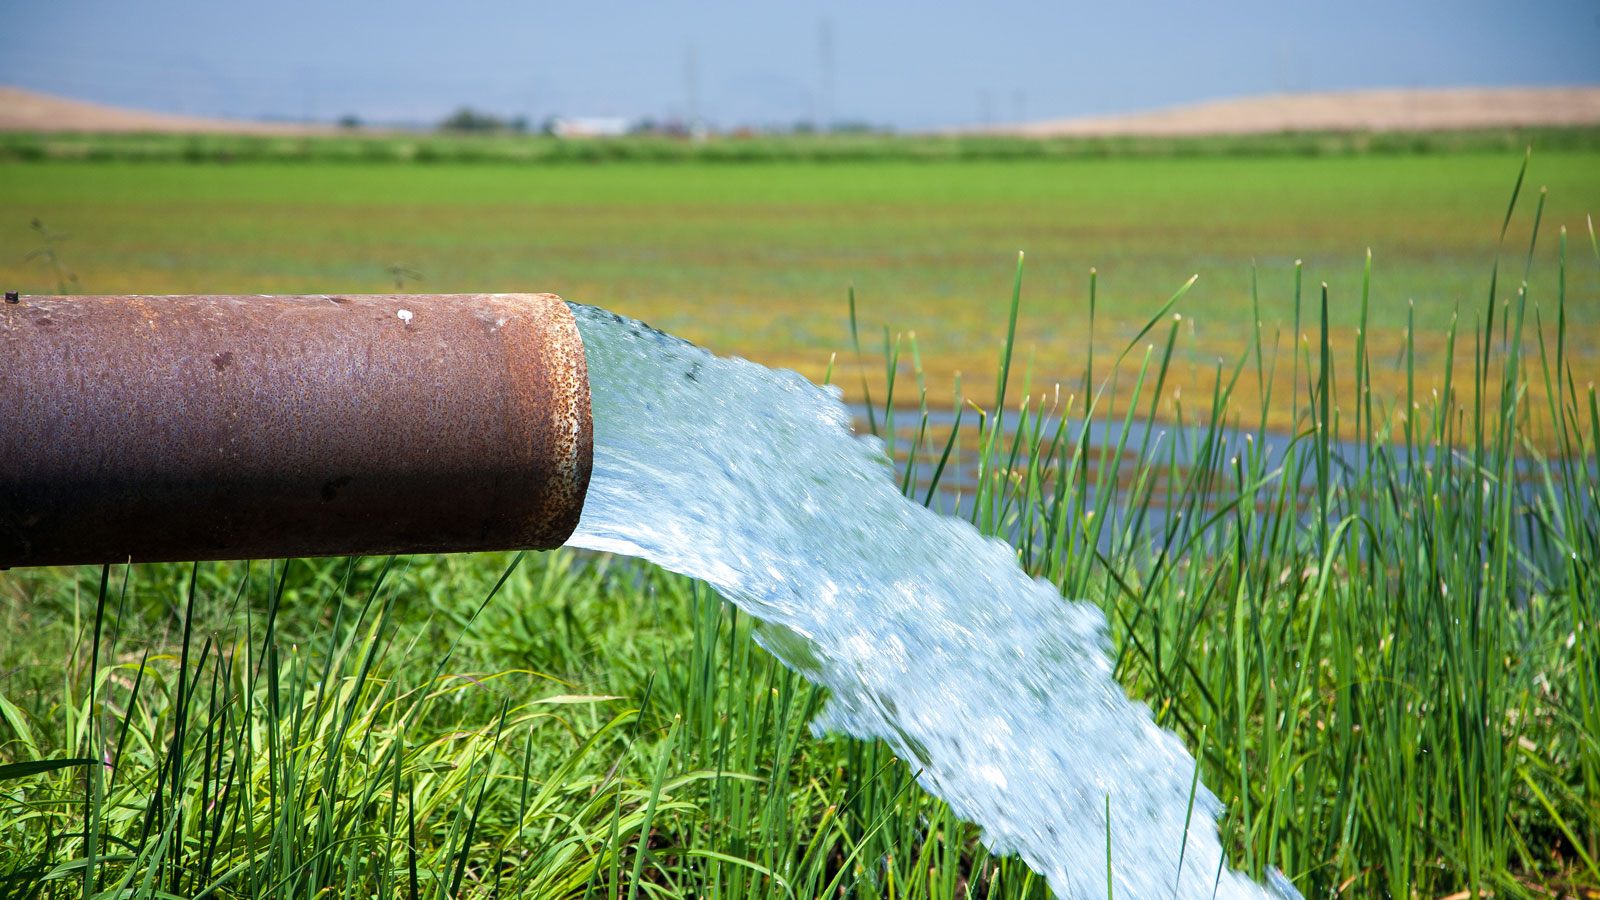
The Central Valley makes up only 1% of U.S. farmland, yet it grows an amazing 40% of the nation’s table fruits, vegetables, and nuts annually. Productivity like that is only possible because farmers augment the valley’s 5 to 10 inches (12 to 25 centimeters) of annual rainfall with extensive groundwater pumping. In drought years, more than 80% of irrigation water comes from underground.
After decades of pumping, underground water resources are dwindling. Wells in the Tulare Basin now must be drilled as much as 3,500 feet (over 1,000 meters) deep to find adequate water. There’s no way to measure exactly how much water remains underground, but managers need to make the wisest use of whatever there is. That involves monitoring whether water is being drawn from aquifers or from loose soil, known as the water table. In this large region with tens of thousands of unmetered wells, the only practical way to do that is by using satellite data.
A research team from NASA’s Jet Propulsion Laboratory in Southern California and the U.S. Department of Energy’s Lawrence Berkeley Laboratory in Northern California set out to create a method that would do exactly that. They attacked the problem by combining data on water loss from U.S.-European Gravity Recovery and Climate Experiment (GRACE) and GRACE Follow-On satellites with data on ground-level changes from a ESA (European Space Agency) Sentinel-1 satellite. Ground-level changes in this region are often related to water loss because when ground is drained of water, it eventually slumps together and sinks into the spaces where water used to be – a process called subsidence.
The Tulare Basin is subsiding drastically: The current rate is about one foot (0.3 meters) of sinkage per year. But from one month to the next, the ground may drop, rise or stay the same. What’s more, these changes don’t always line up with expected causes. For example, after a heavy rainfall, the water table rises. It seems obvious that this would cause the ground level to rise, too, but it sometimes sinks instead.
The researchers thought these mysterious short-term variations might hold the key to determining the sources of pumped water. “The main question was, how do we interpret the change that’s happening on these shorter time scales: Is it just a blip, or is it important?” said Kyra Kim, a postdoctoral fellow at JPL and coauthor of the paper, which appeared in Scientific Reports.
Clay vs. Sand
Kim and her colleagues believed the changes were related to the different kinds of soils in the basin. Aquifers are confined by layers of stiff, impermeable clay, whereas unconfined soil is looser. When water is pumped from an aquifer, the clay takes a while to compress in response to the weight of land mass pressing down from above. Unconfined soil, on the other hand, rises or falls more quickly in response to rain or pumping.
The researchers created a simple numerical model of these two layers of soils in the Tulare Basin. By removing the long-term subsidence trend from the ground-level-change data, they produced a dataset of only the month-to-month variations. Their model revealed that on this time scale, virtually all of the ground-level change can be explained by changes in aquifers, not in the water table.
For example, in spring, there’s little rainfall in the Central Valley, so the water table is usually sinking. But runoff from snow in the Sierra Nevada is recharging the aquifers, and that causes the ground level to rise. When rainfall is causing the water table to rise, if the aquifers are compressing at the same time from being pumped during the preceding dry season, the ground level will fall. The model correctly reproduced the effects of weather events like heavy rainfalls in the winter of 2016-17. It also matched the small amount of available data from wells and GPS.
Kim pointed out that the new model can be repurposed to represent other agricultural regions where groundwater use needs to be better monitored. With a planned launch in 2023, the NASA-ISRO (Indian Space Research Organisation) Synthetic Aperture Radar (NISAR) mission will measure changes in ground level at even higher resolution than Sentinel-1. Researchers will be able to combine NISAR’s dataset with data from GRACE Follow-On in this model for the benefit of agriculture around the globe. “We’re heading toward a really beautiful marriage between remote sensing and numerical models to bring everything together,” Kim said.
Jane J. Lee / Andrew Wang
Jet Propulsion Laboratory, Pasadena, Calif.
818-354-0307 / 626-379-6874
jane.j.lee@jpl.nasa.gov / andrew.wang@jpl.nasa.gov
Written by Carol Rasmussen
2022-045