


NEPA Metrics
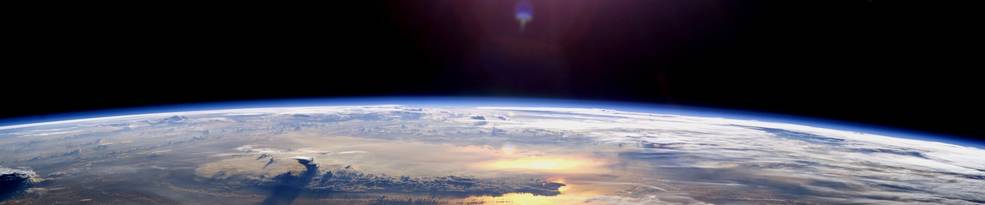
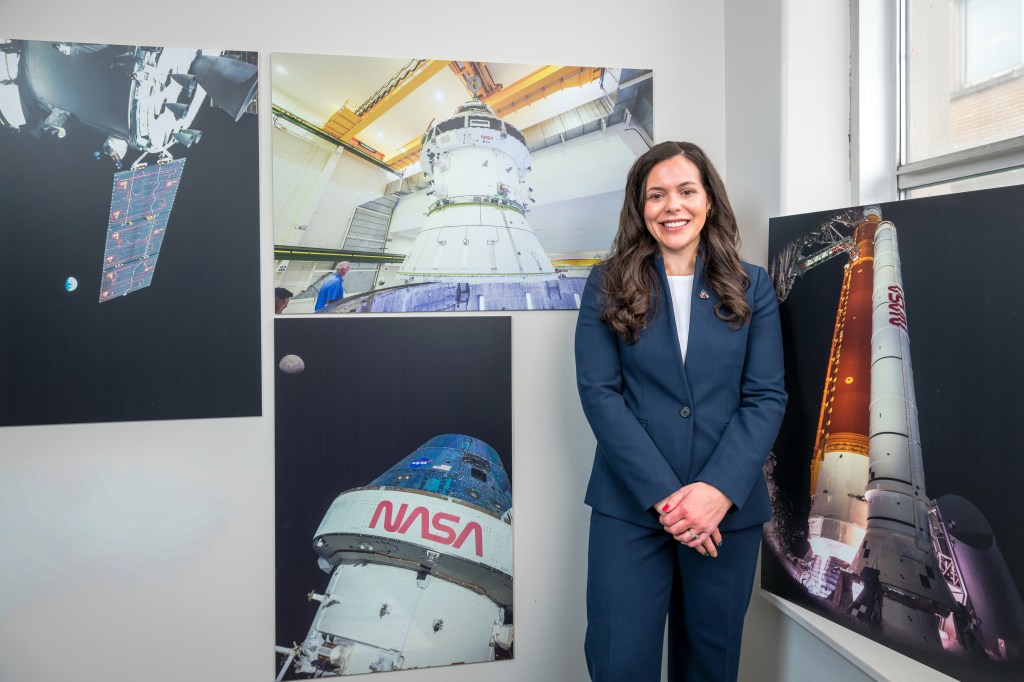
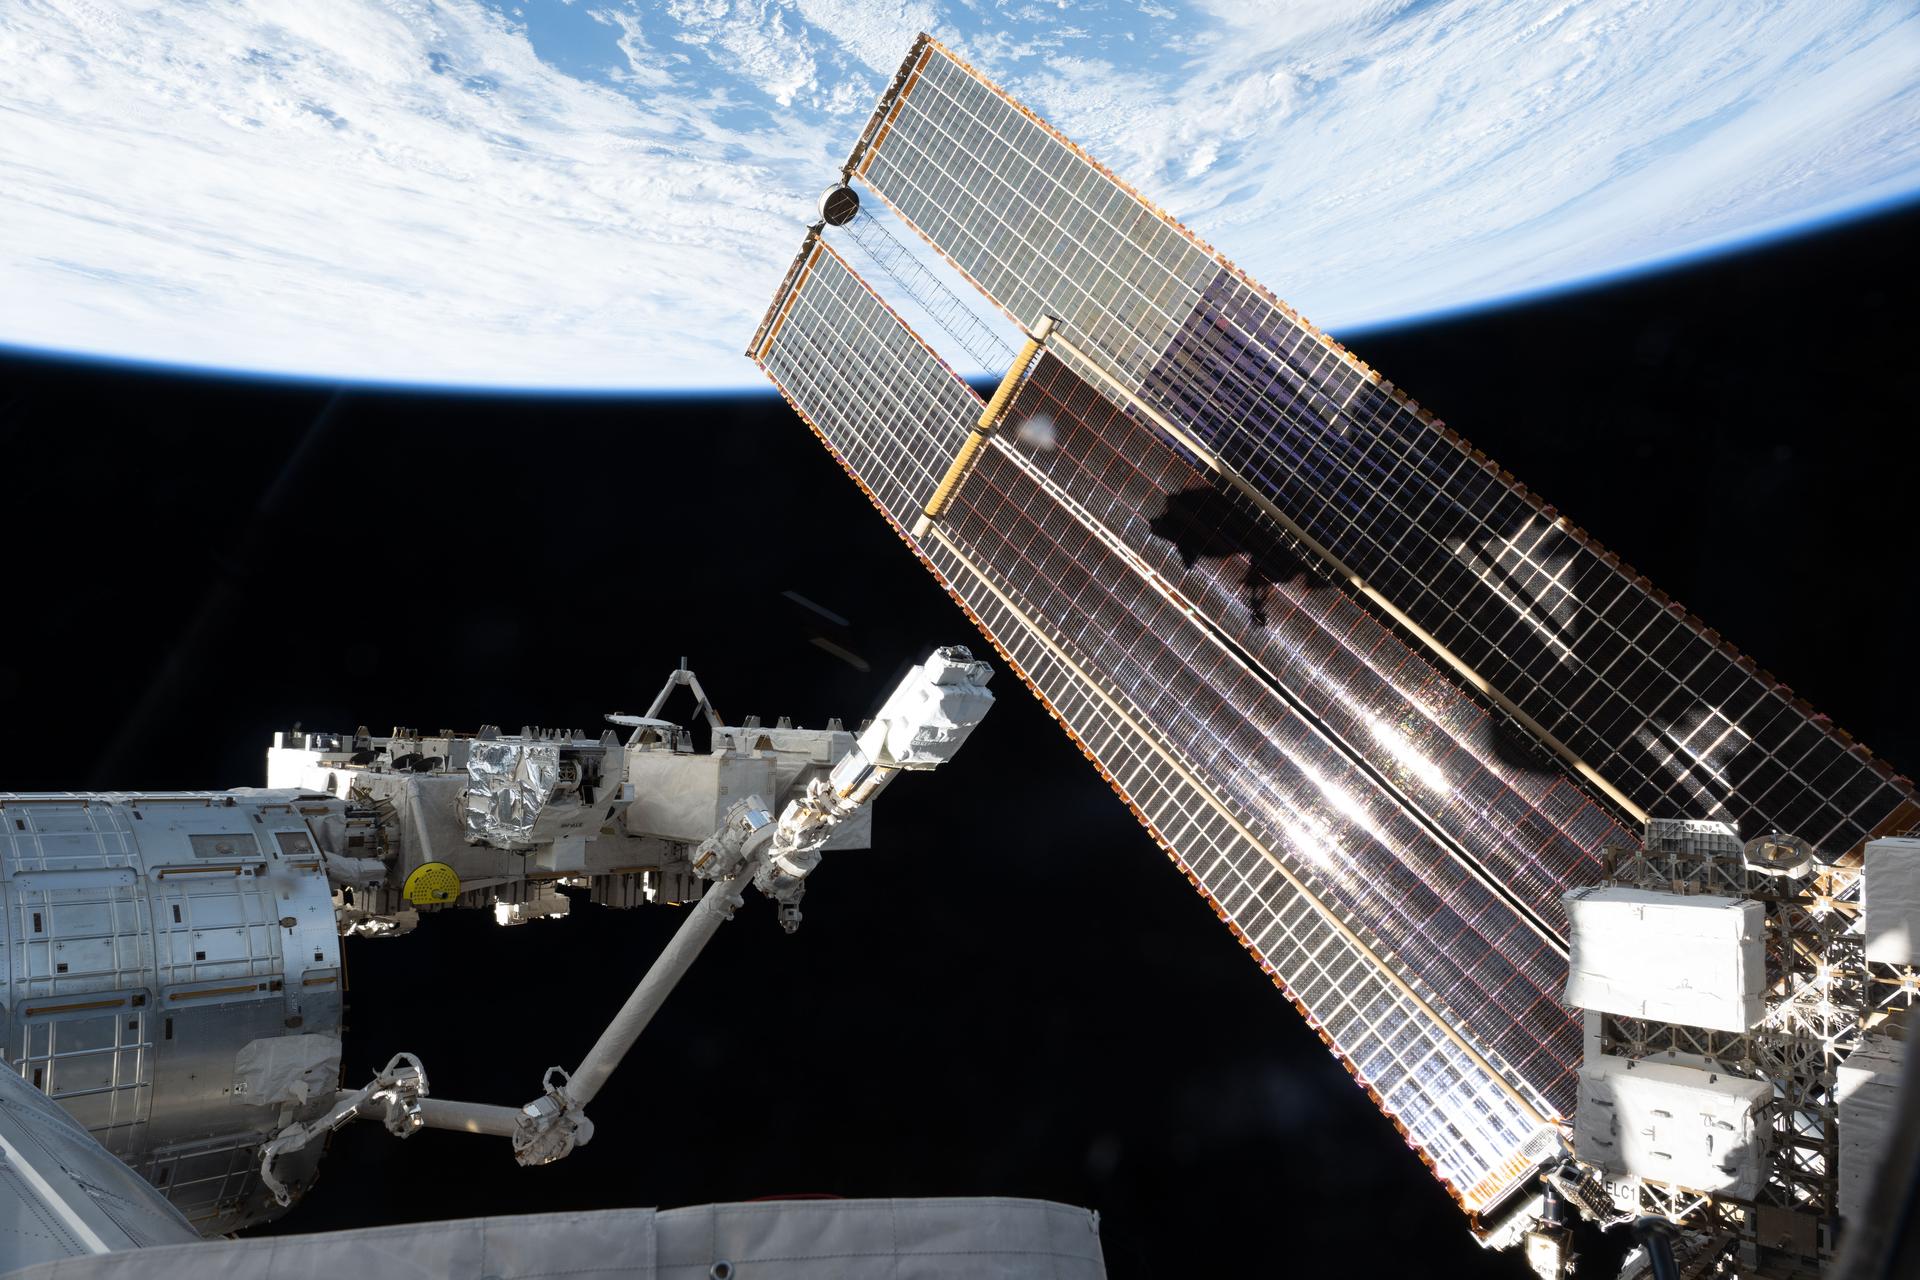
NASA’s ‘Earth Rising’ photograph
Figure 1 below shows the quantities of documents by category developed by the entire Agency over the 19-year period from 2000 to 2019. No trending pattern in the development of documents should be inferred as the scope and frequency of document development is a result of the NEPA process and the life-cycle phases of NASA programs.
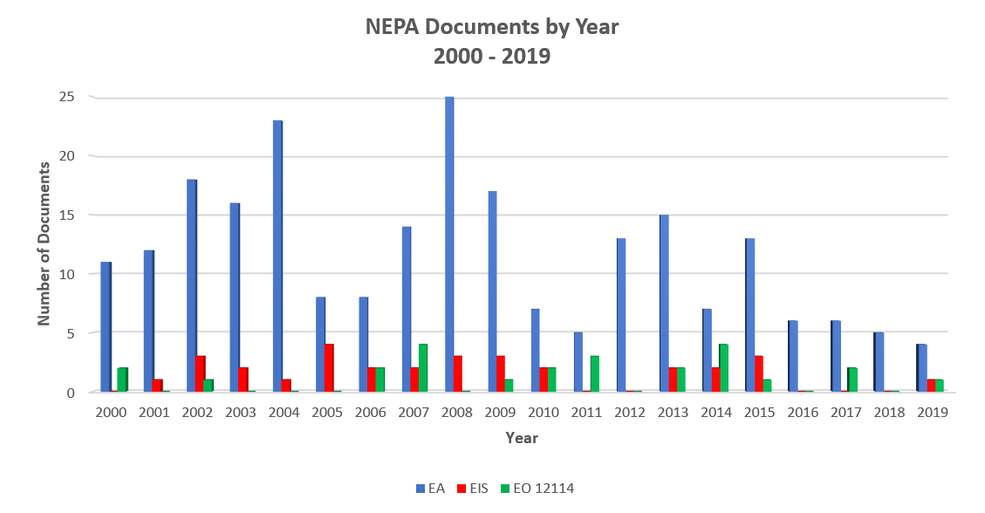
Figure 1: NASA NEPA Documents by Year 2000 to 2019
Figure 2 below shows a distribution of NEPA documents by NASA Center or component facilities for the 24-year period from 1995 to 2019. This figure shows that NEPA analyses are performed across the entire Agency as part of a robust environmental program at NASA.
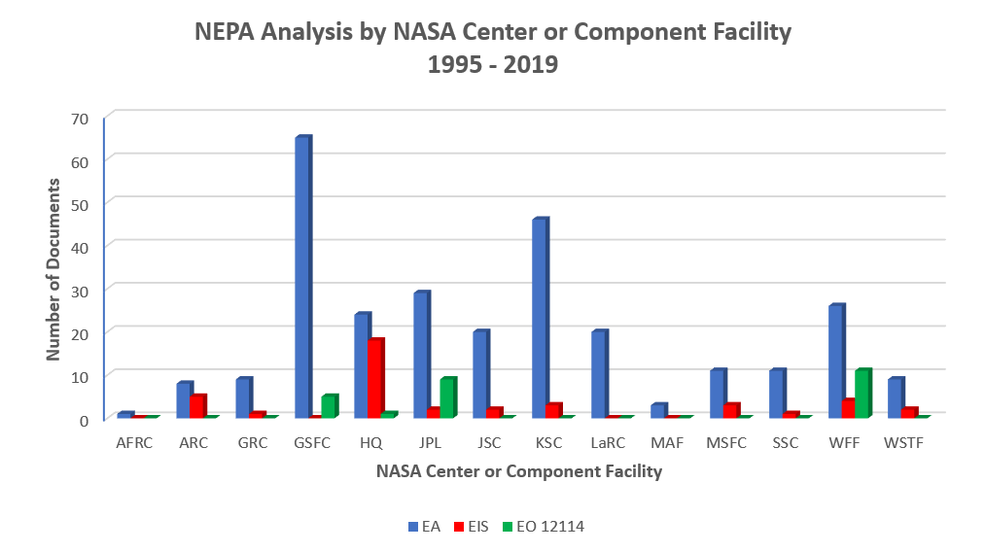
Figure 2: NEPA Analysis by NASA Centers or Component Facilities 1995 to 2019