


Weather Ballon Flight Data Visualization
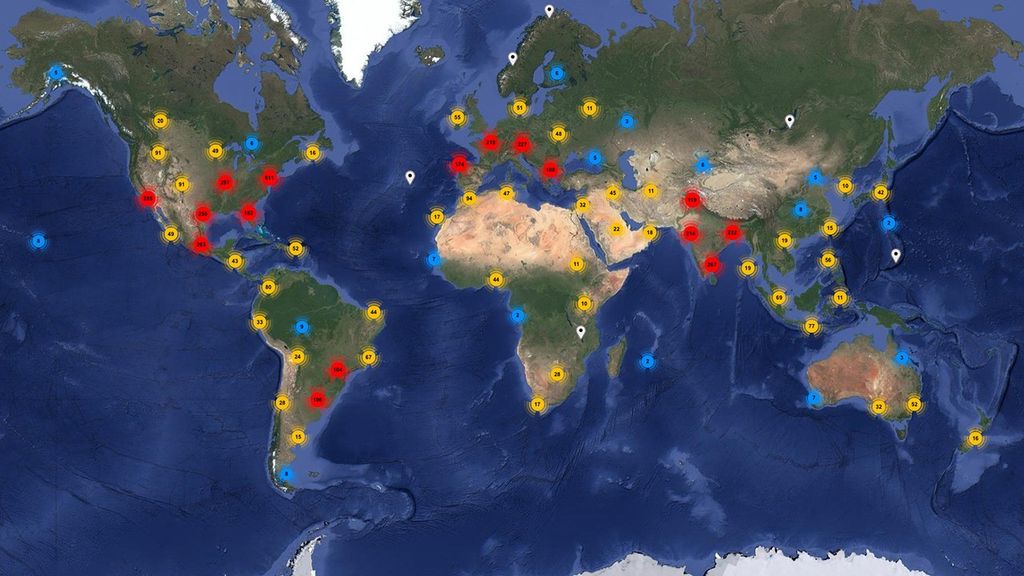
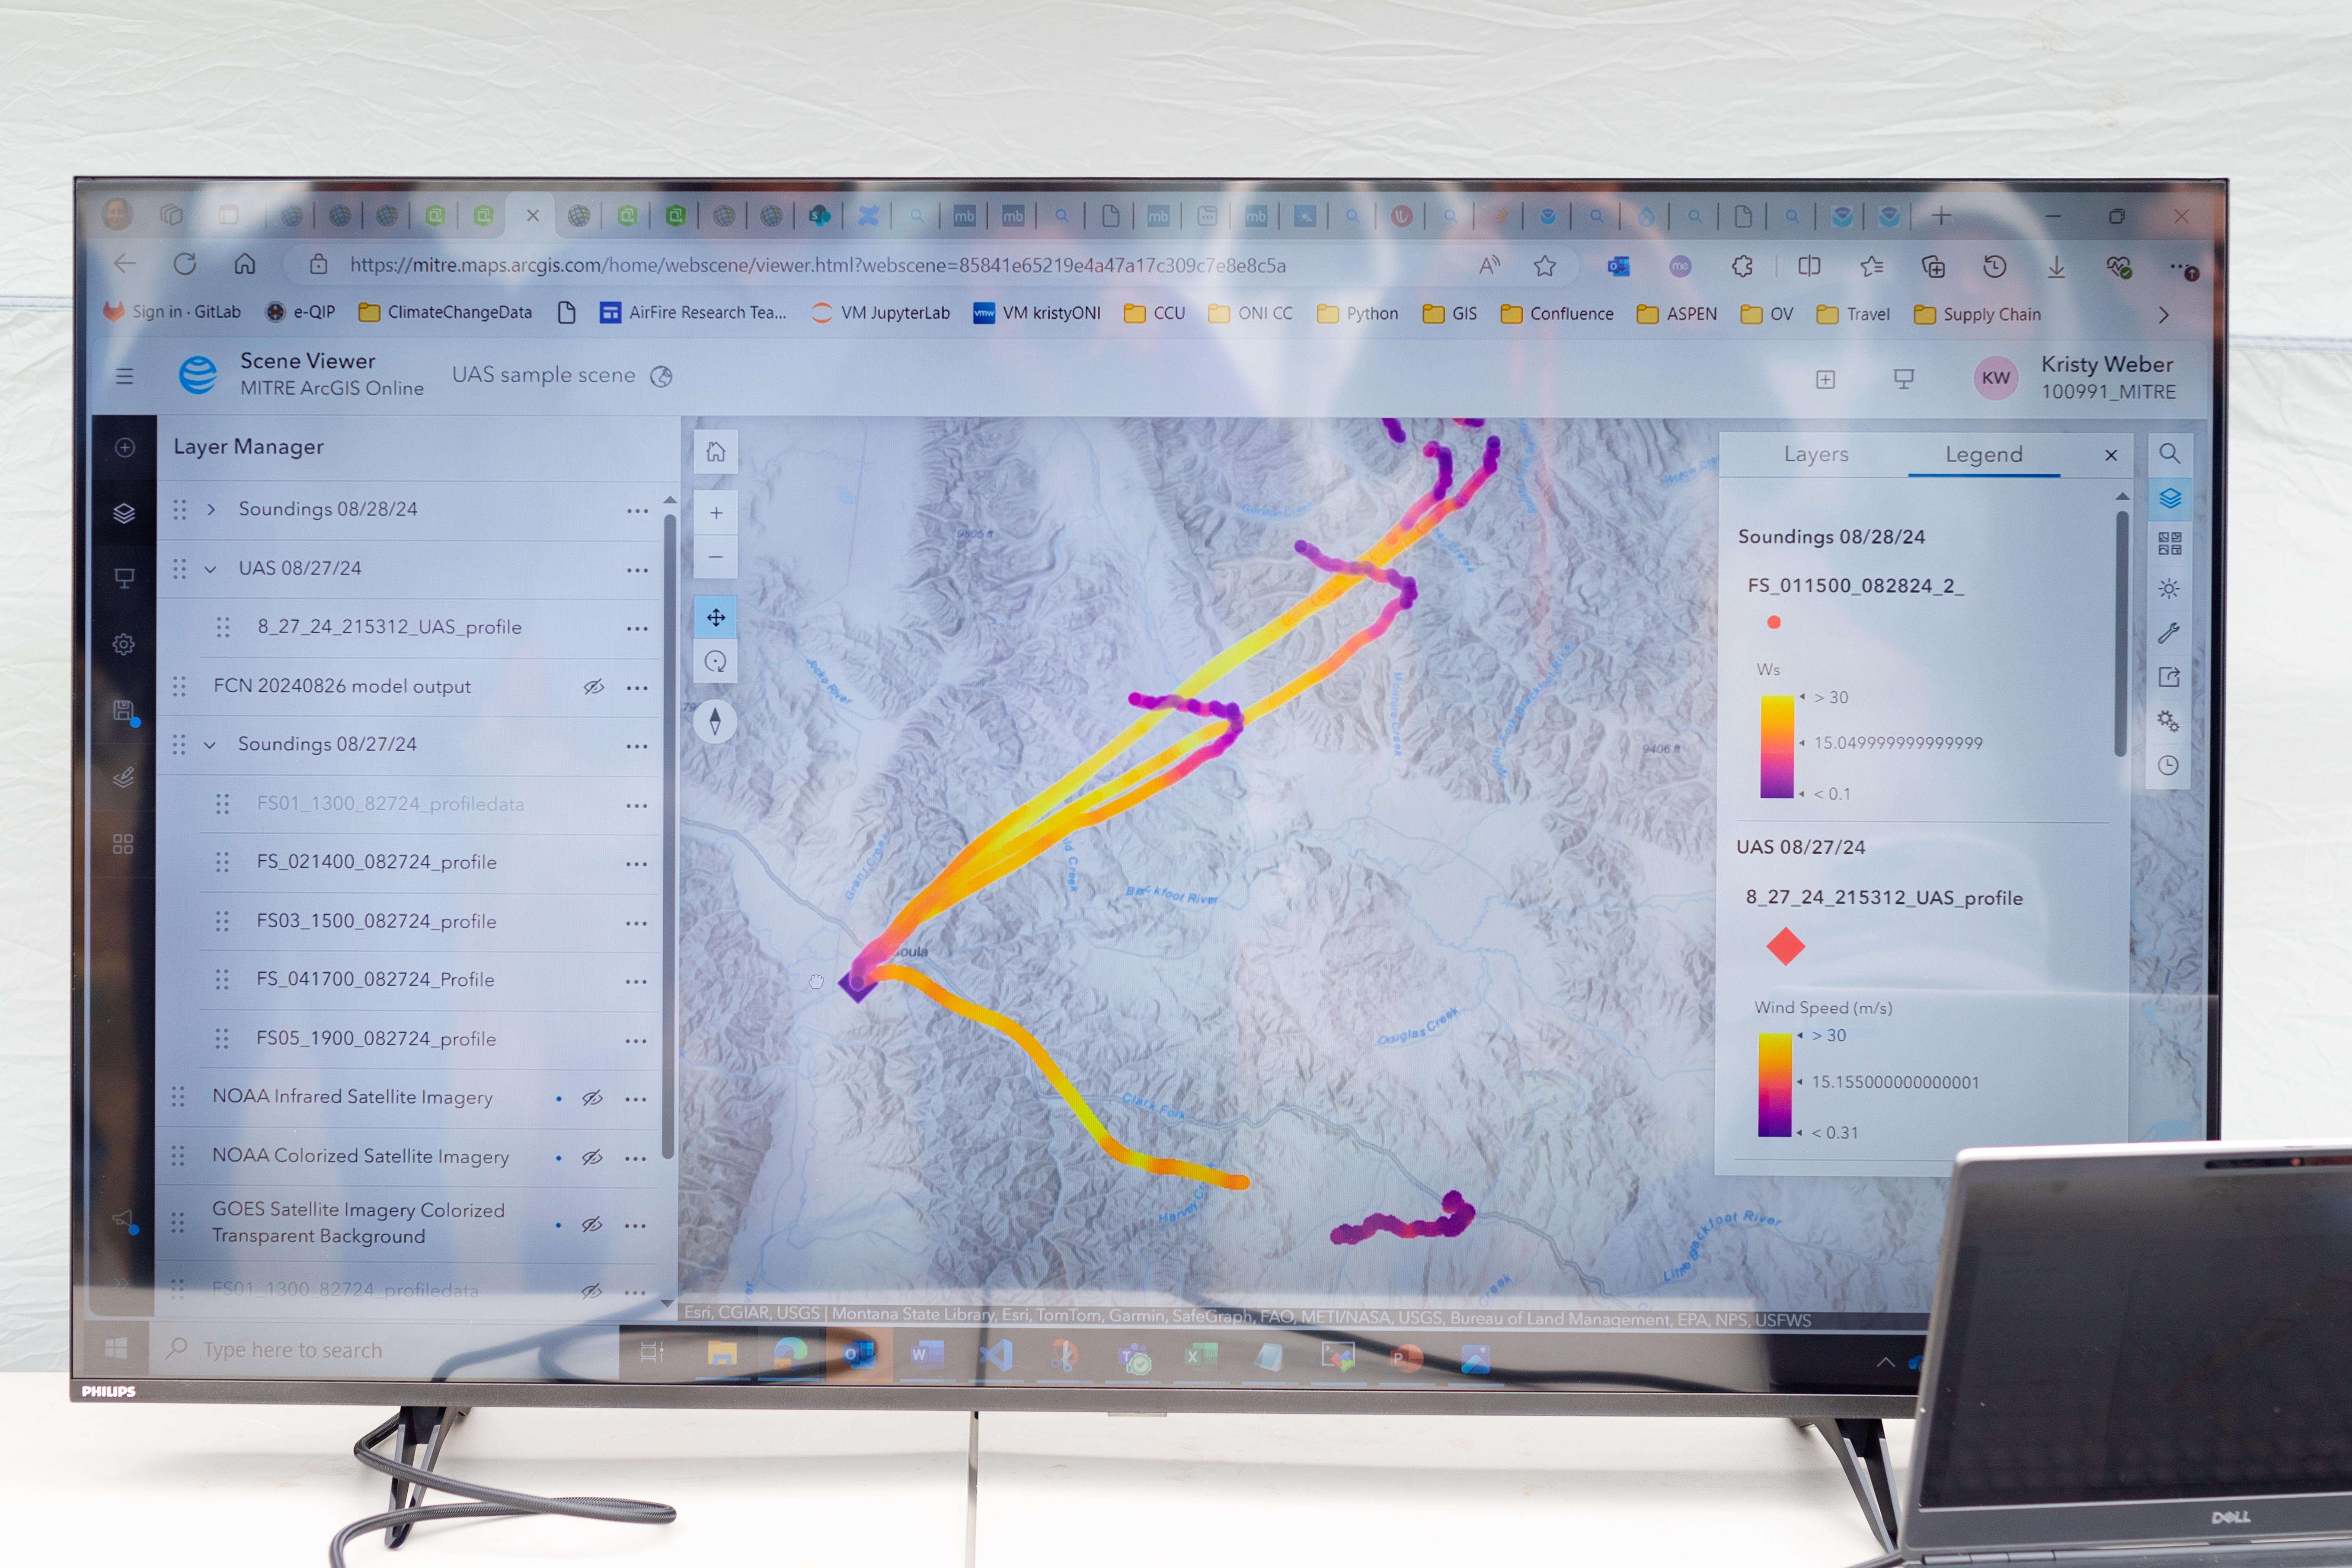
An early data visualization from the Esri team shows the flight paths of weather balloons launched on the first day of the FireSense UAS technology demonstration in Missoula. The paths are color-coded by wind speed, from purple (low wind) to bright yellow (high wind).
Image Credit: NASA/Milan Loiacono
- X
https://www.nasa.gov/image-detail/firesensemissoula-loiacono-2778/
Image CreditNASA/Milan Loiacono
Size5440x3627px