


Faculty Advisor:
Henry Houskeper, Woods Hole Oceanographic Institute
Graduate Mentor:
Camille Pawlak, University of California, Los Angeles
Oceans Group Introduction
Faculty Advisor Henry Housekeeper
Molly McKellar
Spatiotemporal dynamics of canopy-forming kelp forests in the Russian province of Kamchatka
Maria (Molly) McKellar, University of Wisconsin, Madison
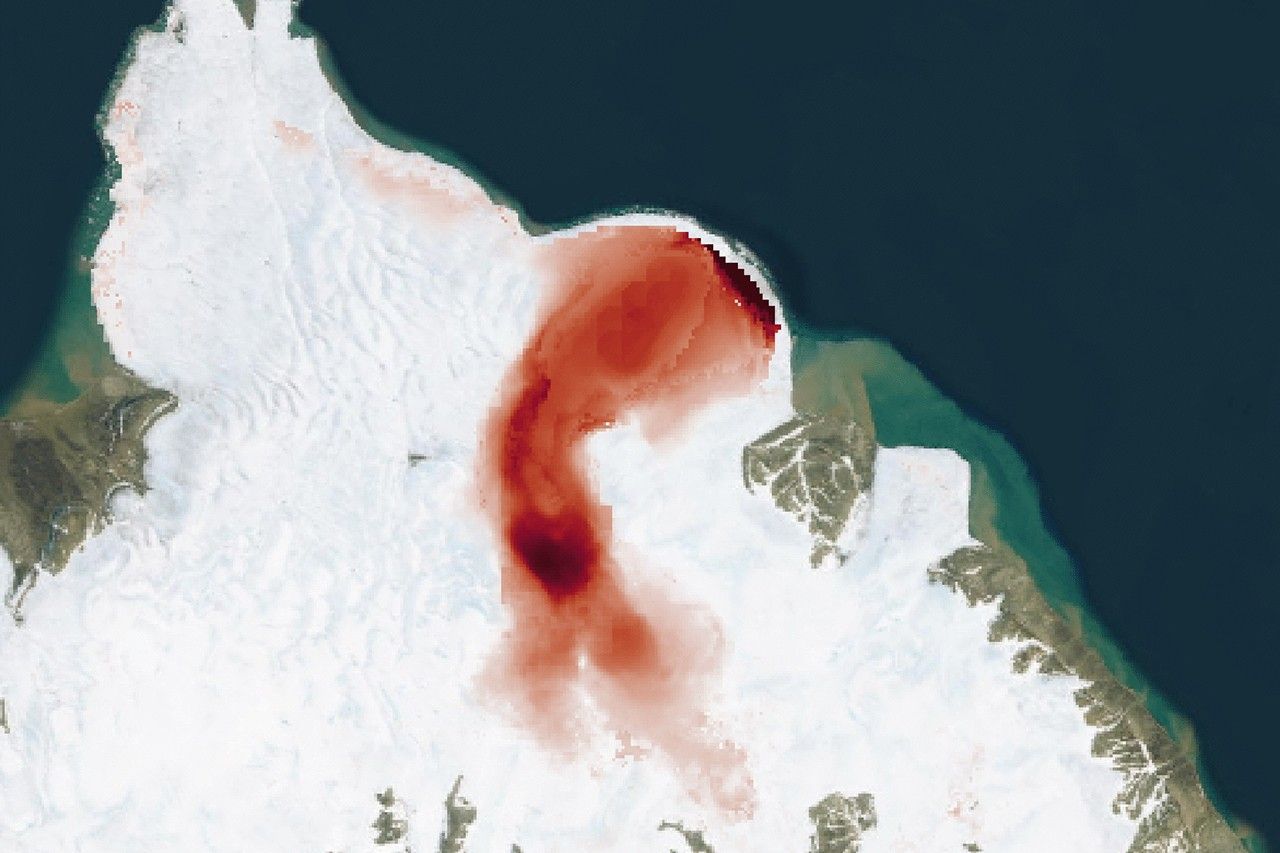
Interannual variability in canopy-forming kelps and the environmental conditions in which kelps thrive have not been studied extensively in the Kamchatka region of eastern Russia. Canopy forming kelps promote diverse and productive coastal ecosystems by boosting coastal resilience and supporting ecological communities. To better understand how kelp in the Kamchatka region contributes to these impacts, we must understand the spatiotemporal dynamics and drivers of kelp forests in the region. In this study, we evaluate spatiotemporal patterns in kelp canopy, including characterizing the climatology and assessing medium and long-term trends. We compare patterns in kelp forest dynamics with biological parameters, such as satellite-derived chlorophyll-a time series, as well as climatological indices, such as the Pacific Decadal Oscillation (PDO) and the Northern Pacific Gyre Oscillation (NPGO). New data from Kelpwatch, a global dataset utilizing Landsat satellite imagery, was used to map kelp canopy area from 1999 to present with quarterly resolution. This study is the first spatially resolved analysis of canopy-forming kelps in the Kamchatka region. Kelp area time series were assessed in three sub-regions corresponding to the eastern, western, and southern margins of Kamchatka. We found that the spatial extent of kelp across the entire region is maximal in the third quarter, which encompasses July 1 to September 30 and corresponds to the latter portion of the northern hemisphere growing season. We observed kelp forest patterns to vary spatially, with the southern subregion indicating a positive trend in climatologically adjusted canopy area. Pearson correlation indicated a strong relationship between phytoplankton and kelp dynamics in the southern subregion, perhaps suggesting the importance of nitrate as a regional driver of kelp forest variability. A weak correlation was found between the PDO and NPGO across the entire Kamchatka region and within the eastern and western subregions. While these results support a primary importance of nutrients to kelp population dynamics in the southern region, more work must be done to understand drivers of nutrients variability in Kamchatka. Further investigation of subregional dynamics is warranted given the climatological and mixing differences between the Sea of Okhotsk and the western Pacific Ocean, which each border Kamchatka. Sea surface temperature may also have an impact on kelp forests and should be considered. Understanding regional patterns and trends in Kamchatka would strengthen our understanding of spatiotemporal variability in kelp at global scales and the key associated drivers, including resolving key oceanic and atmospheric processes or modes. The findings supporting positive trends of kelp area in the southern portion of Kamchatka warrants further future research and investigation.
Grace Woerner
Tropical Storm Effects on Ocean Dynamics Measured Through a Multi-Platform Observing Approach
Grace Woerner, North Carolina State University
Elevated low-latitude sea surface temperatures (SSTs) are associated with heightened intensity and frequency of tropical cyclone events. Tropical systems can modify surface marine ecosystems, often to the detriment of coastal communities and fisheries. Characterizing ocean properties before and after storm events can provide insight into storm-driven mixing and corresponding ecosystem responses. However, extreme conditions during tropical storms can impede ocean observing. For example, satellite remote sensing of SST and ocean color during tropical storms is challenged by cloud cover and surface disturbances such as white capping. This study pairs satellite remote sensing observations with in-situ oceanographic data to characterize oceanographic changes in phytoplankton concentrations and SST associated with a tropical cyclone in the western Pacific during March 2024 to April 2025. Chlorophyll-a is a pigment present in phytoplankton and is commonly used as a proxy for estimating phytoplankton abundance. In-situ chlorophyll-a and SST measurements collected by Argo floats were used to validate satellite ocean color observations from the NASA Plankton, Aerosols, Clouds, ocean Ecosystem (PACE) mission and SST from the Multi-scale Ultra-high Resolution (MUR) dataset before and after Typhoon ShanShan, the equivalent of a category four hurricane. The PACE observations indicate agreement with Argo float data, albeit with a slight positive bias and variability in post-storm conditions. MUR SST data also closely matched Argo measurements. It was found that the typhoon passage did not produce a detectable chlorophyll-a anomaly. This finding was further investigated by comparing changes in the mixed layer depth (MLD) and assessing whether the observed storm-induced mixing reached adequate depths to significantly increase surface nitrogen concentrations, prerequisite to inducing a phytoplankton bloom. The findings suggest that while the MLD deepened, deepening was inadequate at regional scales to bring nitrate and other nutrients to the surface. Although Typhoon Shanshan did not generate mixing deeper than the nutricline, more powerful storms or those occurring in waters with shallower nutriclines may more effectively introduce nutrients into surface waters. Limitations such as cloud coverage for satellite observing, plus the sampling frequency, coverage, and sensor availability of Argo float observations, highlight the importance of continued multi-platform observations for ocean environments to advance knowledge of tropical cyclone effects on surface ocean ecosystems.
Alex Lacayo
Peruvian Coastal Water Temperature Anomalies Correspond to Variability in El Niño Position and Timing
Alex Lacayo, Columbia University
The El Niño–Southern Oscillation (ENSO) is a basin-scale oscillation pattern in the tropical Pacific that drives, via teleconnections, atmospheric and oceanic variability at larger scales. El Niño events are ENSO phenomena defined by anomalously warm sea surface temperatures (SSTs) in low-latitude Pacific domains, and the spatial and temporal expression of El Niño events can vary. Recent literature has established distinct differences between the spatial expression of SST anomalies associated with El Niño events. Elevated SST in the Central (often called “Modoki”) and Eastern equatorial Pacific, for example, have been described as so-called El Niño “flavors” and are associated with different responses across global environments.
This study investigates the relationship between El Niño variability and coastal upwelling within Peru’s Exclusive Economic Zone (EEZ), using satellite-derived SST as a proxy. Coastal upwelling is a vital driver of strongly elevated biological productivity in the Peru EEZ, sustaining one of the globe’s most productive fisheries and the largest anchovy stock worldwide. This analysis evaluates SST anomalies in the Peruvian EEZ as a function of the spatiotemporal dynamics of SST in the tropical Pacific during the onset and evolution of El Niño events spanning the past three decades. The analysis is conducted for two domains in the Peruvian EEZ. The first corresponds to primarily north-south coastline north of Pisco, and the second to the northwest-southeast coastline south of Pisco. Preliminary findings are consistent with Modoki events corresponding to less pronounced warming in Peru during El Niño peaks, along with a lag in post-event upwelling rebound response, compared to Eastern Pacific events. The findings indicate that seasonal timing of El Niño events modify the strength of temperature anomalies in coastal Peru. The subregional comparison suggests that the northern Peruvian EEZ is more impacted by El Niño timing and position variability, likely consistent with its lower latitude and exposure to Kelvin wave propagation. These findings support improved knowledge of how different El Niño expressions influence Peruvian coastal ecosystems, which is critical for assessing ecosystem resilience and informing the management of coastal fisheries.
Melanie Lin
Utility of SAR in detection of canopy-forming kelp in South Africa
Melanie Lin, Boston University
Kelp forests are valuable to coastal cities and towns because they support marine ecosystems, benefit economies, and dampen the effects of waves and erosion. This study aims to understand the extent to which synthetic aperture radar (SAR) can be used to accurately map the distribution of the South African canopy-forming kelp, Ecklonia maxima, or sea bamboo. SAR data was obtained from Sentinel-1, which has a five-day revisit time. SAR observations use radio waves, which penetrate clouds, thereby supporting observations of kelp forest habitat in any cloud condition. Despite the potential to use SAR to increase data availability on cloudy days, there are fewer SAR products for kelp canopy—especially sea bamboo—relative to passive optical remote sensing, which is obstructed by clouds. SAR observations were validated by comparing with manually classified optical imagery obtained using Airborne Visible Infrared Imagining Spectrometer – Next Generation (AVIRIS-NG), which was flown on NASA’s Gulfstream III in 2023 as part of The Biodiversity Survey of the Cape (BioSCape). BioSCape was an integrated field and airborne campaign collaboration between the United States and South Africa to study the biodiversity of the Great Cape Floristic Region (GCFR). More commonly used passive optical remote sensing datasets were also assessed using imagery from Landsat that had been classified using a random forest. This research shows that SAR observations yield distinct values between kelp and ocean, indicating potential to use SAR data to map kelp canopy extent in calm oceanic conditions. SAR observations in the VH (vertically transmitted, horizontally received) polarization indicates a larger distinction between kelp and calm ocean water than data in the VV (vertically transmitted, vertically received) polarization. The sensitivity and responsivity of SAR kelp forest retrievals was dependent on the tidal state during the data acquisition. In VH polarized data, a lower tidal state supports more accurate classifications between kelp and calm ocean water than a high tidal state. Waves, which may contain kelp beneath them, obscure kelp backscatter response in SAR data. This study improves understanding of the utility of SAR for mapping sea bamboo extent, which in turn supports future opportunities to develop better understanding of marine biodiversity and coastal resilience in the GCFR where sea bamboo is the dominant canopy-forming taxa.
John Lund
Kinetic energy of multiscale oceanic features derived from SWOT altimetry
John Lund, Adelphi University
Oceanic eddies are circular movements of water that separate the main flow and facilitate oceanic energy transfer across multiple scales, thereby underlying biophysical interactions and modifying climate and ocean dynamics. Oceanic eddies correspond to dynamics spanning geostrophic to ageostrophic processes, spatial scales spanning 0.1 to 100 km, and temporal scales spanning hours to months. Eddies spanning horizontal spatial scales of 0.1 to 10 km and temporal scales of hours to days, termed submesoscale eddies, are difficult to resolve from legacy satellites due to the finer spatial resolution requirements for observing smaller scale features. Conversely, eddies spanning larger horizontal spatial scales and longer temporal scales, termed mesoscale eddies, are more readily resolved using legacy satellite altimeters. This research utilizes observations from the recently launched Surface Water and Ocean Topography’s (SWOT) Ka-band Radar Interferometer (KaRIn) to resolve submesoscale eddies and quantify associated kinetic energy. We contextualize our SSHA observations using the Data Unification and Altimeter Combination System (DUACS)—a project that merges satellite data to observe coarser mesoscale fields on a global scale—to visualize ocean dynamics around SWOT swaths more clearly. Comparing the kinetic energy associated with SWOT-detected features to that estimated from DUACS data supports improved understanding of the relative importance of the submesoscale in global energy transfer. Results from this investigation demonstrate that SWOT supports characterizations of features at the upper bound of the submesoscale to analyze ocean dynamics and energy cascades at specific moments and locations. Resolving the temporal dynamics of submesoscale features remains challenging due to SWOT’s 21-day revisit cycle, which also limits submesoscale characterizations to isolated swaths, but novel SWOT observations nonetheless support snapshot opportunities to constrain the role of submesoscale processes in global energy transfer. Future directions with SWOT include coupling data with high-resolution numerical models or additional satellite missions such as PACE to map a wider region and investigate key controls on biophysical interactions associated with submesoscale processes.
Logan Jewell
Machine Learning Classification of Remote Sensing Imagery for Investigating Changes in Natural Oil Seepage
Logan Jewell, State University of New York, Brockport
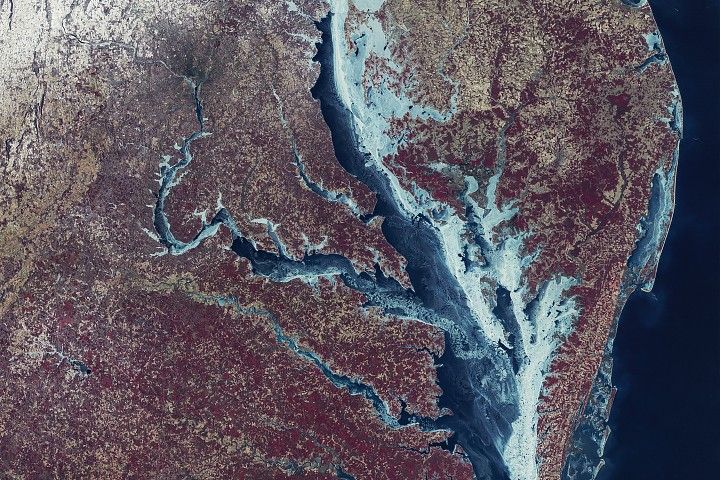
Spatiotemporal variability in oil content of the Santa Barbara Channel (SBC) corresponds to natural hydrocarbon seepage and past anthropogenic spills. The marine geology of the SBC is characterized by a relatively shallow and abundant hydrocarbon reserve beneath faulted anticlines that run parallel to the shore. Natural seepage occurs when pressure in the reserve exceeds hydrostatic, and gaseous bubbles coated in liquid petroleum seep through the sea floor and enter the marine environment. Because gaseous hydrocarbons and oil are both buoyant in seawater, the seepage manifests as oil slicks at the surface of the ocean. Oil has historically been extracted from the reserve by human drilling, potentially alleviating pressure in the reserve, at sites such as Platform Holly, which operated in the SBC from 1966 until production ceased in 2015. Platform Holly is located roughly 3.2 kilometers from the shore and is the only offshore oil platform in California State waters. Since decommissioning, the only mechanism releasing oil in this region of the hydrocarbon reserves is natural seepage. In this study, machine learning via a random forest model is utilized to identify and classify oil slick regions in Sentinel-2 optical images encompassing the decommissioned oil platform Holly and other nearshore waters near Santa Barbara, CA. The random forest model was developed to predict 3 classes, or targets: clear, turbid, and oil-contaminated waters. Sentinel-2 supports a 5-day revisit time, which mitigates cloud obstruction in the region, and 10-meter spatial resolution appropriate for distinguishing small-scale surface features such as slicks. 6 images were manually classified for training, and classification using the random forest supported an additional 27 classified images. A time analysis was conducted using the combined 33 images, which spanned 2019 to present to assess variability in hydrocarbon seepage starting 4 years after decommissioning to present. Preliminary results do not indicate a trend in the area of the natural oil slick from 2019 to 2025. We conducted sensitivity testing by assessing covariance between oil slick area with wind and tidal measurements and found no significant correlation to winds or tides. More frequent imagery spanning a wider temporal range could help to better determine whether oil slick area is changing or stable through time.