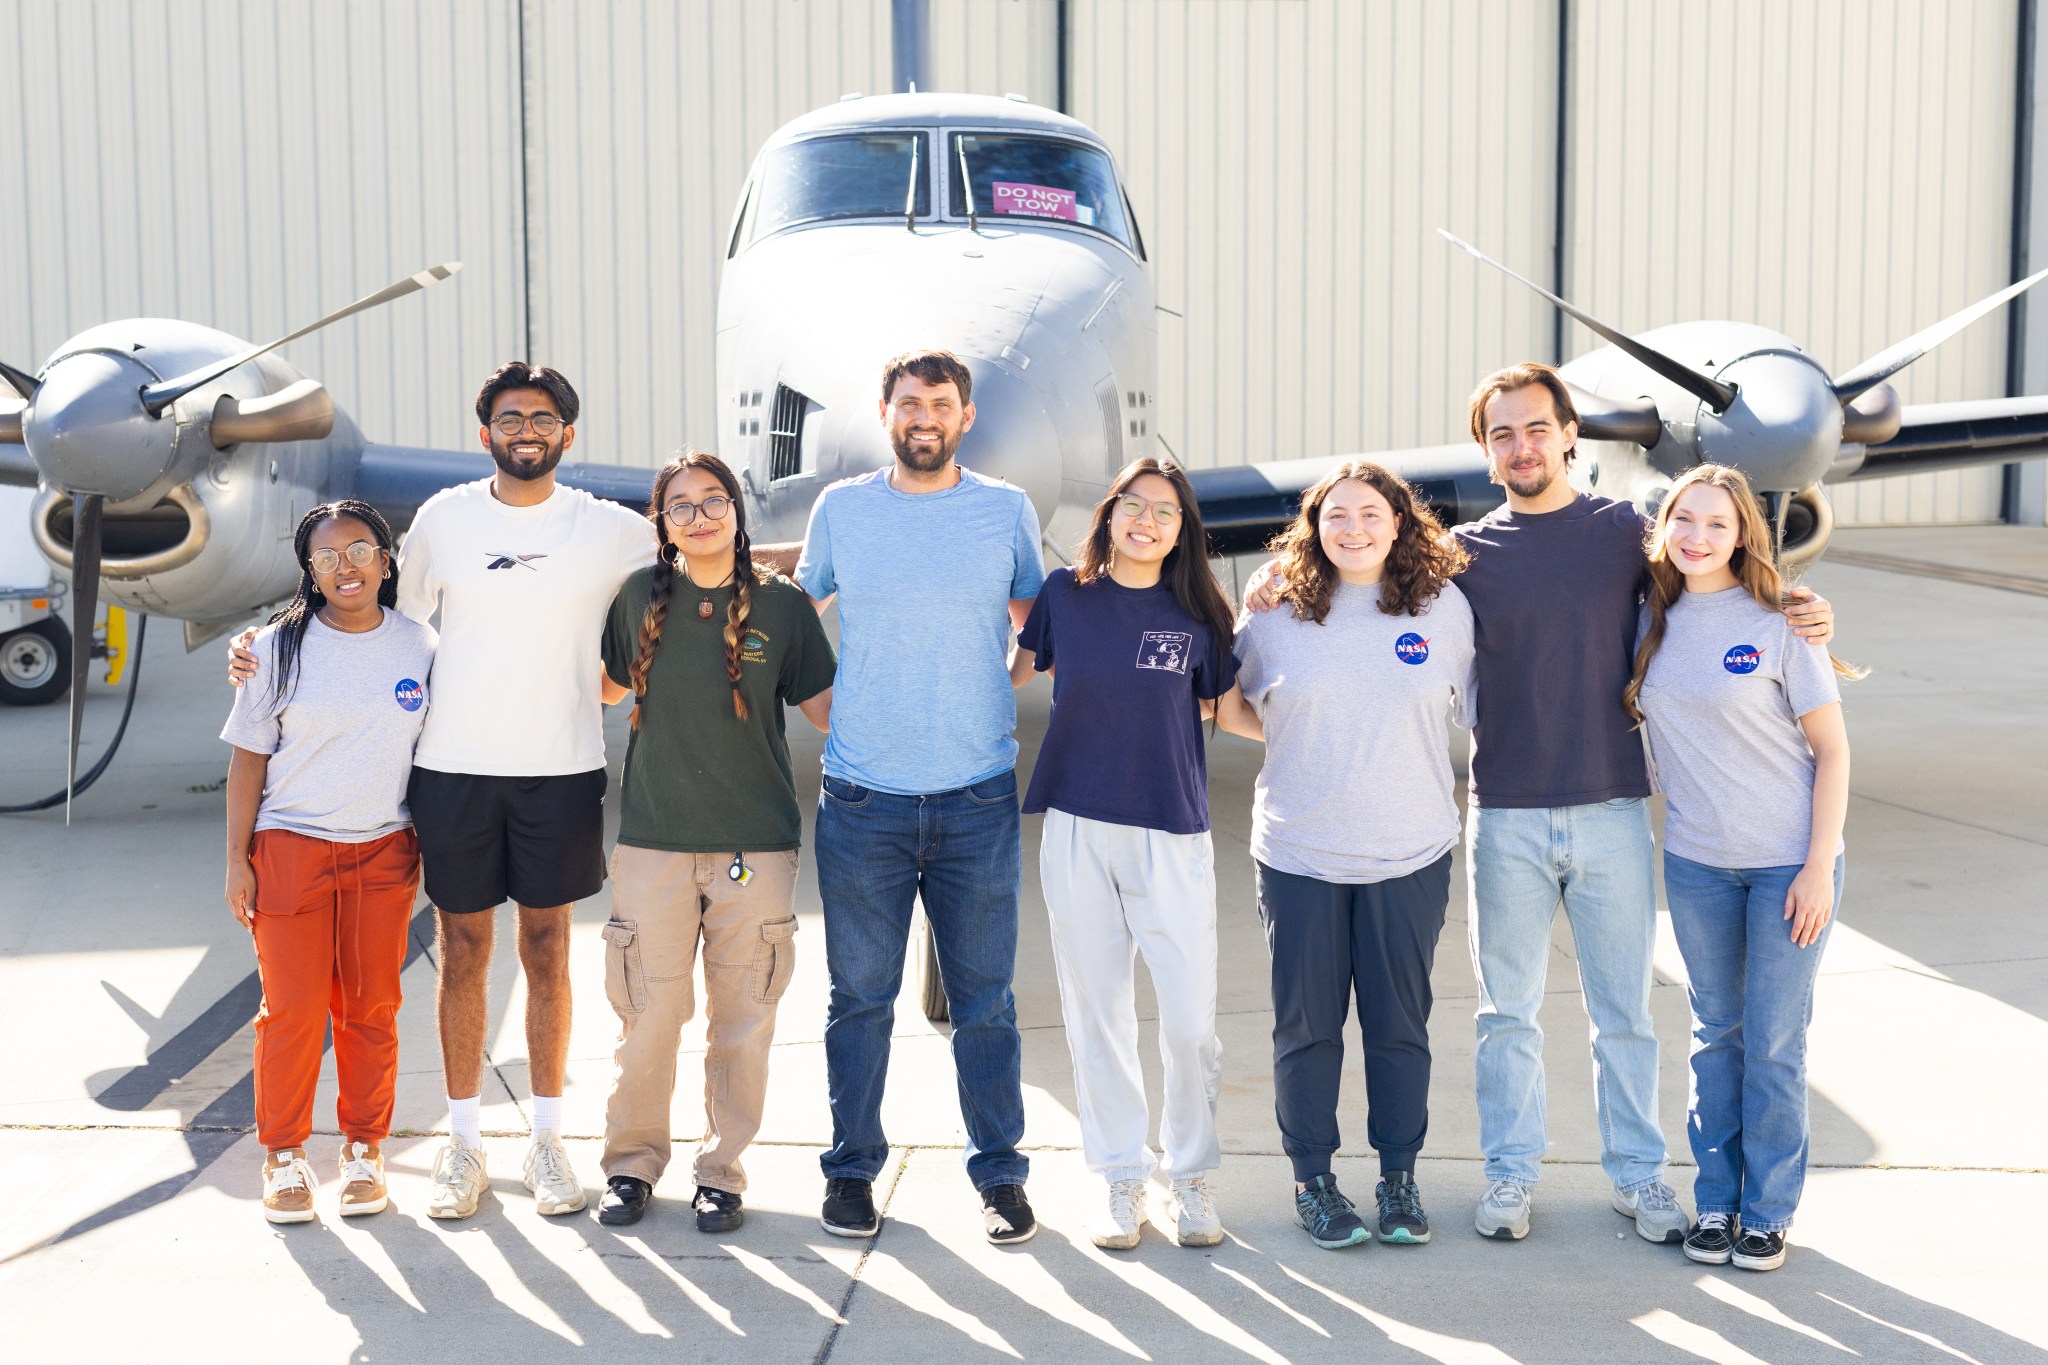
Faculty Advisors:
Daniel Sousa, San Diego State University
Graduate Mentor:
Megan Ward-Baranyay, San Diego State University
Land Group Introduction
Faculty Advisor Daniel Sousa
Robert Purvis
Fractional cover estimates of the epiphytic macrolichen Ramalina menziesii in oak canopies from simulated mixed spectra and airborne imaging spectroscopy
Robert Purvis, Western Kentucky University
Lichens, a symbiotic relationship between a fungus (mycobiont) and green algae or cyanobacterium (photobiont), occur globally with great variability in form and function. On the North American west coast, Ramalina menziesii is a robust lichen with net-like morphology found across three distinct biomes. In the mediterranean climate of coastal California, R. menziesii can survive with thallus water content as low as 13%, making the lichen a powerful medium for wildfire spread. As a late-successional community member, changes in wildfire incidence observed in the region have caused R. menziesii coverage to decline. Despite their importance, there is little research on the detection of lichen with imaging spectroscopy, which would provide a potentially novel piece of information to wildland firefighters. The lichen primarily grows on oaks of the region, with the percentage of top-cover ranging from near zero to tree canopy overgrowth due to the lichens’ pendulous growth form. These characteristics may make R. menziesii a good candidate for airborne imaging spectroscopy. Reflectance spectra were collected with a field spectrometer and contact probe from the Figueroa creek area of Sedgwick Reserve in Santa Barbara County, California. From this collection, a spectral library was built (n=70) to contain three endmember types: Quercus lobata (California Valley Oak) leaf (GV; n=34), Q. lobata bark (NPV; n=8), and R. menziesii, (lichen; n=28). This library was sampled using a stratification method and was split into a simulation library (n=41) and an unmixing library (n=29). Mixed spectroscopic pixels at 5% increments of lichen coverage were simulated (n=1344) with random fractions of GV and NPV coverage. Multiple endmember spectral mixture analysis (MESMA) on the simulated pixels recovered the known lichen fractions at an RMSE of 0.25 and R2 of 0.38, with some overestimation of lichen coverage at high GV fractions. Future work will include evaluating the performance of the model with Airborne Visible and Infrared Imaging Spectroscopy (AVIRIS) imagery over Sedgwick Reserve.
Kyra Shimbo
Investigating the Influence of Pre-Fire Fuels and Topography on Burn Severity Prediction in the 2024 Lake Fire in Santa Barbara County, California
Kyra Shimbo, University of Rochester
Wildfires can pose significant threats to air and water quality, vegetation, soil health, and public safety. The growing severity, frequency, and intensity of wildfires underscore the need to mitigate their impacts on ecosystems and communities. In California, a total of 8,110 wildfires occurred in 2024—burning over 1 million acres of land and destroying more than 1,800 structures. Prospective modeling of potential burn severity in fire-prone areas can help inform decisions on effectively implementing fire management strategies to reduce wildfire hazards. Previous studies have demonstrated that various combinations of pre-fire environmental characteristics, such as fuels and topography, can explain burn severity patterns. However, identifying the dominant drivers of burn severity and accurately predicting it remains challenging across different landscapes. To gain a stronger understanding of burn severity dynamics, we evaluated the influence of pre-fire fuels and topography on predicting post-fire char fractional cover—a proxy for burn severity—for the 2024 Lake Fire in Santa Barbara County, California. We used a random forest regression model to predict post-fire char fractional cover based on pre-fire measurements of fuel structure, fuel moisture, fuel condition, fuel water stress, and topography. Fuel structure was measured with the Land, Vegetation, and Ice Sensor (LVIS), a full-waveform LiDAR. Fuel moisture, fuel condition, and char fractional cover were derived from surface reflectance collected by the Earth Surface Mineral Dust Source Investigation (EMIT). Variables related to fuel water stress were estimated from the ECOsystem Spaceborne Thermal Radiometer Experiment on Space Station (ECOSTRESS). Topographic variables were acquired from the Shuttle Radar Topography Mission (SRTM). Preliminary results indicate that the model explains 28% of the variance in post-fire burn severity for the Lake Fire (R-squared = 0.28), with canopy height, green vegetation fractional cover, and aspect ranking the highest in predictor importance. Future work could focus on model improvement by incorporating additional pre-fire and active fire weather variables into the model. Overall, this model can be applied to monitoring fuel parameters associated with high burn severity that jeopardize ecosystems and water resources.
Nimay Mahajan
Evaluating Spectral Mixture Analysis (SMA) Derived Vegetation Fraction for Improved ET Estimates in the Semi-Arid Ecosystems of the Sierra Foothills
Nimay Mahajan, University of Miami
Evapotranspiration (ET) plays a critical role in water and energy cycles, particularly in semi-arid ecosystems. For decades, ET models have used spectral indices like the Normalized Difference Vegetation Index (NDVI) to quantify the abundance of green vegetation. However, NDVI has long-recognized limitations in semi-arid environments, including saturation for densely vegetated pixels and sensitivity to soil reflectance in sparsely vegetated areas. We explore the potential for vegetation fraction (VF) derived from spectral mixture analysis (SMA) of imaging spectroscopy data to provide a more accurate alternative to NDVI for modeling ET. Focusing on a region east of Fresno, California, we leverage data from National Ecological Observatory Network (NEON) flux towers (SJER and SOAP) which provide ground-based measurements of Latent Heat Flux (LE). We derive VF from surface reflectance collected by the Earth Surface Mineral Dust Source Investigation (EMIT) and compare it to the Landsat-based NDVI product currently used by NASA’s Priestley-Taylor Jet Propulsion Laboratory (PT-JPL) model. Land Surface Temperature (LST) from the ECOsystem Spaceborne Thermal Radiometer Experiment on Space Station (ECOSTRESS) is incorporated as the thermal data source for each PT-JPL model run. Both model configurations use the same six environmental variable inputs, differing only in their representation of fractional vegetation cover. Preliminary findings suggest that SMA-derived VF tends to produce more conservative LE estimates than NDVI, especially in areas with sparse or mixed vegetation cover. These VF-based estimates also appear to better align with flux tower observations, indicating that NDVI may be overestimating ET in this region. While both vegetation metrics show broad agreement in spatial structure (r = 0.73), localized LE differences highlight the importance of subpixel vegetation characterization in ET modeling. As orbital imaging spectrometers become more widely deployed, it is clear that improving remote sensing-based ET modeling can help support water monitoring, drought-resilient agriculture, and wildfire hazard assessments.
Patricia Sibulo
Comparative Analysis of UAVSAR Derived Flooding Extent During Hurricane Florence (2018) to Urban Flood Hazard Models
Patricia Sibulo, University of San Francisco
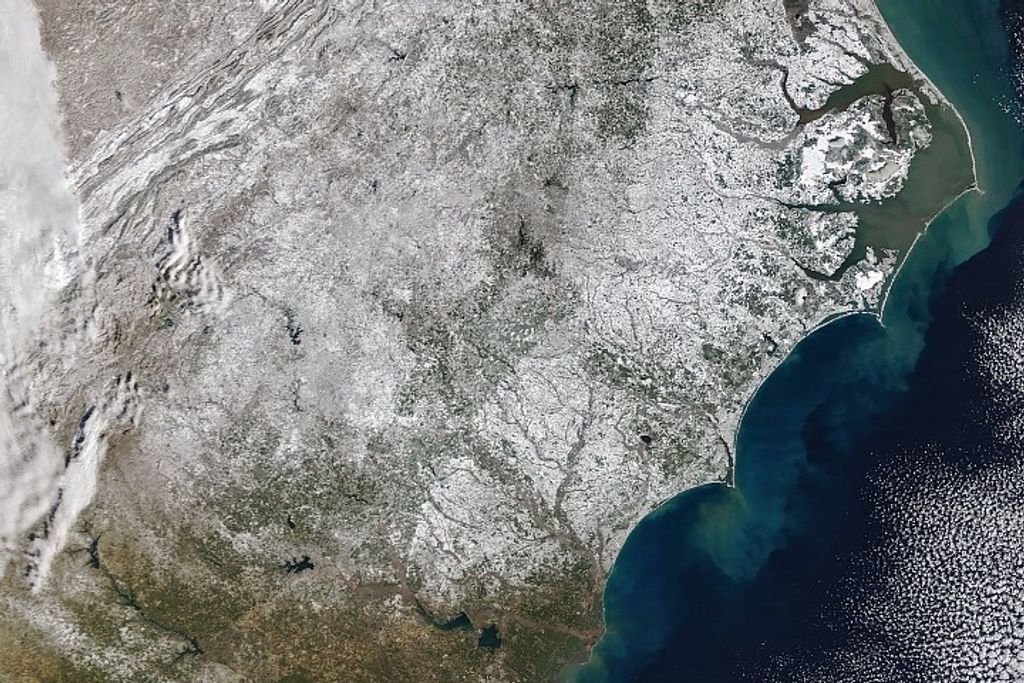
Urban flooding poses major risks to public safety, infrastructure, and city planning. Yet, floods remain difficult to detect, especially during storms, when high precipitation is often accompanied by spatially and temporally persistent cloud cover. Synthetic aperture radar (SAR) sensors, such as airborne Uninhabited Aerial Vehicle Synthetic Aperture Radar (UAVSAR), emit microwave pulses that can image regardless of cloud cover or time of day and respond sensitively to surface water. This is due to both the high dielectric constant and the flat geometry of standing water. Given sufficient resources, airborne SAR is capable of capturing rapidly evolving flood events that unfold on hourly timescales. We investigated how daily airborne SAR can be applied to improve flood hazard mapping and monitoring in urban areas. This study incorporates airborne quad-polarized L-band UAVSAR data acquired for five days during the 2018 Hurricane Florence in North Carolina and flood hazard models developed by the state. From daily inundation extent maps, we computed the total area flooded in the Northeast Cape Fear River Basin spanning the area between the cities of Wilmington and Goldsboro. Spatial overlap between the total flooded area estimated by UAVSAR and the region’s projected flood hazard zones was quantified. A LiDAR-derived digital terrain model (DTM) with a spatial resolution of 3ft was also used to identify low-lying areas prone to pooling. Preliminary findings suggest that roughly 66% of the SAR-detected flood did not appear within the state’s modeled 100-year flood hazard zone. Future work could compare UAVSAR estimates of total flooded area to estimates derived from lower temporal resolution (6-12 days) spaceborne SAR to improve flood mapping globally. These results support the integration of high-temporal-resolution airborne SAR and satellite SAR in urban flood workflows for hazard assessment and active flood monitoring. The recently launched NASA-ISRO SAR (NISAR) mission, with global coverage up to twice every 12 days, is expected to enhance this fusion approach by providing more frequent spaceborne observations. Integrating SAR and LiDAR may enable more accurate, timely assessments in response to flood disasters.
Charlotte Perry
Investigating Spaceborne Detection Limits of Geothermally Active Mud Features, Land Surface Temperature, and Surface Mineralogy in the Salton Sea Geothermal Field
Charlotte Perry, Stonehill College
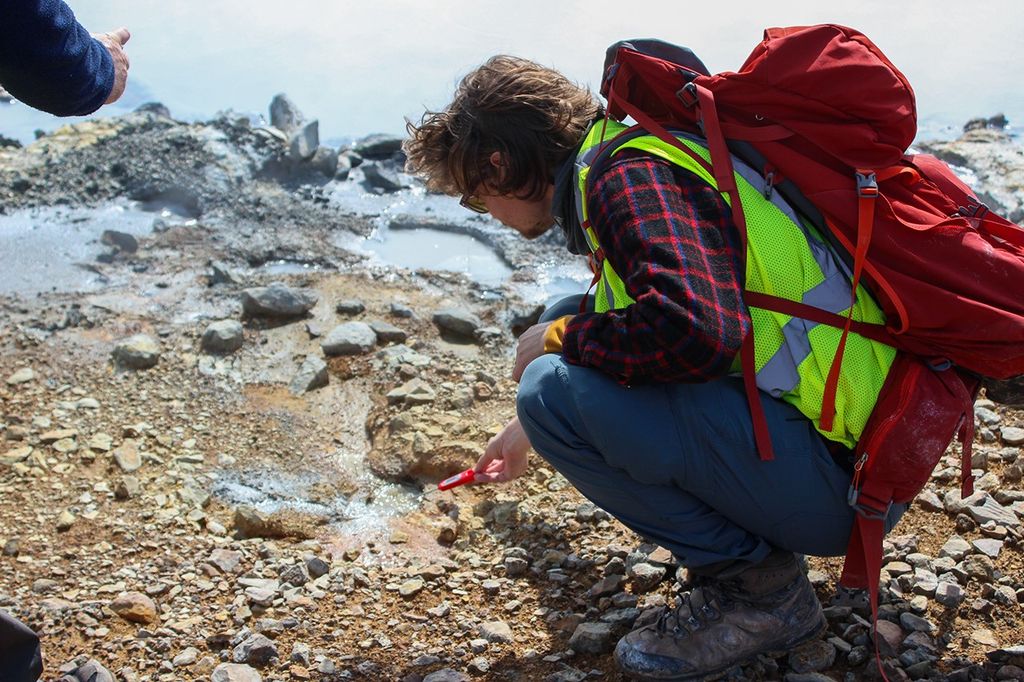
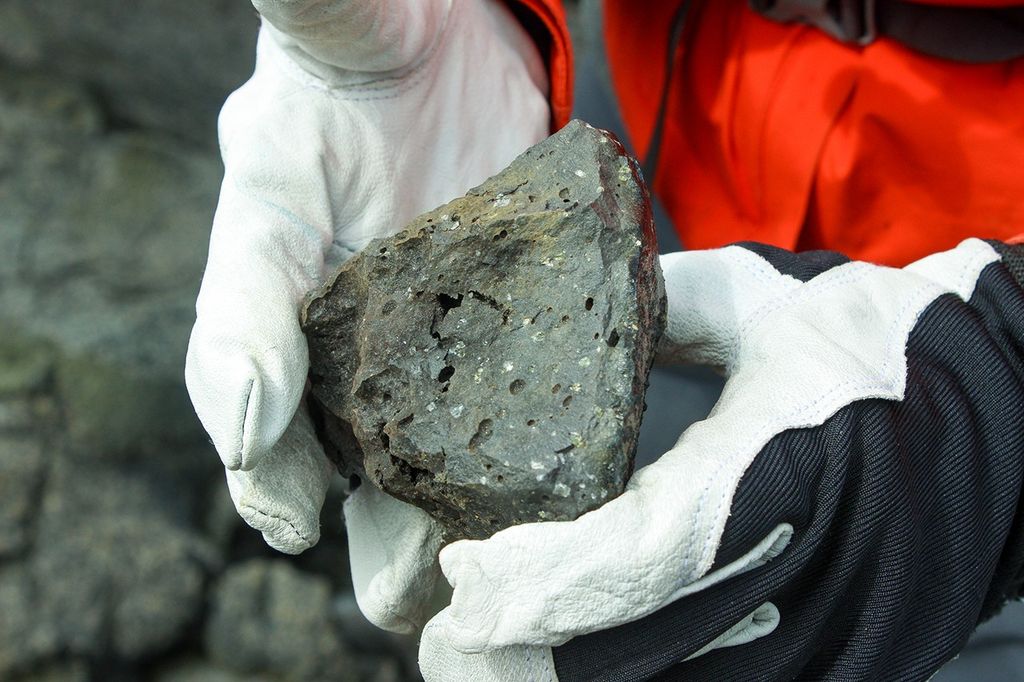
Geothermally active mud features, such as mud pots and mud volcanoes, are manifestations of subsurface geothermal activity. Geothermal activity also provides energy resources. In California’s Salton Trough, geothermal power plants produce roughly 340 Megawatts of electric power annually. Detecting and monitoring geothermal surface features is thus valuable, as these features can be key indicators of geothermal resource potential. Here, we investigated the ability of spaceborne multispectral thermal imaging and imaging spectroscopy to detect and monitor these small-scale (sub-decameter) geothermal mud features near the southeastern edge of the Salton Sea. For this investigation, LST data were obtained from the ECOsystem Spaceborne Thermal Radiometer Experiment on Space Station (ECOSTRESS) and surface mineralogy estimates were provided by the Earth Surface Mineral Dust Source Investigation (EMIT) L2B Estimated Mineral Identification and Band Depth product. To examine temporal variability, we processed four images per sensor acquired over two seasons from two consecutive years, May and August for 2023 and 2024. We conducted t-tests to determine if consistent differences in mineralogy and/or LST were observable between known mud pots and control areas. Preliminary results did not find a statistically significant relationship (p > 0.05) between the presence of small-scale geothermal mud features, spaceborne-acquired surface mineralogy, and LST. This study has identified key spatial resolution limitations to locating and monitoring small geothermal mud features. Future work is suggested to determine the threshold for spatial resolution relative to the size of geothermal features of interest. Effectively locating and monitoring geothermally active areas has implications for improving energy security, quantifying the abundance of critical minerals, investigating the effect of their emissions, and understanding the potential geologic hazards they pose.
Brianna Francis
AVIRIS, Altadena, and Asphalt: Assessing the capabilities of airborne imaging spectroscopy in classifying asphalt road condition
Brianna Francis, University of Georgia
Ninety-four percent of paved roads in the United States are surfaced with asphalt. Fire accelerates the aging process of asphalt and causes roads to degrade prematurely. This causes moisture pooling, accelerated pothole formation, and produces hazardous conditions for all motorists. Asphalt can have distinct spectral features depending on its condition. Undamaged asphalt typically has an albedo of 0.05 to 0.10 and is characterized by a notable decrease in reflectance near 1700 nm and 2300 nm due to absorption by the hydrocarbon-based asphalt sealant applied to the top of roads during its initial paving. As road surfaces are subjected to physical and chemical weathering, the hydrocarbon-based sealant is eroded away, revealing the mineral-filled aggregate below. Because of this process, the spectra of weathered asphalt is characterized by a reduction in complex hydrocarbon absorption, an increase in albedo, and an increase in mineral absorptions, especially that of iron oxide near 490 nm. Previous research has applied in situ imaging spectroscopy to identify these absorption features in asphalt roads and correlated them with pavement condition. We evaluated the capabilities of airborne imaging spectroscopy in detecting asphalt damage in Altadena, California after the January 2025 Eaton Fire to assess the accuracy of this method for mapping road damage for repair prioritization. AVIRIS-3 (Airborne Visible Infrared Spectrometer 3) surface reflectance data was collected post-fire over Altadena on January 16, 2025, at a spatial resolution of 1.8m. We compared two spectral methods for road damage classification, the VIS2 band difference and Spectral Angle Mapper (SAM). Results show that road conditions can be classified with an accuracy of 76% for SAM and 85% for VIS2 with a 10% margin of error based on 100 validation samples; however, these methods notably exhibited limited effectiveness in mountainous areas and sensitivity to crack sealing. These findings can contribute to near immediate post–fire recovery efforts by supporting detour planning, repair prioritization, and a smoother restoration process.

