


Faculty Advisor:
Stacey Hughes, University of New Hampshire
Graduate Mentor:
Katherine Paredero, Georgia Institute of Technology
Atmospheric Chemistry Group Introduction
Faculty Advisor Stacey Hughes and Graduate Mentor Katherine Paredero
Kaylena Pham
Spooky Swamps: How Methane Emission Rates and Their Spatial Variability Differ Between the Great Dismal Swamp and the Alligator River
Kaylena Pham, University of Southern California
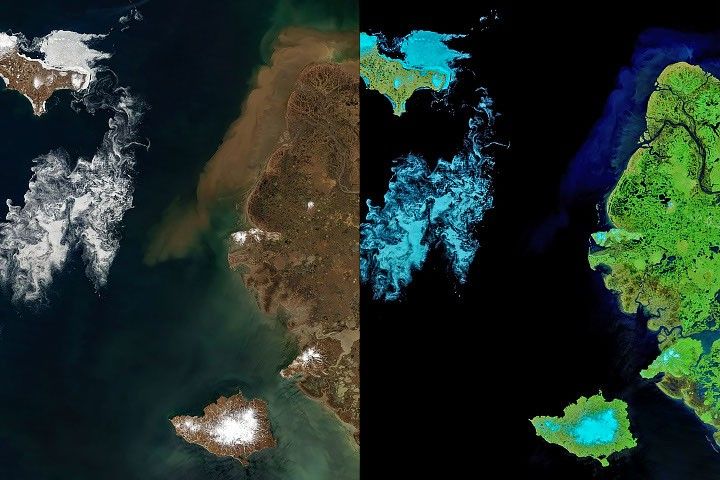
Wetlands represent a dominant natural source of methane emissions to the atmosphere through methanogenesis, a process that produces methane in nutrient-depleted anoxic sediments, or as a result of decomposition. In coastal wetlands, particularly brackish regimes such as the Alligator River, severe storms and rising sea levels intensify saltwater intrusion inland. This leads to expansive vegetation death and the formation of ghost forests, large areas of dead standing vegetation. The widespread forest loss caused by salinization suggests elevated methane emissions in areas with vegetation stress through increased rates of decomposition from plant death. Previous research has not yet considered ghost forests when estimating methane emissions in wetlands, leading us to explore emission concentrations across two wetlands with similar vegetation compositions: the Great Dismal Swamp and Alligator River.
In this work, we utilized in-situ measurements collected aboard the Dynamic Aviation B-200 aircraft during the NASA Student Airborne Research Program (SARP) 2025 flight campaign. Methane and carbon monoxide measurements were determined using a PICARRO Gas Concentration Analyzer. This data was then linked with Normalized Difference Vegetation Index (NDVI) imagery from the Terra satellite’s Moderate Resolution Imaging Spectroradiometer (MODIS) instrument. With these two datasets, we studied how vegetation stress influences methane emissions. We observed greater vegetation stress in the Alligator River compared to the Great Dismal Swamp. Furthermore, the Alligator River has wider methane concentration variability occurring over areas with greater vegetation stress. In contrast, methane measurements over the Great Dismal Swamp have narrower distributions and less vegetation stress. This comparison of wetlands in differing vegetative states suggests a potential link between ecosystem stress and elevated methane emissions in wetland environments. Interestingly, despite these differences, the Great Dismal Swamp had a slightly higher mean methane concentration (2.11 ppm) compared to the Alligator River (1.96 ppm). Our results emphasize the importance of improving our understanding of what types of vegetation conditions lead to methane enhancements over wetland regimes.
Carson Turner
Calculating Methane Flux Over the Great Dismal Swamp Using the Mass Balance Technique
Carson Turner, University of North Dakota
Methane is one of the most potent greenhouse gases in the atmosphere, with a warming potential approximately 28 times larger than carbon monoxide. When examining the Global Methane Budget, wetlands are the largest natural source of methane accounting for 20-40% of global methane emissions. Wetland methane emissions have been shown to present the highest uncertainty due to both a lack of in-situ measurements to compare with models as well as a lack of understanding of how different conditions, like soil moisture and air temperature, affect methane emissions. This study looks specifically at The Great Dismal Swamp (GDS), located on the border of southeast Virginia and northeast North Carolina, to study emissions over the region using data collected on flights conducted as part of the Student Airborne Research Program (SARP) in the summer of 2025. A PICARRO Gas Concentration Analyzer was used to collect high frequency methane and carbon monoxide measurements. The two research flights followed similar flight paths around the GDS, on the 23rd and 24th of June. Methane flux was then calculated using the mass balance approach for each flight. Methane flux values were measured at 0.037 kg/s and 0.603 kg/s for the 23rd and 24th respectively. A similar study on wetlands in northern Sweden and Finland found an average methane flux value of 5.56 kg/s. A decreased methane flux value was observed on the flight day associated with higher temperatures, which is contrary to previous research on the relationship between methane emissions and temperature. Future work includes utilizing these flux measurements to improve our understanding of methane emissions from wetlands in models and further explore the relationship between methane emissions and soil moisture.
Alek Libby
Comparative Analysis of Urban Ozone Chemistry in Baltimore, Richmond, and Norfolk
Alek Libby , Florida State University
Urban ozone pollution remains a significant air quality concern in many U.S. cities. Ground-level ozone is not directly emitted but forms through photochemical reactions involving volatile organic compounds (VOCs) and nitrogen oxides (NOₓ) in the presence of sunlight—especially during the summer when incoming solar radiation is enhanced. The National Ambient Air Quality Standard set by the EPA for tropospheric ozone is 70 ppb, which is measured as an 8-hour average. Though exceedances of said standard have declined nationwide, understanding how emission composition varies across metropolitan areas remains critical. This study investigates the VOC makeup and ozone formation dynamics of three Mid-Atlantic urban environments: Baltimore, Richmond, and Norfolk. In-situ Whole Air Samples (WAS) were collected onboard the Aviation Dynamics B200 aircraft during the 2024 NASA Student Airborne Research Program (SARP) Campaign. Gas chromatography was used to quantify the VOC composition of each sample. Additional airborne data from CAFE and CANOE instruments provided measurements of formaldehyde (HCHO) and nitrogen dioxide (NO₂), respectively. This study looked at measurements collected below the boundary layer and within urban beltways to assess regional ozone production potential. Results showed that Baltimore exhibited significantly lower levels of key anthropogenic VOCs, particularly n-butane, i-pentane, and n-pentane. VOC/NOₓ ratios placed Richmond and Norfolk in NOₓ-limited regimes, while Baltimore fell within the transitional zone—supported by HCHO/NO₂ ratios averaging at 2.44 in Baltimore versus 5.14 and 5.09 in Norfolk and Richmond. Baltimore continues to experience notably more ozone exceedance days than Norfolk and Richmond, which is likely related to elevated NO₂ levels in the area. While reducing VOCs may help, these findings suggest that NOₓ reductions are likely more effective for mitigating ozone in the Baltimore area. Future work might replicate this analysis using the 2025 SARP dataset, which was collected on hot, stagnant days that are favorable for ozone production.
Hannah Suh
Characterization of Volatile Organic Compound (VOC) Sources in the Baltimore area
Hannah Suh, University of California, Santa Cruz
Volatile organic compounds (VOCs) play a key role in tropospheric photochemistry, as they react with nitrogen oxides (NOx) in sunlight to produce tropospheric ozone (O3). Both VOCs and tropospheric O3 can have negative impacts on air quality and human health. Understanding the sources of VOCs in urban areas such as Baltimore is essential for informing future air quality policies. In this study, in-situ VOC measurements collected onboard the Aviation Dynamics B200 aircraft during the NASA Student Airborne Research Program (SARP) were analyzed to characterize potential emission sources in the Baltimore area. VOC datasets from two flights from June 24th that flew over that location were investigated. This flight data was collected using aircraft instruments on the Aviation Dynamics B200, primarily the Whole Air Sampler (WAS). WAS canisters were later processed in lab using gas chromatography, which identified the different VOC mixing ratios in the air. VOCs ratios along with Positive Matrix Factorization (PMF), which reduces an inputted data matrix to separate out potential emission source contributions, were compared to each other to consider the most notable sources of VOCs in the Baltimore area. A total of six sources were looked at through PMF for this region. The top three sources seem to align with oil and natural gas, biogenic, and vehicular emissions. Chemical signature ratios indicate the presence of mixed plumes of both industrial and urban emissions, with many significant correlations with ethyne. These results point towards oil and natural gas industries, biogenic sources, and urban sources like vehicles as primary contributors to VOC signature ratios in the Baltimore area. A logical next step for this research would be to compare VOC signature ratios across multiple years to assess temporal trends.
Aashi Parikh
Characterizing VOC Emissions from Chemical Plant Plumes in Hopewell, VA
Aashi Parikh, Boston University
Hopewell, VA is home to a cluster of major chemical facilities, whose emissions have raised concerns in neighboring communities about air pollution and health disparities. While there is information about the historical pollution in Hopewell, few studies provide a comprehensive analysis of volatile organic compounds (VOCs). This study investigates the distribution of VOCs in Hopewell’s industrial corridor and
In-situ whole air samples (WAS) were collected aboard the Aviation Dynamics B200 during the NASA Student Airborne Research Program in June 2024. In this study, samples collected at Hopewell were compared to the rest of the flight. The values were separated by chemical families, and enhancements were identified. The analysis showed that Hopewell had significant levels of aromatics, with 60 ppt of benzene, 119 ppt of toluene, and 47 ppt of styrene, which are VOCs linked to respiratory illness, neurological disorders, reproductive issues, and cancer. Aromatics observed over Hopewell were approximately 5x higher than that of the remaining flight path. According to the EPA, these carcinogenic compounds have no safe threshold for chronic exposure. As such, long-term exposure to these compounds can pose health risks. These findings reinforce existing health outcome disparities in the region, such as elevated cancer rates, and raise concerns about the exposure of nearby communities. Underserved communities are disproportionately being impacted by such health risks in Hopewell. Future research will evaluate VOC concentrations over Hopewell in 2025 and compare them to the 2024 baseline established in this study, providing insight into whether emissions reductions have occurred and if regulatory or community-driven interventions are showing impact.