From Earth orbit to the Moon and Mars, explore the world of human spaceflight with NASA each week on the official podcast of the Johnson Space Center in Houston, Texas. Listen to in-depth conversations with the astronauts, scientists and engineers who make it possible.
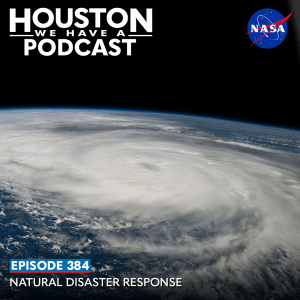
On episode 384, a NASA scientist discusses how imagery and data collected from the International Space Station can support natural disaster response teams on the ground. This episode was recorded February 28, 2025.
Transcript
Dane Turner
Houston, we have a podcast. Welcome to the official podcast of the NASA Johnson Space Center, episode 384, Natural Disaster Response. I’m Dane Turner, and I’ll be your host today. On this podcast, we bring in the experts, scientists, engineers and astronauts, all to let you know what’s going on in the world of human space flight and more. The view from low Earth orbit can be an advantageous one for the International Space Station, orbiting 250 miles above the surface of the Earth. It means that can serve as our eye in the sky, observing our planet below, equipped with cameras and sensors, it regularly collects imagery and data on geology, temperature, weather and other natural factors.
Here on the planet, we’ve recently been faced with some major weather events. Last fall, hurricanes Helene and Milton packed a one two punch on the Gulf Coast of Florida, with Helene continuing all the way into North Carolina, and early this year, the West Coast of the US has been dealing with a series of devastating wildfires. The International Space Station’s trajectory passes above approximately 90% of Earth’s populated area, and is able to observe many of these phenomena. With access to so much aerial data, how is NASA able to help, in the face of these kinds of events, to tell us about how NASA responds to natural disasters, we have senior Earth system scientist Will Stefanov, who is one of the JSC Center Response Coordinators for the NASA Disasters Program, Disaster Response Coordination System or DRCS.
Let’s get started.
<Intro Music>
Dane Turner
Will, thank you so much for coming on, Houston We Have a Podcast today.
Will Stefanov
It’s my pleasure, glad to be here.
Dane Turner
Can you tell us a little bit about yourself? Where are you from? Where’d you go to school? What’d you study?
Will Stefanov
Well, I’m originally from Massachusetts, so I’m a Yankee living in Texas. My I originally studied it at the UMass Lowell campus, and I’m a geologist, and pretty much all of my degrees have been in environmental science and or geology. I did a master’s and a PhD at Arizona State University. So that’s a sort of a paradise for a geologist, because you can just see all the rocks out there with, you know, no no vegetation or anything on top of them, or very little. And so then, after that, moved here to Houston to take a job at JSC, working with the crew Earth Observations experiments, and I came in as a contractor. I was contracted for 10 years and then became a civil servant, and that coincided with a change in the ISS International Space Station being used as a remote sensing platform for a number of different instruments. The crew with observations payload or experiment is hand held crew imagery, handheld camera crew imagery, taken out of the ISS windows, and that, for the longest for a very long time, that was the only real remote sensing instrument or activity on the ISS then right around 2014, or so, we started Getting more sensors. Science Mission Directorate funded sensors on board the space station. And at that time, the program decided, well, we want to have someone who is a remote sensing expert, which is kind of one of the focuses of my particular research, my particular expertise, to help guide the current Earth Observations team and also expand what they did into a broader portfolio of it, of remote sensing from the International Space Station. So that’s I took leadership of that group and did that up until about 2019, or so, and then I decided to take a detour into management for a while, and became the branch chief for our exploration science office. And that is a role that I just recently stepped away from to become the senior Earth system scientist within the exploration science office, and in that role now, I still continue to support the ISS program. I serve them as their program, scientists for Earth observations, and that that role hasn’t changed. But now I also work with our NASA Disasters Program as one of the Johnson Space Center response coordinators. And sure, we’ll talk about that a little bit later. And that’s, yeah, that’s pretty much where I am these days.
Dane Turner
Fantastic. So you said the ISS as a science platform. It it does a lot of Earth observations. And you said that, you know, we started with just crew observations looking down, but now we’ve got other sensors up there. Can you tell us, like, what some of those sensors are and the things they track?
Will Stefanov
Sure So right now we have a number of sensors, external sensors. There are mounted on the outside of the space station that are looking at various earth system processes. We have the Eco stress sensor, that is a a thermal infrared sensor that is looking at evapotranspiration in plants. Essentially, it’s looking at at heat stress from plants, seeing how they react. There’s also the the Jedi sensor, which is a lidar instrument. So it’s collecting three dimensional information on surface biomass. Essentially, it’s mapping the canopy vegetation canopy across the surface of the earth. We also have the sage three instrument, this is an aerosol sounding instrument that looks at things like ozone in the atmosphere. And then we also have The Orbiting Carbon Observatory, which is looking at carbon dynamics, so looking at CO2 in the atmosphere, looking how that’s exchanged between the ground and the and the atmosphere, and just seeing how those dynamics work in terms of the whole broader earth system.
Dane Turner
Wow. You guys are tracking a whole bunch of stuff from from orbit up there
Will Stefanov
We are and one of the most recent ones is the emit instrument. And their science objective is to characterize dust surfaces, dust generation areas on the surface of the earth, and characterize what the mineralogy of that dust is that information feeds directly into determining what kind of aerosols we have in the atmosphere, particular whether we have more dark aerosols in the atmosphere or light aerosols in the atmosphere, and that helps us understand how heat energy balance works across the planet.
Dane Turner
What kind of things are aerosols?
Will Stefanov
Aerosols are things like, when you have a large fire, you sometimes, you will, you’ll see the visible soot. There’s also much smaller particles that are produced as part of combustion. Also things like very, very small minerals. When you see a dust storm, all that dust, those are all aerosols. You also have aerosols that come off of the ocean surface salt particles that come off. So all of these are aerosols, and they all have impacts on how energy is balanced across the planet.
Dane Turner
Fascinating. So we’ve got all these instruments up there on the space station, and on earth we have weather phenomena, and you’re tracking lots of different types of these things. I know we watch the hurricanes. We get a lot of footage of those. And I know that we we recently saw some imagery of the wildfires from from space. Can you tell us a little bit more about, like, what type of weather phenomena you’re looking at from the space station using these instruments?
Will Stefanov
It’s pretty much, as you just brought up, for what we do. We do a lot of general monitoring. Many of these sensors are collecting data on a regular basis over specific areas of the earth to help their science in the event of a large disaster event, say, like a hurricane or a wildfire, then we engage in two ways. From the ISS, for many years, since 2012 we’ve been tracking international disaster charter events. This is a International Group, an agreement between the space agencies of the Earth, like NASA or JAXA. And the idea there is, if something happens and a country requests aid, they request information, then those agencies can provide that data as it’s available. So the ISS became part of this program in 2012 and primarily it’s been the handheld crew imagery is what we collect for that. So it’s when we have a big hurricane or a wildfire or earthquakes, then we get a request, and then we activate the CEO team, the Crew Earth Observations team, to see whether the crew could image it. More recently, we’ve become part of the NASA Disasters Program, and in particular it’s we’re calling it the disaster response coordination system. This is a interconnected system between various centers who have expertise in remote sensing. They can look at data that NASA collects and some of our other partners, like ESA and we can develop products from that data that is responsive to requests from people dealing with disasters on the ground, and those people are governmental agencies. They don’t necessarily have to be federal governmental agencies. They can be state or even local or non governmental organizations like the Red Cross, we can respond to requests to those. If we get a request, something has happened, and someone reaches out to us, let’s say FEMA, for example. First, we assess the request to see if it’s something that we can respond to if someone’s asking for. A very specific kind of data. Do we have the expertise to enable us to produce that data or that data product? If we decide we do, then we set up a response team that is composed of various members from different centers, and then we reach out to our subject matter expert networks that exist at the different centers and ask them, Can we produce a a burn map, fire severity map, a map of disturbed buildings, for instance, or a flooding map? And we engage our SMEs to do that once we once we have that data, we then make it available on our data portal for the requester to download, but it’s also available to pretty much anyone who’s involved in the disaster response. We also coordinate very tightly with the groups responding on the ground, and typically that tends to be FEMA is one of our major response partners, and if it’s a for some very large events, like major hurricanes, we can actually staff someone in their in their coordination center that they set up to deal with that. So there’s direct communication. The whole purpose behind the DRCS is to increase coordination and increase communication and increase what NASA can do to help out for people responding to these events. And so it’s, it’s a very we’ve developed this very tight system to track our involvement, make sure everyone’s talking to everyone else, and that’s one of my primary roles in that system. In my current position is that I’m the Disaster Response Coordinator for for Region six, which is we use the same thing as FEMA regions that includes New Mexico, Texas, Oklahoma, Arkansas and Louisiana. And so my job is to create those networks among the various emergency management response entities within that region. So for instance, I’ve been spending a lot of time talking with FEMA Region six representatives on their geographic information systems teams or their their emergency response teams, letting them know what NASA can do for them, essentially, and setting up those coordination networks. So once we get our requests, we develop our data, we provide it to whoever requested it. We then continue that as long as we need to, and we do, and we assess whether we continue to need to, whether we’ve satisfied the request, whether we need to have some follow up with our partners. Once we’re all happy that, okay, NASA has done what we what we can do. They don’t really need anything else from us, we then decide to deactivate our network. And once we do that, then we have an after action report. We go over lessons learned, we solicit any feedback from our partners. Were the data products that we produce useful? Was our process useful? How can we improve it? And then we we record that the data will be available. The data remains available on our data portal, if someone wants to go back for it, say, For Later research or just wants to revisit something. And then we ready ourselves for the next the next event.
Dane Turner
When these groups are asking for data from you, what kind of data are they looking for? Is this mostly imagery, or are is there other things that that your group tracks with the Earth observations that would be useful to them.
Will Stefanov
It’s primarily imagery but, but that’s a very that’s a broad word that I’m using, because we use a lot of our data sets are optical or visible imagery, not just visible wavelengths, but other wavelengths that can be useful for looking at things like material identifications, or for looking at things like disturbance changes in a land surface from one image prior, images prior to an event to images after an event or during an event. We also use other types of sensor data, like radar data. We can get that that’s very useful for tracking things like disturbance surface. Disturbance also flooding. It can be useful for so it’s primarily orbital data sets, although we can also use airborne data sets as well. We haven’t done too much with ground based networks, although if we have access to them, we do incorporate some of that data, like from partners like the US, Geological Survey stream gage data, you know, to help in assessing flooding or areas that might be impacted by flooding. So that’s that’s the primary data sets that we use, as far as the products. Can use, some examples, like for hurricane Heline and Milton, we were looking at things like flooding, flooding extent, and assessing what areas would be susceptible to flooding. And for that, you can use a variety of different data sets, both optical and radar. We also for the recent Southern California fires. We had many requests for disturbance maps, burn severity maps, where’s the fire located. Also, where are smoke plumes going, because there are health effects associated with smoke plumes, particularly if you’re burning built up areas. You know, buildings have a lot of materials in them that when they combust, they don’t produce things that are very useful, very good to breathe. So we’re answering that we had requests for methane mapping, and that’s something that the emit sensor on the ISS has the capability to do. And so we were working with that team to see if they could develop methane maps for some of the areas around Southern California. So it’s, it’s really dependent on what the event is and what the requester needs. We so we create bespoke products like that when we can or when we’re requested to. We also maintain a series of near real time sort of standard data products on our mapping portal. These are things that in remote sensing, there’s usually a trade off between high frequency of data collection and resolution. If you want really high frequency data, typically, that tends to be lower resolution. If you want very highly detailed, high spatial resolution data that typically is something you can only collect on very specific times, like from an airborne instrument or something like that. So there’s always the trade off there. That’s part of the whole coordination network, and what we why we engage our subject matter experts so we can really we don’t want to tell requesters sure we can produce whatever you need. We need to make sure that we can, in fact, produce what they need and in a timely fashion for it to be useful in an event.
Dane Turner
So we’ve mentioned hurricanes, floods, wildfires. Are there other things that, other disasters that your team has been asked to respond to, like maybe droughts or I know we have tracked the Saharan dust clouds. Are those things that you might be responding to.
Will Stefanov
We don’t. We don’t typically respond to those within the disaster response framework that NASA has those are, those are things that are certainly tracked, sort of a from a more scientific investigation standpoint, I said for Saharan dust, where dust is coming from, is one of the things that the emit team is looking at droughts is something that we can look at in data over a long period of time. And droughts, droughts do can have drought conditions can have some effect on events that happen, like high precipitation. I mean, if the soil is dried out, depending on what its composition is, suddenly having a huge influx of precipitation can lead to things like enhanced surface runoff, gullying landslides. Is something else that we are frequently asked to create maps for particularly following large precipitation events for things like Hurricane Helene and Milton. That was a concern. We had all this precipitation, and you can get subsequent landslides after large fire events that remove vegetation from hillsides. Then, if that’s followed by heavy precipitation, like you had in California, that can also lead to landslides. So there’s there’s the event itself, you can also have follow on events, or sometimes even compound events, where you have multiple things happening at the same time. And so we try to balance all those requests and see what kind of data we can produce to help out
Dane Turner
So you we’ve been talking about the the sensors on the outside of the station, and you mentioned that, you know, we started out with just crew observations. Do the crews currently help with with this data collection by taking photo and video themselves?
Will Stefanov
They do. They do. Absolutely. In fact, I’d say the the crew, the crew, handheld imagery is still sort of the major workhorse data set that we collect for disaster response from the ISS the we have a whole internal system set up here at JSC to to prioritize data collection for for events like This. This all of the data that the crew collects using the handheld camera images or using the handle cameras, is what we call task listed. In other words, crew discretion. If something is a very major event, then we may be able to Timeline them. That’s so it shows up on their crew schedule for the day. It’s sort of like, okay, this is your we expect you to do this, rather than do it if you have time and interest. But so whenever we hear of an event that’s happened, whether it’s through the International disaster charter or the the DRCS, or some other, some other avenue, then what we do, the CEO team here, will then construct a what we call a small data nugget, and this is just information for the crew and other sensor teams that because we do send it out to the other sensors that are capable of collecting data useful for an event, depending what it is, we then this little data package is tells them what the event is, what kind of data we’re looking at. Uh, in the case of the handheld camera imagery, what’s the best lens to use? Because we’re looking for a certain spatial resolution of data. We then send that up, and then we add it to the daily target message evaluation process that the crew that CEO does. They pretty much look at the ISS orbit, see where it’s going to be, look at cloud cover conditions, basically, to determine is the crew actually going to be able to see anything, and if they can, then it sets up as a crew target, and it’s called out as a disaster response target, which puts it on the crew schedule as okay, if you’re going to take this imagery, this is the highest priority thing. As soon as they collect it, they then take it off the camera, put it on the station network so that it can be automatically downlinked to the ground. Once it’s downlinked through Marshall Space Flight Center, it then gets the JSC, goes through our building eight team, they assign numbers to it, then it comes to the CEO team, where then they we geo reference it. So handheld camera imagery, unlike a lot of other remotely sensed data, does not have inherent geolocation information. And by that, I mean each pixel in the image has a geographic coordinate attached to it. That’s how, that’s really how things like Google Earth work. And if you, if you bring out like ArcGIS, you have a base map, and you bring in an image, say, from Landsat, or one of the Sentinel satellites from ESA you can pretty much import that, and it will fall on the surface, the Earth’s surface, where it’s supposed to you know, mountains will mountain. The imagery will drape over mountains. Streets will line up, buildings will be in more or less the correct place. That’s all because of that embedded geographic information, handheld camera imagery from the ISS doesn’t have that so over the past few years, we’ve been using machine learning techniques here at JSC to add that capability after the imagery comes down to essentially do that full geo referencing, so that when you import an astronaut photograph that’s been geo referenced into a GIS system or Google Earth, it will lay on the Earth’s surface as it’s as you would expect it to, and that capability has made that data set much more useful now for for disaster response. Now we can actually take the handheld imagery and feed it into a GIS system where it can be useful by people on the ground. And that has happened in several instances that we’ve responded to. We also collect a lot of nighttime imagery, City Lights data, and from the ISS data collected by the crew is still the highest resolution publicly available nighttime data set available. So we’re refining our capability to fully geo reference that information as well, because that kind of data is particularly useful, say, following a hurricane or a wildfire. It’s very useful for mapping where is power out, you know, because, hey, no one, no more lights, you know. So you can both. It’s helpful for both determining where areas have been impacted. So ground response organizations can then go out and direct their efforts prior to their efforts, but it’s also useful for recovery, because you can use that data to track where power is being restored and how much still needs to be restored. And so that’s a capability that we’re seeing asked for and used on a more frequent basis, both with data from the ISS and data from some of the other orbital sensors out there.
Dane Turner
That’s an incredible amount of of data that you’re able to grasp, just from the astronauts themselves and their photographs and a lot of processing back on the ground to match things up.
You mentioned earlier volcanos. Have there been some significant eruptions that that you’ve helped with, as for disaster response?
Will Stefanov
For disaster response, not since I have been part of the DRCS currently, although I can give you a story that sort of relates,
Dane Turner
yeah, great.
Will Stefanov
So several years ago, this is an example of why crew are a good thing to have, and windows on a spacecraft are a good thing to have. The ISS was orbiting over Cleveland volcano.
Dane Turner
Where’s that?
Will Stefanov
That’s in the the Aleutian island chain, and it’s an active volcano. The US Geological Survey is aware it’s an active volcano, but it wasn’t one that had erupted in recent memory, so they it wasn’t very instrumented for a lot of active volcanoes, the USGS has various sensors on the ground that can map things like the ground surface changing, which is an indicator that magma may be coming up and inflating the ground surface as a precursor to an eruption. So Jeff Williams, an astronaut who was on the ISS at the time, just happened to be looking out the window, and he saw an eruption beginning to occur. So he took a camera, took some images of it, and then he decided, he said, Well, I don’t know if anybody knows about this. So he he called down from the ISS to the US Geological Survey, and said, Hey, you have an erupting volcano. Are you aware of it? And as he tells the story, he first had to convince them that he he was actually calling them from the space station. And then once they once they became convinced, they then looked at other data collected from other sensors, other robotic sensors, and they’re like, hey, wow, you’re right. It is, it is erupting, and Cleveland has continued to be active since that time. And so now it is an instrumented Island, an instrumented volcano, by the USGS, and they’re watching it more closely. So that’s one example of how a volcanic eruption really illustrates why the ISS is a good, a good component of this whole system, and why and why am I having astronauts on board? Is a good thing.
Dane Turner
That’s incredible. And are are many volcanoes monitored like that from space?
Will Stefanov
There is yes. The short answer is yes. We We examine quite a few of them with the CEO project, and there are other groups using other satellite assets, who are regularly look at volcanos that are active. They don’t necessarily have to be erupting. In fact, a lot of our imagery that we asked crew to collect is not necessarily because a volcano is erupting, but because it is active. It’s important to get before and after imagery so you can tell what’s changed, and you can map new deposits.
Dane Turner
You’ve also mentioned earthquakes. Can you tell me a little bit more about the responses to those?
Will Stefanov
Yes, So earthquakes, we if one occurs, we would work with the USGS very closely. They have a very extensive earthquake monitoring network and group, we could develop some data products from that most likely disturbance maps using radar data that can also be useful to map where the earthquake has ruptured the Earth’s surface, if it has done so. We can also use crew imagery for that. And this is a relatively new capability. It’s related to the longer lenses that we now have on board the ISS previous, to say, three or four years ago, we we couldn’t collect data using the handheld camera, images that was a sufficiently high resolution that you could actually see something on the ground as a result of an earthquake that you could unambiguously point to and say, Yes, that’s damage from the earthquake, or that’s a that’s a new fault scarp or fissure that was caused by the earthquake. But the the recent earthquakes that occurred in Turkey and Syria, the. Crew had access to much longer lenses on the ISS, and they took imagery of areas surrounding the earthquake epicenter. And when we looked at that data, we began to realize that we could actually see landslides on some of the surrounding mountain ranges. And so this is really one of the the first indicators that okay. We now have sufficient resolution on the ISS with the cameras to be able to collect imagery that could be useful for earthquake response, we can map things like landslides. So that’s that’s a quantum leap forward in our capabilities here from JSC and the ISS program.
Dane Turner
So mentioning landslides, are there areas that you monitor regularly that are maybe at risk of landslides that you just keep an eye on to see if there are changes
Will Stefanov
from the ISS generally no. We don’t have any active science requests for that kind of work. But certainly the USGS keeps track of landslides, landslide prone areas, and if an event occurs, like a wildfire, extensive wildfire, or a very high precipitation event, then if we’re requested to do so, that is something that we we would then engage the DRCs to generate new landslide maps, if necessary, collect new data to assess Whether landslides that have been known, you know, already identified, have been activated, or new ones have activated.
Dane Turner
Fantastic. So what kinds of things are you able to learn from, from all of these different areas that you can learn from space that you can’t get from the ground.
Will Stefanov
Well, the vantage point from space allows you to see a much larger area in a very holistic snapshot in time. Way, when you’re on the ground, you’re fairly limited to dealing with what’s right around you. When you have the the broader view from orbital or airborne data, you can get a much you can get a sense, a more regional sense, of what’s happening. You can see, all right, well, we’re working on this firefront Right here, but Oh, there’s another fire front which we’re seeing over here. So it helps. It works together with the ground observations, just to make sure that we have a broader contextual view of an event and what’s happening with it. It’s also useful for sort of, in a post event type of way. It’s useful to help improve the science on disasters and what, how their what their effects are. For instance, say, the data that we’ve collected from the Southern California wildfires, that information, those maps that we developed, they were useful in the moment for emergency response. They can also now be useful for people researching what happens after vegetation is removed following a wildfire, what happens to the. Soil properties after a after a big wildfire goes through, what? How does that affect? Landslide formation, soil and soil mobilization and runoff, all those things. All that research then feeds into better preparedness for the next thing you know, the next time it happens, we have a better sense of these are the kind of things we need to be looking out for. These are the kind of effects we can expect to happen after this event.
Dane Turner
So all this data really helps, long term, to to help with with the response, not just the response, but also preparing afterwards, preparing for maybe the next event or just the rebuilding of the event, and make sure everything is is going along correctly for that
Will Stefanov
absolutely. And some of this data can also be used. One of the thing that once, something that’s very big in emergency management training, and for us to DRCS, is simulations, you know, preparing people for how to respond to an event. You know, what are the steps that need to be taken. And this data that we collect and keep after an event is also directly useful for those kind of simulations. You know, we don’t have to make up an event from scratch. We can say, this is this actually happened, and this is what we actually saw. And we can design our training programs accordingly.
Dane Turner
What kind of simulations do you do to prepare?
Will Stefanov
they’re usually, they’re called, generally, the tabletop simulations. So you could have a very common simulation for our part of the country down here is Hurricane simulations. You know, we just construct a scenario where there’s a cat three hurricane, which is here we’ll just use Houston, because here we are, a cat three hurricane is predicted to impact Houston in a week. You know, what? What do we do? How do we prepare for it? This is where you engage the various organizations that would be involved in a response and the preparation for it. And so, from the NASA’s, the NASA perspective, we would be engaged in, all right, what happens when we activate? You know, we in this simulation, we receive a request from FEMA. We want to know we would like before imagery, imagery during the event and after imagery. And so then we work through the simulation and we model what happens. Like, what sensors do we have available at the time the hurricane is passing, what’s the weather conditions going to be like? You know, if we can’t, if it’s completely cloud covered, do we have other assets that we can use? So, like radar assets that can image the ground surface through the clouds. And so we work all those processes to make sure that we’re coordinating with each other. We’re talking we’re scheduling data collections from the various sensors, we’re engaging the appropriate science teams that would need to be engaged to develop products, and making sure that how all of our reporting channels are set up correctly.
Dane Turner
And with these tabletop Sims, it’s it’s you guys sitting around a table and working through this step by step, how you would respond? Is that how it works?
Will Stefanov
in the classical sense? Yes, historically, you would be sitting around a table. You can, of course, now do things a little bit more remotely. You can engage a number of different organizations in the in the in the tabletop exercise. They may not necessarily all be around a table, but
Dane Turner
okay, so it can be electronic, through email or through something,
Will Stefanov
yeah, and that’s part of that. That’s part of the simulation too. It’s also modeling what are the communication pathways, you know, and making sure that those are set up correctly.
Dane Turner
Okay, that’s really cool. So what outside groups? Yeah, I know you mentioned FEMA earlier. What other outside groups are you often working with for the responses?
Will Stefanov
FEMA is the major one, certainly in my time with the DRCs and this, we just rolled out this version of it last year, in summer up at headquarters. So we’re still, we’re still finalizing our processes, you know, fine tuning them. So between FEMA. We also work a lot with the US Geological Survey, their landslide team is a team that we correspond with quite frequently for events where we’re concerned about that kind of, you know, that kind of, that kind of hazard. We do work with some NGOs like Red Cross, and we also work with regional and local areas, for instance, for the Southern California wildfires, we were working with Los Angeles County. We were working with the City of Los Angeles and, you know, we’re all part of it is coordinating with all of these various entities, you know, responding to their requests and making sure everyone’s getting what they need.
Dane Turner
I know you. You give all the data to these organizations, everything. But does NASA have any physical presence at the responses? Does? What does NASA do specifically for these responses?
Will Stefanov
Our role is primarily data collection and data. Product delivery. We don’t, we don’t typically get involved in the on the ground response. We, as I mentioned earlier, for some events, we have, we have staffed, or had someone representative in the FEMA response coordination centers for an event, but in terms of actually being on the ground, doing, you know, doing firefighting or or, you know, debris clearing. We don’t typically do that. That’s, that’s not our that’s not our purview as NASA like so we are primarily a data collection and data analysis agency, and that’s our role.
Dane Turner
You’ve been at this for a little while. Do you have any memorable moments with any responses that you’ve been a part of.
Will Stefanov
I would say, yeah, one comes to mind several years ago in a in a previous incarnation of the disasters program I was, I was the center coordinator at that time, and this was when we had hurricane Harvey come through, and we were having daily coordination calls. And it was kind of, it was a bit of a surreal experience to call in. Fortunately, I had power during that event to call in and give the report from JSC and tell them, Well, I’m, I’m actually in the event. You know, it’s happening right now, there’s, there’s water coming through the roof of my house. So my report is going to be short, but here’s what we’re doing. Yeah, that’s probably one of the most memorable things I have, both reporting on it and being involved in the response to it, but also being actively affected by it.
Dane Turner
Oh my goodness. So speaking of Houston, we’re in a very vulnerable zone for things like hurricanes and floods and even tornadoes as well. What sort of plans are there in place to keep NASA workers safe, both on the ground and in space when there’s a weather event at JSC
Will Stefanov
that, I mean, that’s mostly our emergency management group here does that sort of planning from our perspective. I, I can work with them to kind of let them know what, what, what data we have available to them from NASA particularly, to help map things like flooding. And we do work with the emergency management group there as well. They also work with us a little bit as sure you’re aware, we house the Apollo moon samples, and so our group here has processes in place when something happens to safe all of that material, and that’s part of our emergency management plans. But really that that sort of the the the workforce planning and response, like when the center closes, and how people continue to do their work if they’re able. That’s more on the emergency management sort of center operations, end of things
Dane Turner
with all of these different organizations that you’ve worked with and everything do they give you feedback on what you’re able to provide and how you can improve things
Will Stefanov
they do and and we, we actively solicit that from them. That’s that’s how we learn and can help improve our processes. A lot of the products that we produce, since they are these are the bespoke products. They are kind of given, with a the caveat of, this is a prototype product. You know, this is what we were able to produce, sort of use, use at your own risk. And the response agencies, they they understand that, in many cases, for these responses, any data that they get is useful. And you know, since we’re producing it from NASA, we do provide it with a certain level of of confidence, you know, we’re the subject matter experts that we employ to do these things. These are people who’ve, who’ve worked on looking at disturbance and mapping it from remotely sense instruments for their careers, you know, or they’re experts in fire, fire dynamics. And so the products that we produce have a have a certain, certain baseline level of expertise that go into them, but like any kind of remotely sensed product, until you have very detailed calibration, validation data, ground truth data, you can’t, you can’t put boundaries on exactly how accurate it is. So we just make sure that that’s we make. We make our partners aware of that if they ask us to produce something
Dane Turner
you’ve talked a bit about data portals, and are these publicly available?
Will Stefanov
Yes, the disasters, our mapping portal is open, and it uses just common formats for GIS systems or Google Earth type systems like GeoTIFF and ArcGIS formats. Yeah, that’s you could you can check out what we have at it’s maps.disasters.nasa.gov, and you can explore our portal. We have a number of different products, the near real time products that I mentioned earlier, that you can access through the portal. We have, we maintain archives for the event. That we’ve covered, we have a number of dashboards that point you to different classes of disaster, like data we’ve collected for floods or hurricanes or such, and for some events, after the event is done, we can also produce ArcGIS story maps, so that if someone is interested in getting that kind of sort of narrative format of what the event was and what we did to respond to it, that’s available in there too, rather than sifting through folders of data.
Dane Turner
That’s cool. Is there a way that maybe the public can get involved in the collection or analysis of this?
Will Stefanov
Generally speaking, I’d say we don’t have any systems like that set up right now. There are, I mean, there are programs that certainly do solicit citizen science data, like like the globe program. And there are, there have been efforts to use public data like social media reports or even cell phone locations to feed into things like earthquake response, you know, measure but, but we don’t have direct systems set up like that for the DRCS at present.
Dane Turner
Is there anything else about the JC disaster response that you would like to let people know about?
Will Stefanov
I’d say it’s, it’s really, it’s a it’s a good example of how the International Space Station is useful for this. Prior to about 2012 it was, it was all orbital systems. And at the time we the program, started talking with the International disaster charter, about how the ISS could be involved in that, you know, we are collecting data too, and it being a crude platform, it has a sort of a unique advantage over a lot of the robotic sensor systems, and that you have humans on board. Literally, they can look out a window and see something happening. You know, they could see a volcanic eruption beginning, they can see a hurricane from angles that you don’t typically get from other sensors. And when we made that case and realized that, oh, this is a very valuable data set that we collect, then we started getting traction on, oh, let’s involve the ISS in this and I’d say that has continued since then, where that’s our that’s why JSC is part of the DRCS. Primarily is because of the International Space Station connection and the fact that we interface directly with that that platform and collect that data and can make it available to the DRCS.
Dane Turner
This has been absolutely fascinating, and I really appreciate you coming on this the podcast today.
Will Stefanov
It’s been my pleasure. I mean, this is a, this is an activity that I think is it’s useful to let people know that NASA does this, and it really highlights a very applied use of all the data that we collect from our various sensor systems, you know, directly to help out the humanitarian needs and helping to prepare us for the next, you know, the next disaster that’s going to happen. Because unfortunately, we can probably expect that they will.
<Outro Music>
Dane Turner
Thanks for sticking around. I hope you learned something new today.
You can check out the latest from around the agency at nasa.gov. And if you want to check out NASA’s disaster response data for yourself, you can find it at maps.disasters.nasa.gov. Our full collection of episodes and all the other wonderful podcasts around the agency can be found at nasa.gov/podcasts.
On social media we’re on the NASA Johnson Space Center pages of Facebook, X, and Instagram. If you have any questions for us or suggestions for future episodes email us at nasa-houstonpodcast@mail.nasa.gov
This interview was recorded February 28, 2025.
Our producer is myself, Dane Turner. Audio Engineers are Will Flato, Daniel Tohill. And our social media is managed by Dominique Crespo. Houston We Have a Podcast was created and is supervised by Gary Jordan. Special thanks to Victoria Segovia for helping us plan and set up this interview. And of course, thanks again to Will Stefanov for taking the time to come on the show.
Give us a rating and feedback on whatever platform you’re listening to us on, and tell us what you think of our podcast.
We’ll be back next week.

