


Science in Space: April 2024
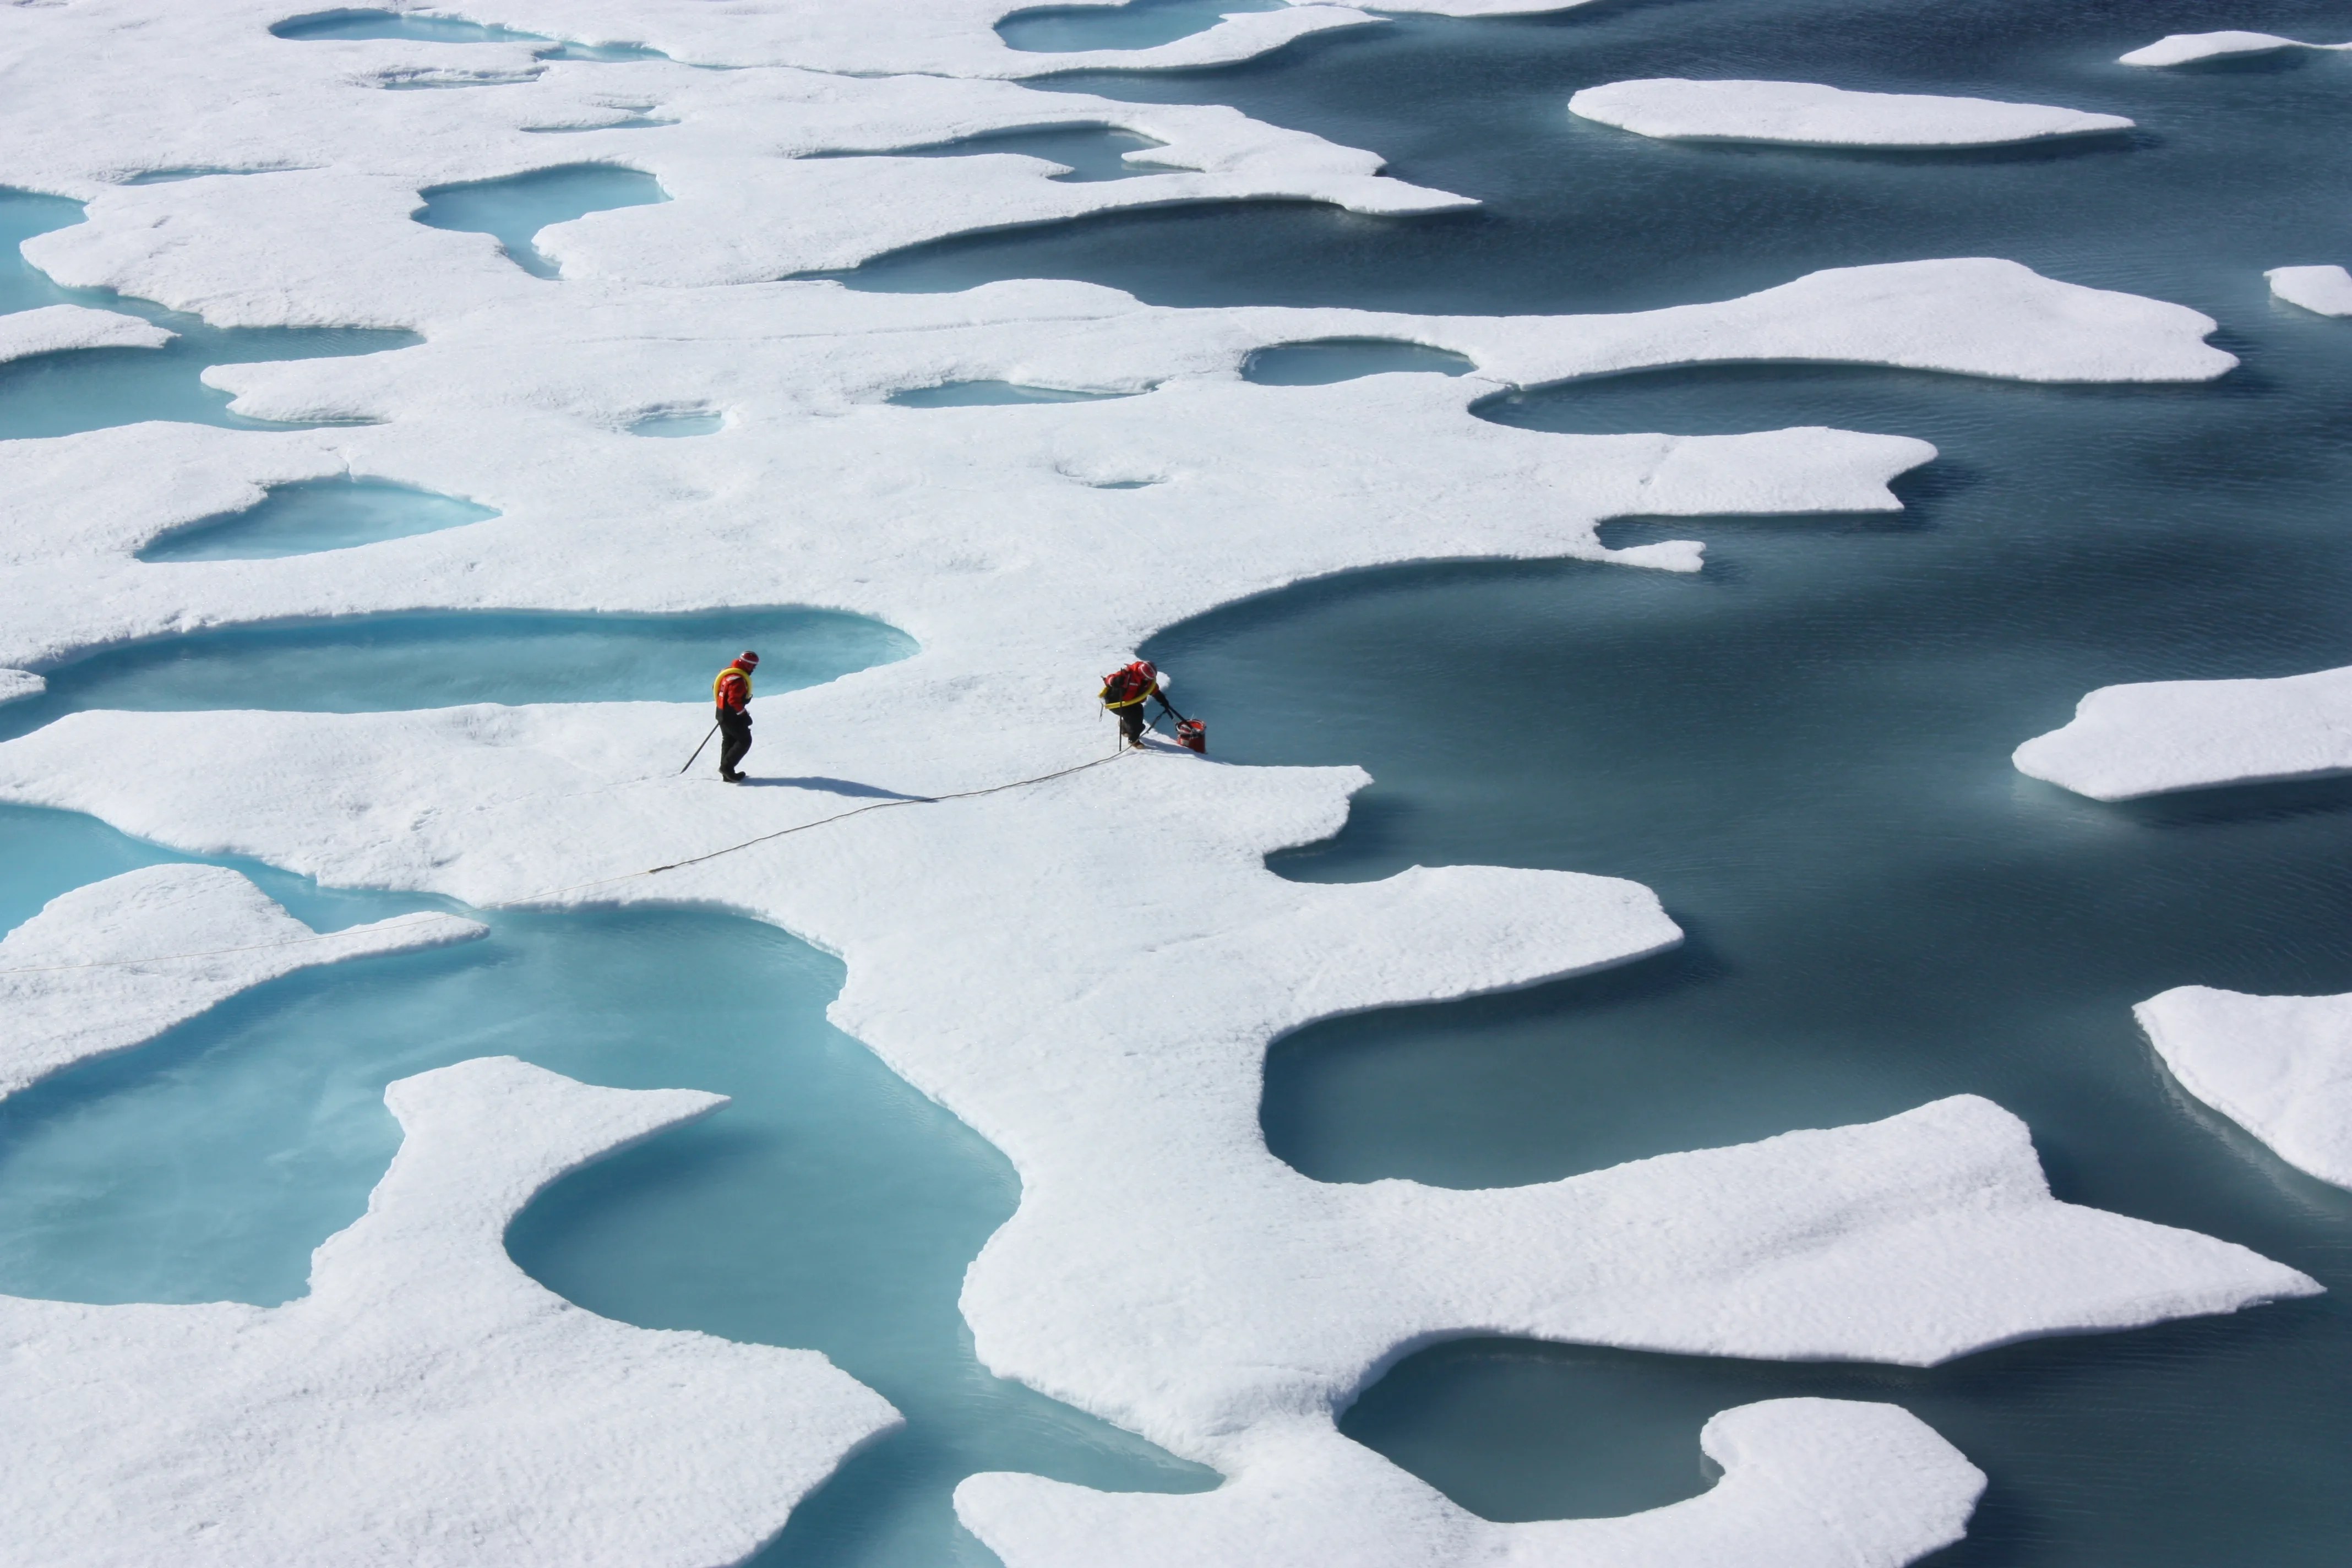
Everyone on Earth is touched by the effects of climate change, such as hotter temperatures, shifts in rain patterns, and sea level rise. Collecting climate data helps communities better plan for these changes and build more resilience to them.
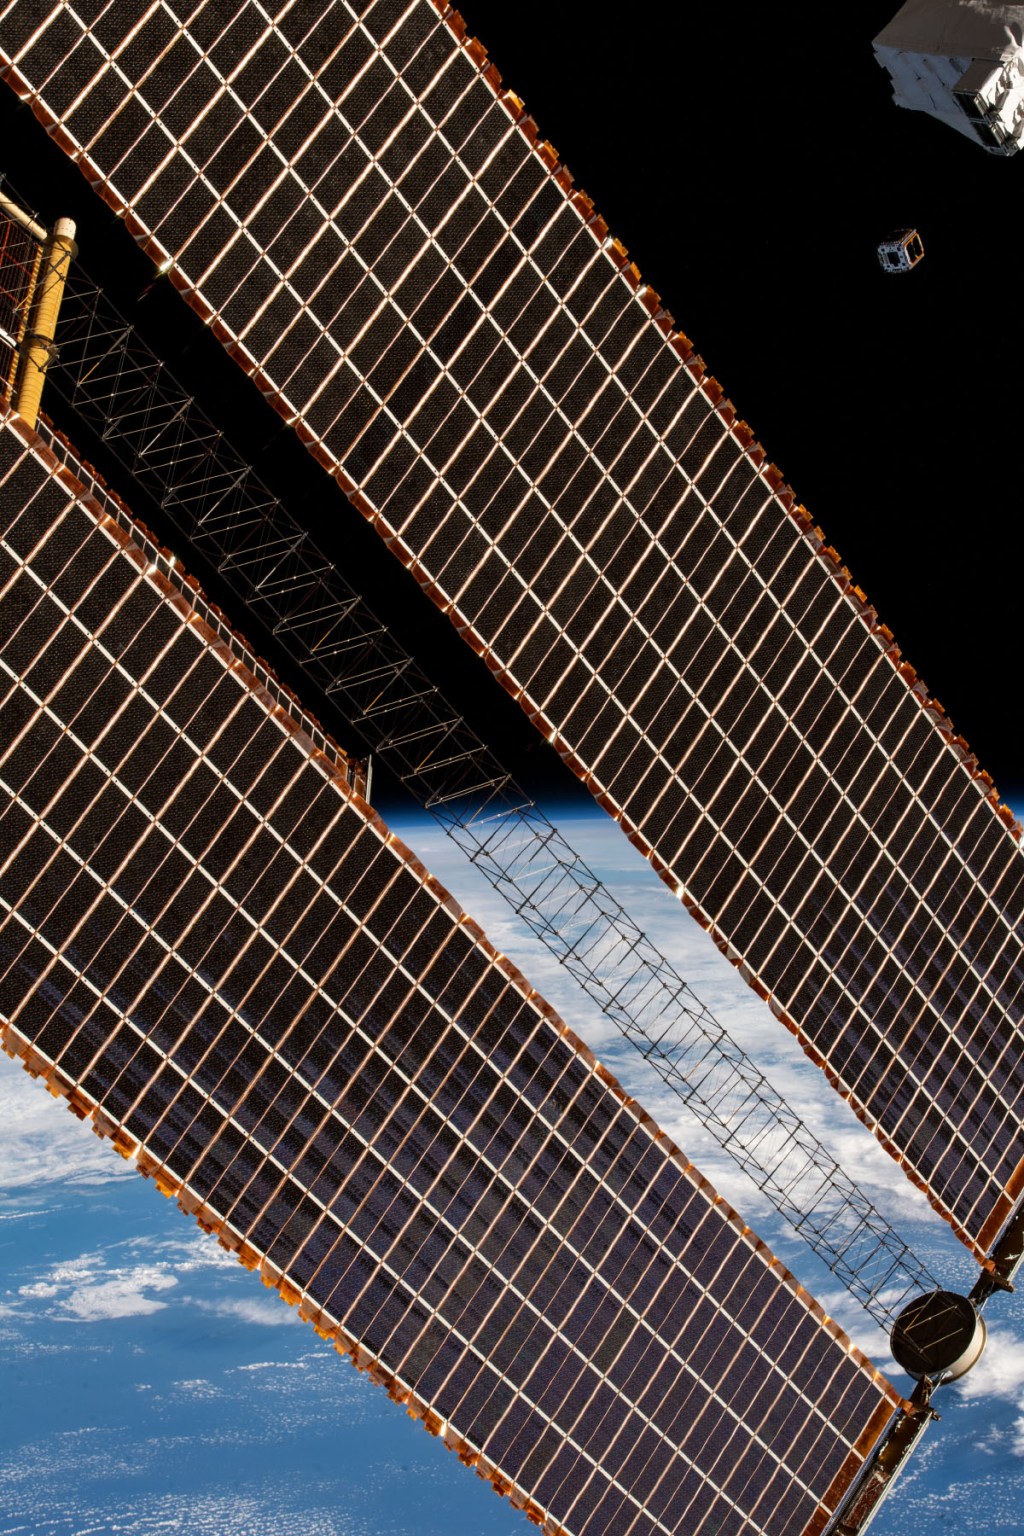
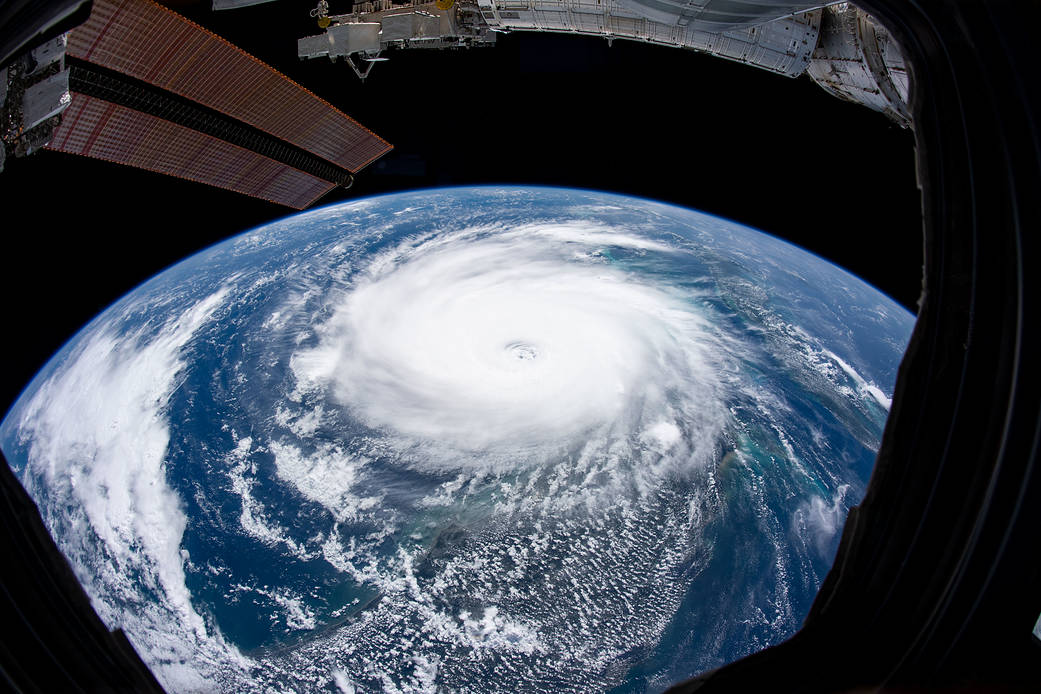
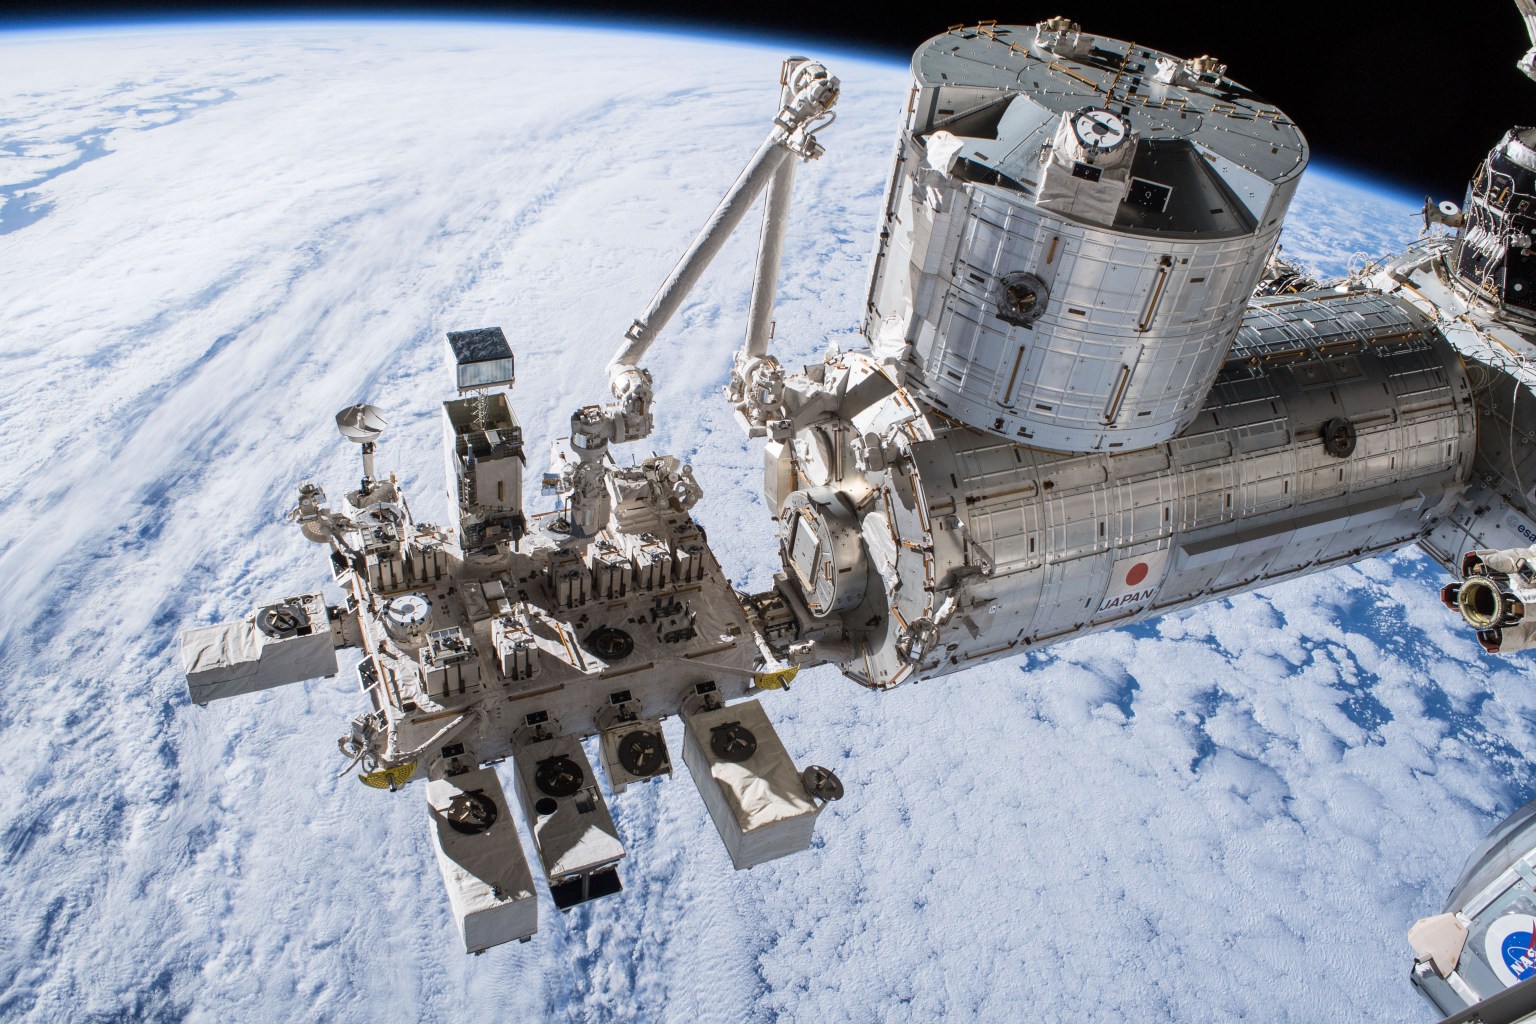
The International Space Station, one of dozens of NASA missions contributing to this effort, has multiple instruments collecting various types of climate-related data. Because the station’s orbit passes over 90 percent of Earth’s population and circles the planet 16 times each day, these instruments have views of multiple locations at different times of day and night. The data inform climate decisions and help scientists understand and solve the challenges created by climate change.
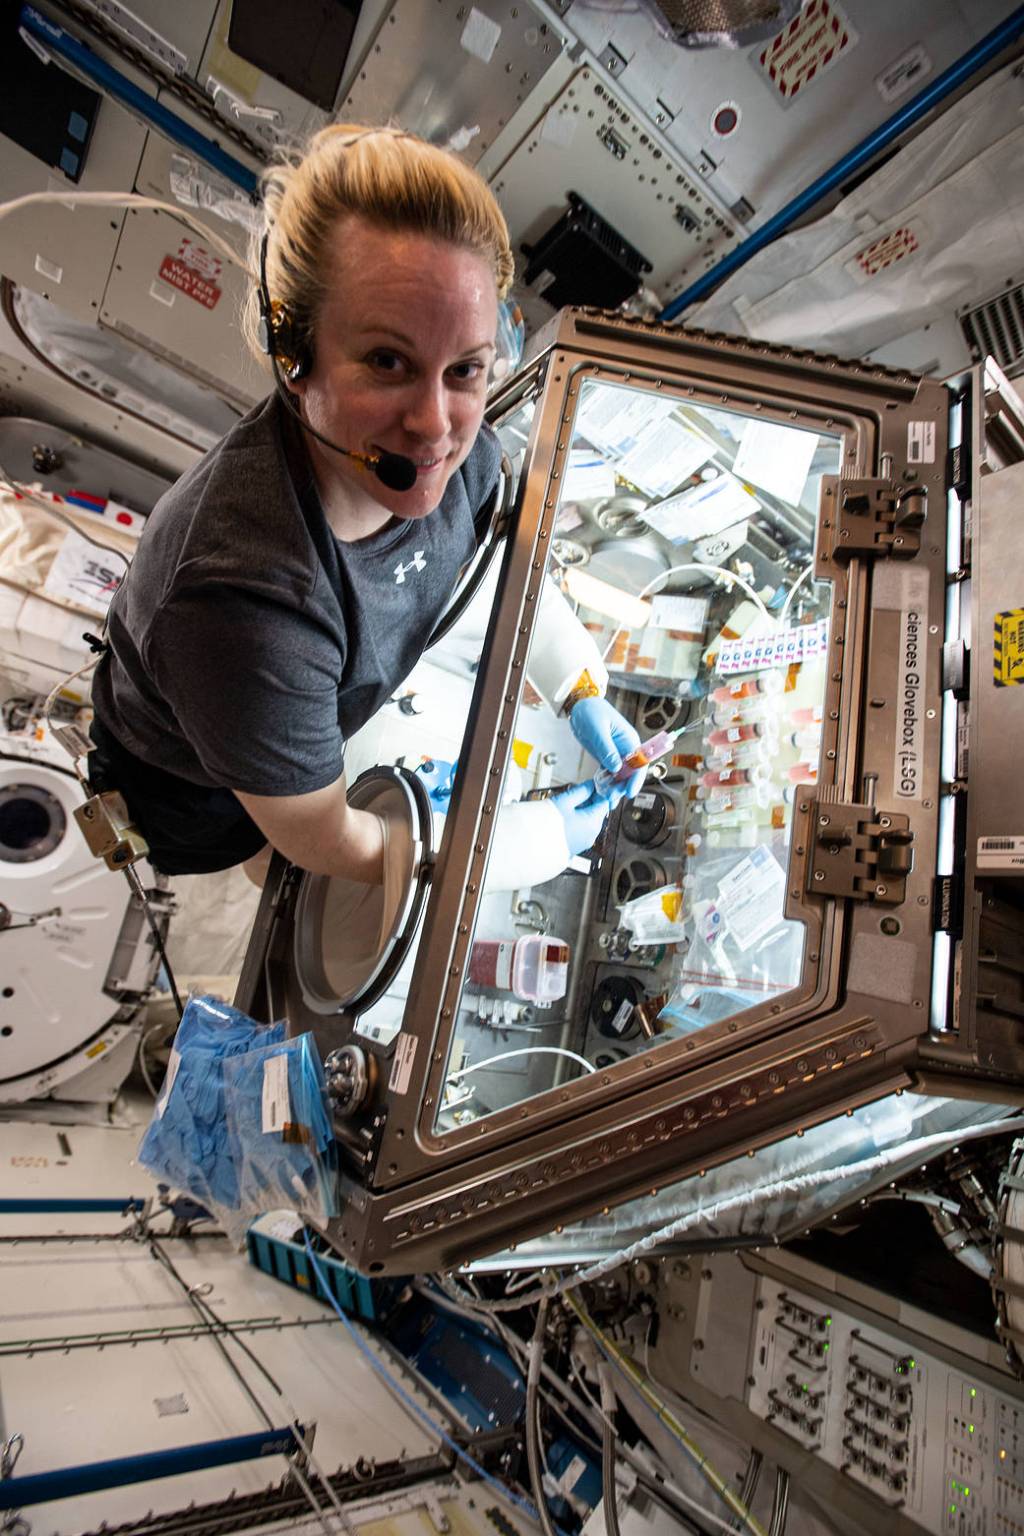
While crew members have little involvement in the ongoing operation of these instruments, they do play a critical role in unpacking hardware when it arrives at the space station and in assembling and installing the instruments via spacewalks or using the station’s robotic arm.
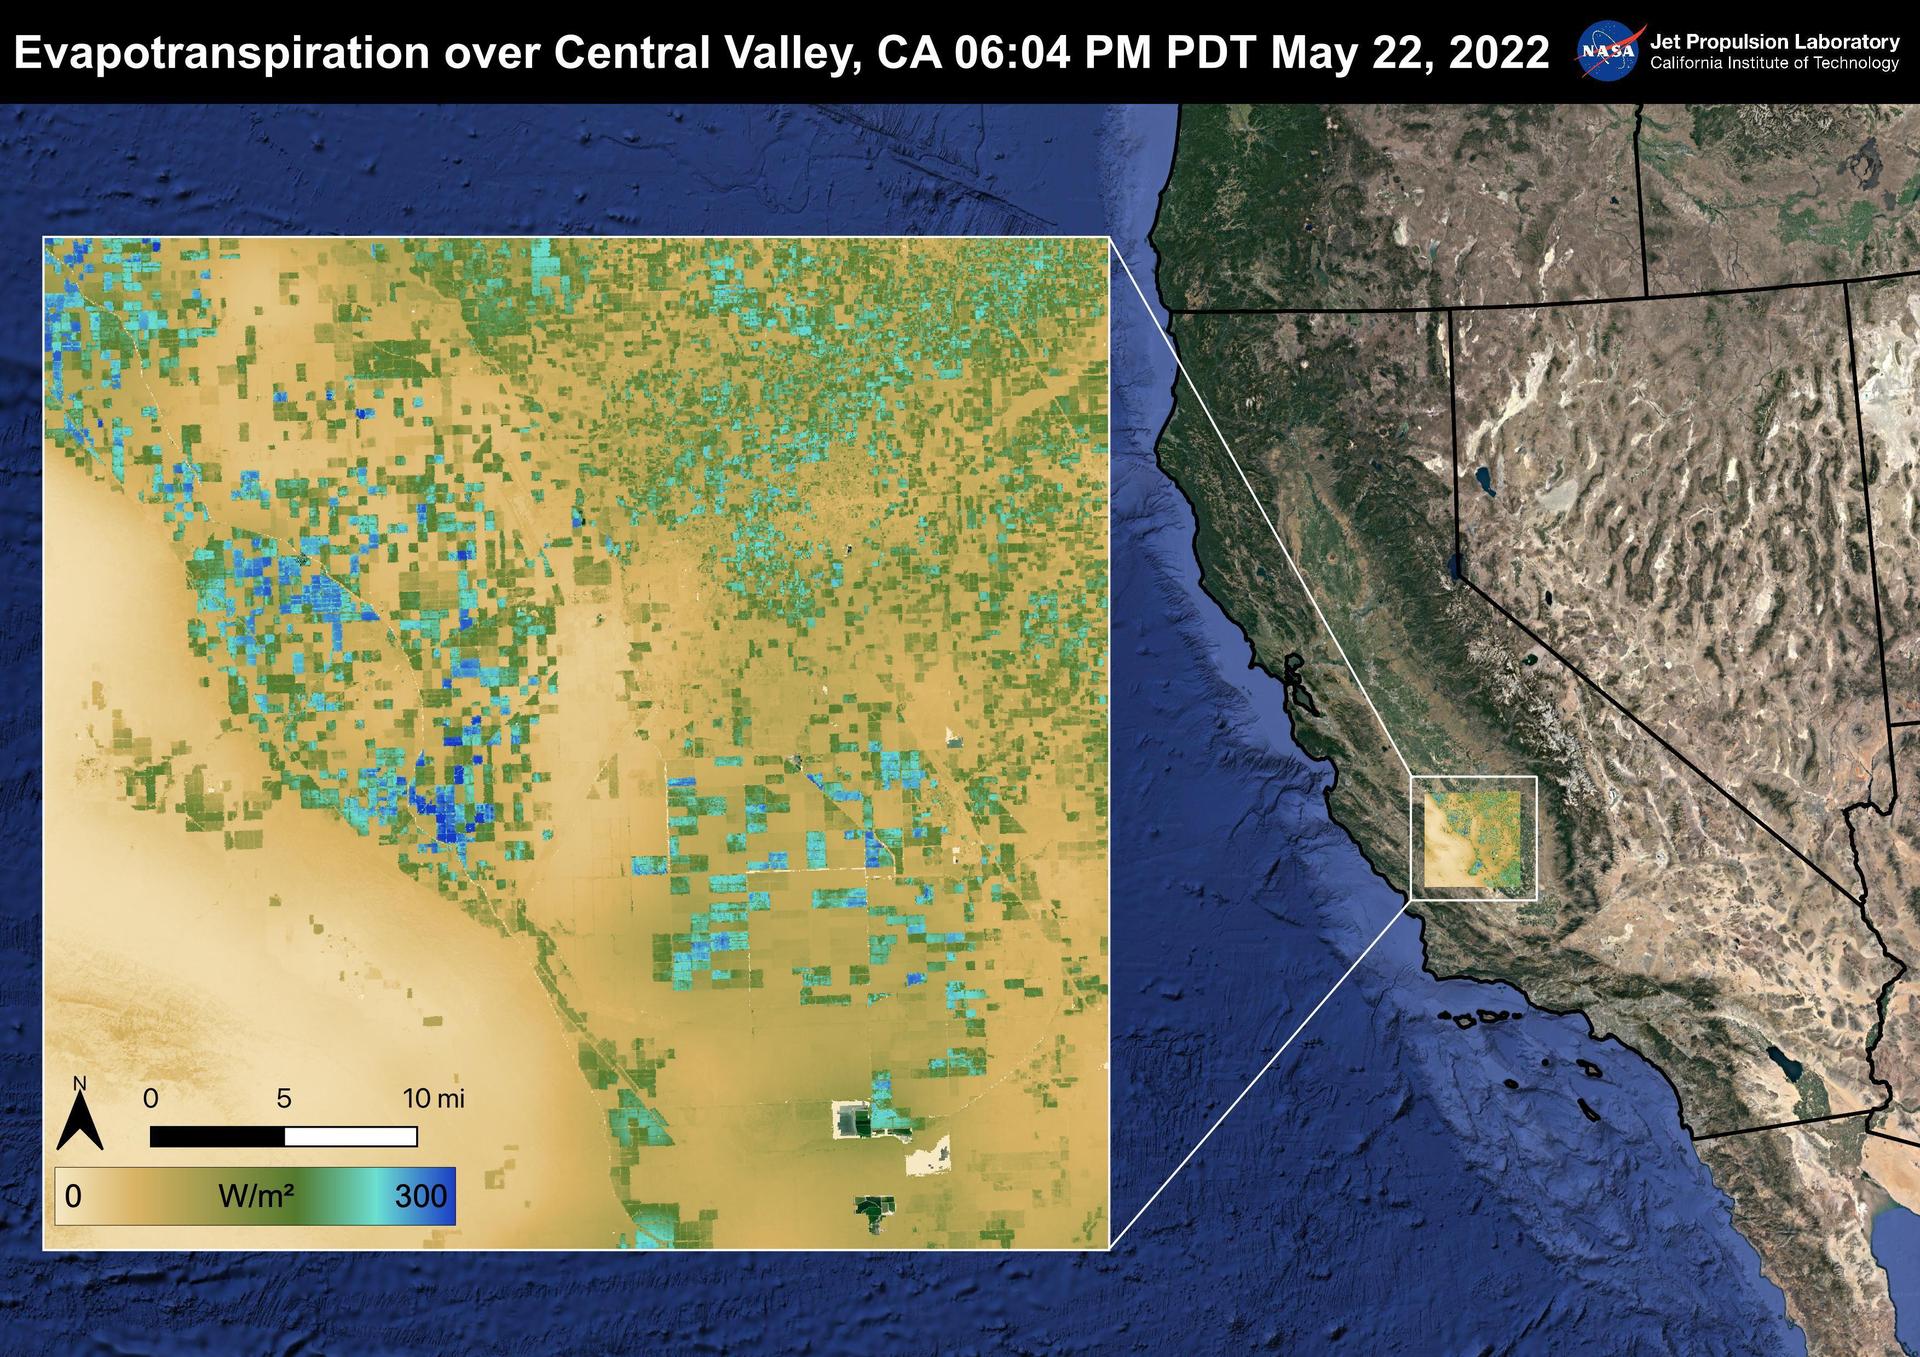
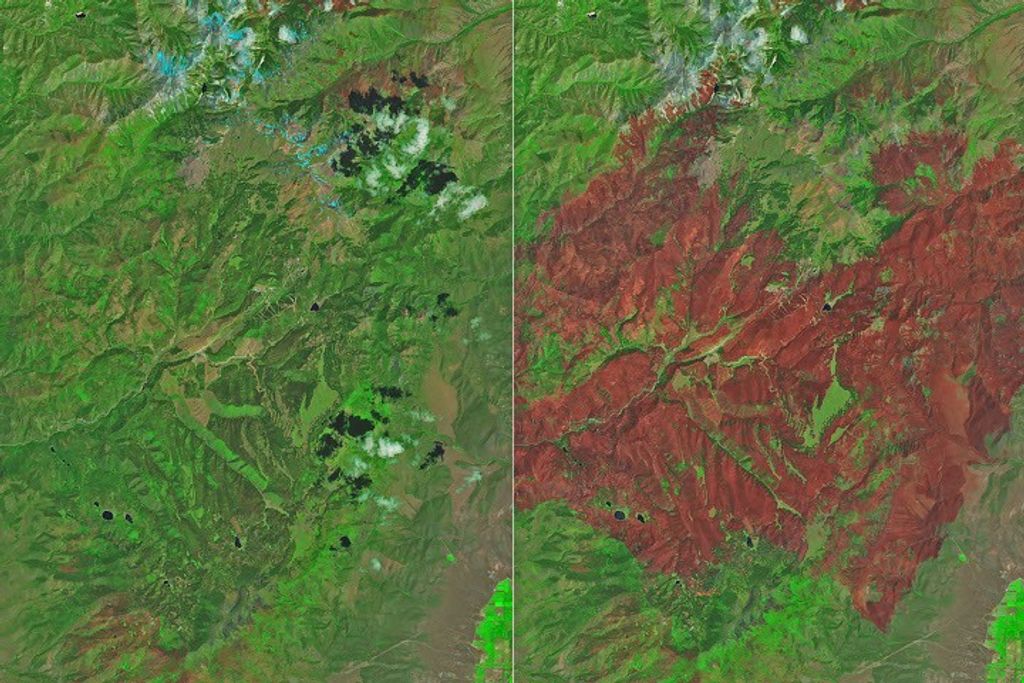
One investigation on the orbiting lab that contributes to efforts to monitor and address climate change is ECOsystem Spaceborne Thermal Radiometer Experiment on Space Station (ECOSTRESS). It provides thermal infrared measurements of Earth’s surface that help answer questions about water stress in plants and how specific regions respond to climate change. Research confirmed the accuracy of ECOSTRESS surface estimates1 and found that the process of photosynthesis in plants begins to fail at 46.7 degrees C (114 degrees F).2 Average temperatures have increased 0.5 degrees C per decade in some tropical regions, and temperature extremes are becoming more pronounced. Rainforests are a primary producer of oxygen and, without sufficient mitigation of the effects of climate change, leaf temperatures in these tropical forests soon could approach this failure threshold.
The Total and Spectral Solar Irradiance Sensor (TSIS) measures total solar irradiance (TSI) and solar spectral irradiance (SSI). TSI is the total solar energy input to Earth and SSI measures the Sun’s energy in individual wavelengths. Energy from the Sun drives atmospheric and oceanic circulations on Earth, and knowing its magnitude and variability is essential to understanding Earth’s climate. Researchers verified the instrument’s performance and showed that it made more accurate measurements than previous instruments.3,4 TSIS maintains a continuity of nearly 40 years of data on solar irradiance from space-based observations.
The Global Ecosystem Dynamics Investigation (GEDI) observes global forests and topography using light detection and ranging (lidar). These observations could provide insight into important carbon and water cycling processes, biodiversity, and habitat. One study used GEDI data to estimate pan-tropical and temperate biomass densities at the national level for every country observed and the sub-national level for the United States.5
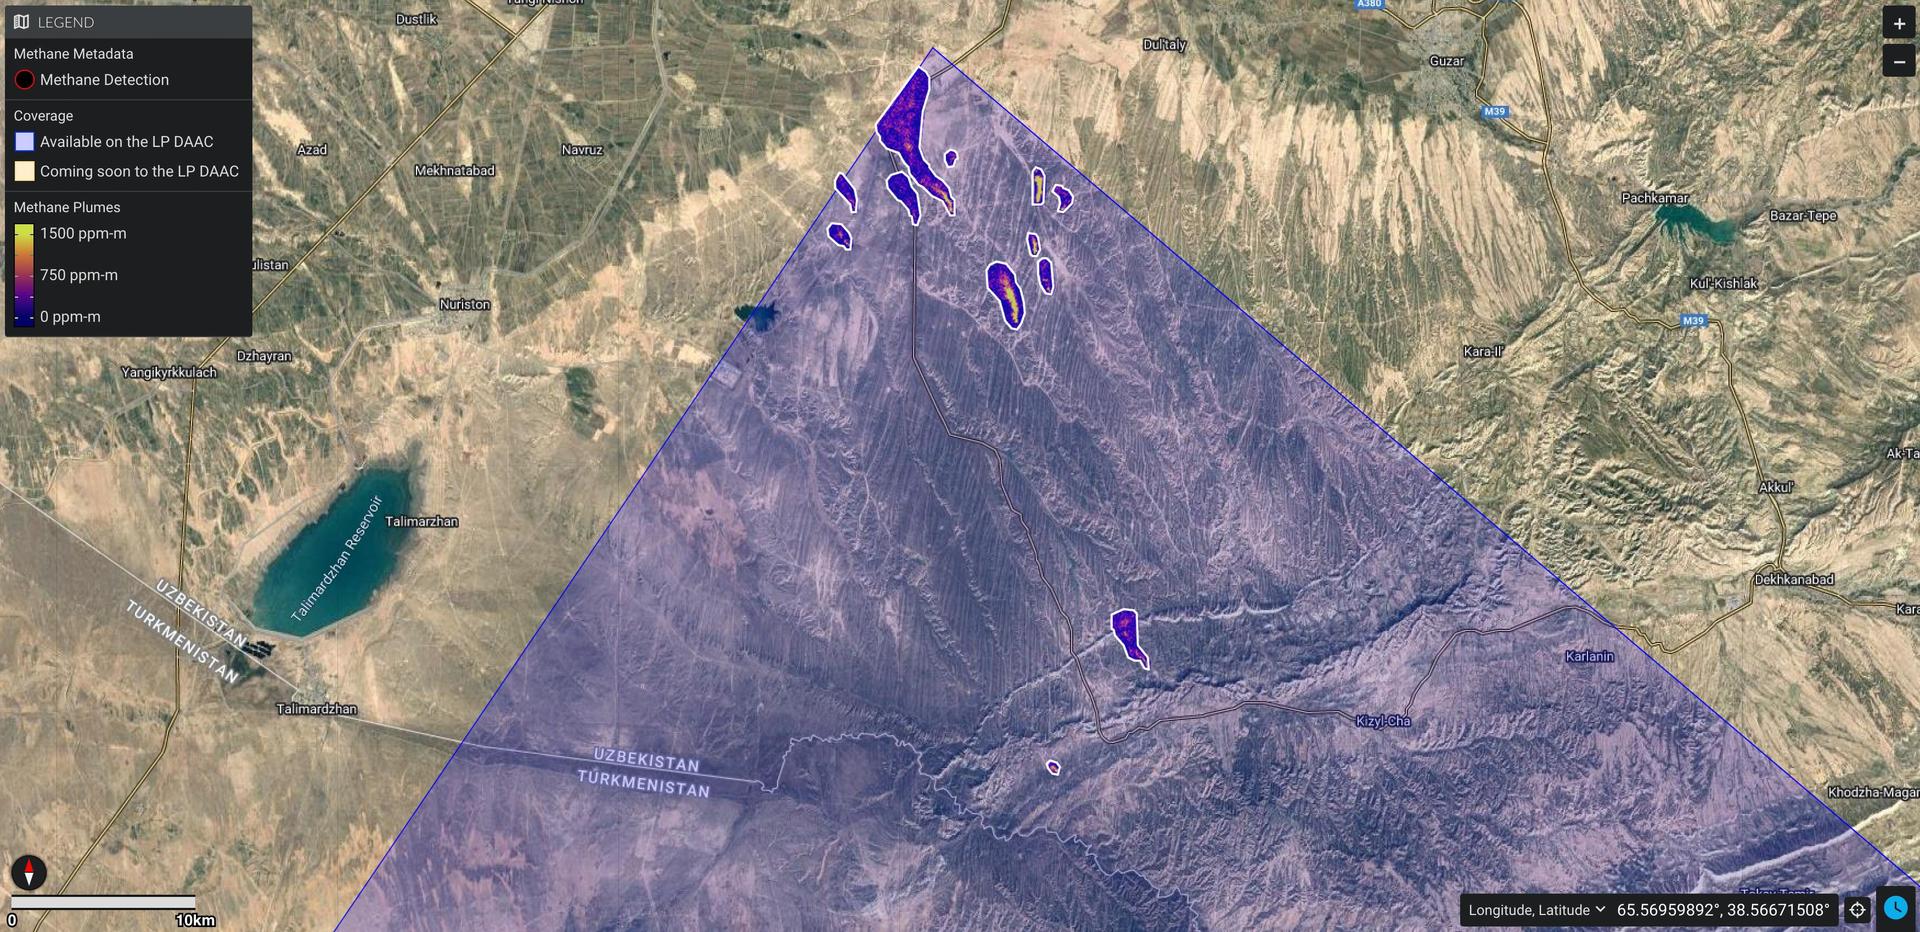
Earth Surface Mineral Dust Source Investigation (EMIT) determines the type and distribution of minerals in the dust of Earth’s arid regions using an imaging spectrometer. Mineral dust affects local warming and cooling, air quality, rate of snow melt, and ocean plankton growth. Researchers demonstrated that data from EMIT also can be used to identify and monitor specific sources of methane and carbon dioxide emissions. Carbon dioxide and methane are the primary human-caused drivers of climate change. Increasing emissions in areas with poor reporting requirements create significant uncertainty in the global carbon budget.6 The high spatial resolution of EMIT data could allow precise monitoring even of sources that are close together.
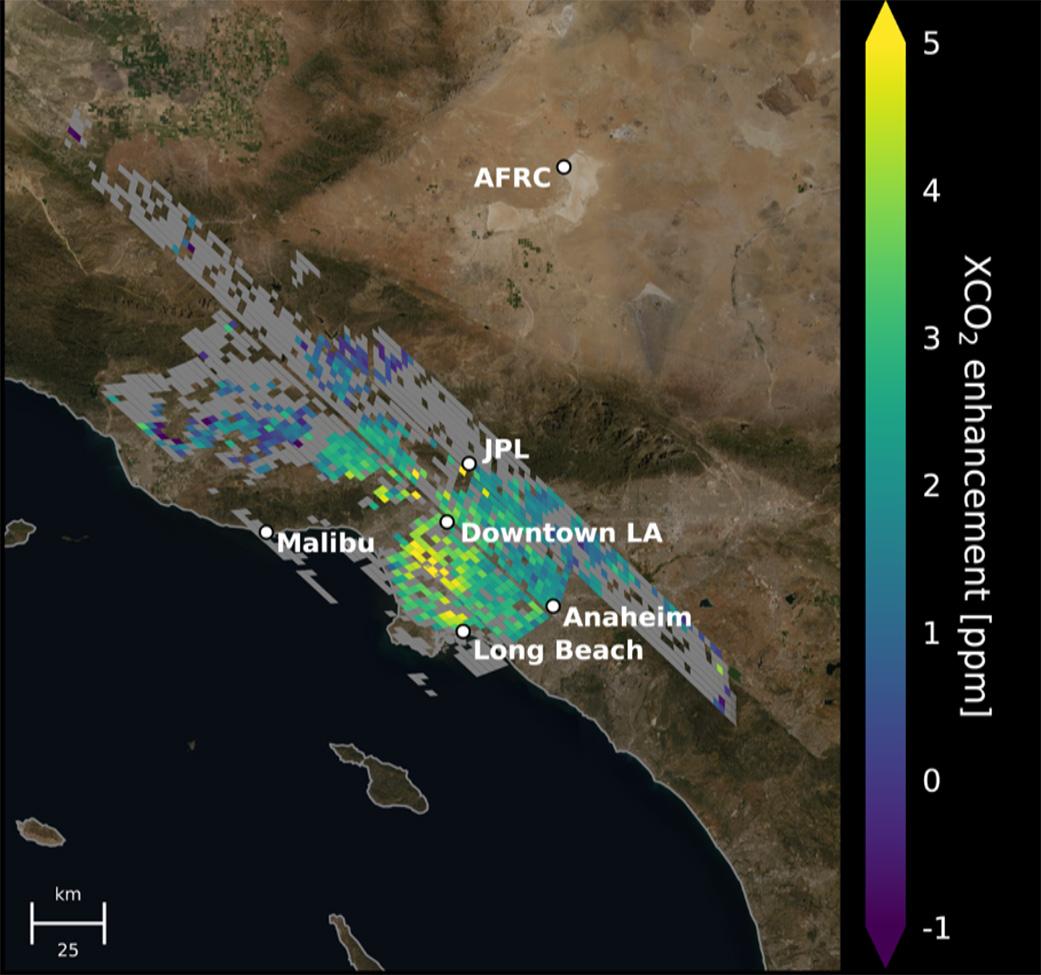
The station’s Orbiting Carbon Observatory-3 (OCO-3) collects data on global carbon dioxide during sunlit hours, mapping emissions of targeted local hotspots. This type of satellite-based remote sensing helps assess and verify emission reductions included in national and global plans and agreements. Monitoring by OCO-3 and the Italian Space Agency’s PRecursore IperSpettrale della Missione Applicativa (PRISMA) satellite of 30 coal-fired power plants between 2021 and 2022 showed agreement with on-site observations.7 This result suggests that under the right conditions, satellites can provide reliable estimates of emissions from discreet sources. Combustion for power and other industrial uses account for an estimated 59% of global human-caused carbon dioxide emissions.
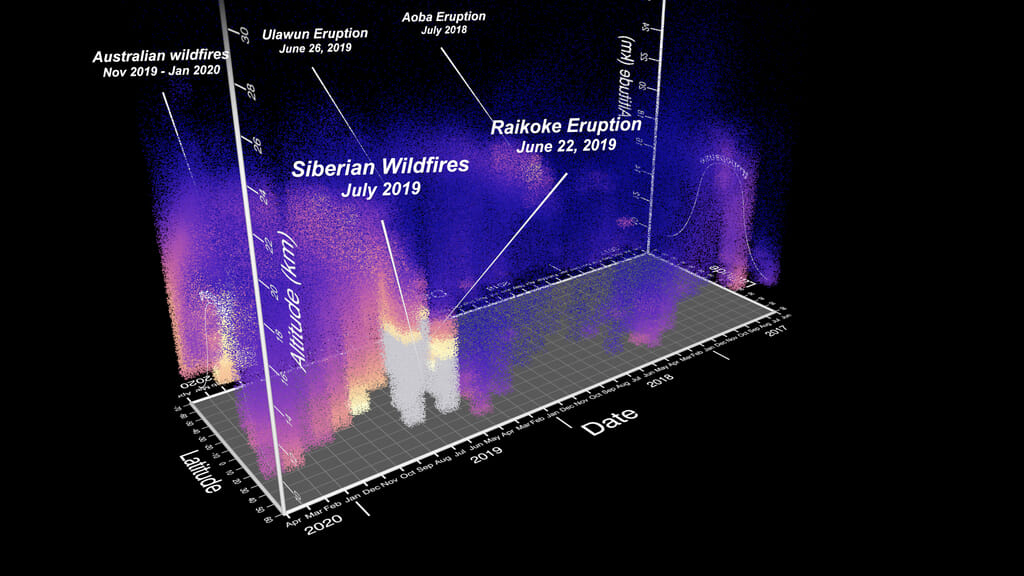
The Stratospheric Aerosol and Gas Experiment III-ISS (SAGE III-ISS) measures ozone and other gases and tiny particles in the atmosphere, called aerosols, that together act as Earth’s sunscreen. The instrument can distinguish between clouds and aerosols in the atmosphere. A study showed that aerosols dominate Earth’s tropical upper troposphere and lower stratosphere, a transition region between the two atmospheric levels. Continuous monitoring and identification of these layers of the atmosphere helps quantify their effect on Earth’s climate.8
An early remote sensing system, ISS SERVIR Environmental Research and Visualization System (ISERV), captured images of Earth at pre-programmed intervals through a window in the space station with high-quality optics, known as the Window Observational Research Facility (WORF). Researchers reported that this type of Earth observation is critical for applications such as mapping land use and assessing carbon biomass and ocean health.9
John Love, ISS Research Planning Integration Scientist
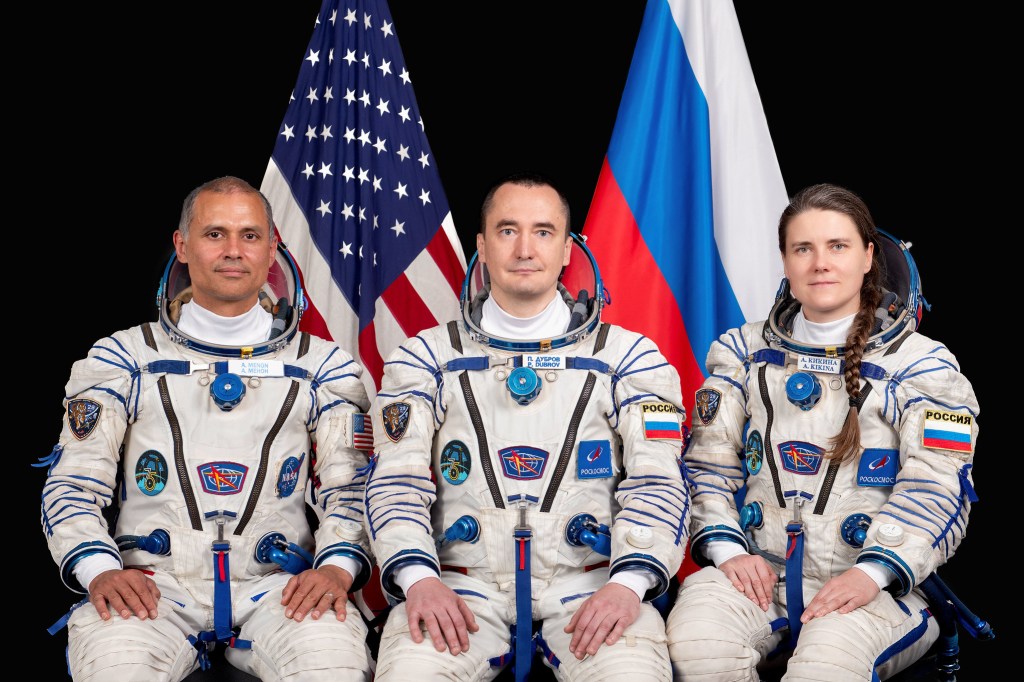
Expedition 71
Search this database of scientific experiments to learn more about those mentioned above.
Citations:
1 Weidberg N, Lopez Chiquillo L, Roman S, Roman M, Vazquez E, et al. Assessing high resolution thermal monitoring of complex intertidal environments from space: The case of ECOSTRESS at Rias Baixas, NW Iberia. Remote Sensing Applications: Society and Environment. 2023 November; 32101055. DOI: 10.1016/j.rsase.2023.101055.
2 Doughty CE, Keany JM, Wiebe BC, Rey-Sanchez C, Carter KR, et al. Tropical forests are approaching critical temperature thresholds. Nature. 2023 August 23; 621105-111. DOI: 10.1038/s41586-023-06391-z.
3 Richard EC, Harber D, Coddington OM, Drake G, Rutkowski J, et al. SI-traceable spectral irradiance radiometric characterization and absolute calibration of the TSIS-1 Spectral Irradiance Monitor (SIM). Remote Sensing. 2020 January; 12(11): 1818. DOI: 10.3390/rs12111818.
4 Coddington OM, Richard EC, Harber D, Pilewskie P, Chance K, et al. The TSIS-1 hybrid solar reference spectrum. Geophysical Research Letters. 2021 April 26; 48(12): e2020GL091709. DOI: 10.1029/2020GL091709
5 Dubayah R, Armston J, Healey S, Bruening JM, Patterson PL, et al. GEDI launches a new era of biomass inference from space. Environmental Research Letters. 2022 August; 17(9): 095001. DOI: 10.1088/1748-9326/ac8694.
6 Thorpe A, Green RD, Thompson DR, Brodrick PG, Chapman DK, et al. Attribution of individual methane and carbon dioxide emission sources using EMIT observations from space. Science Advances. 2023 November 17; 9(46): eadh2391. DOI: 10.1126/sciadv.adh2391.
7 Cusworth DH, Thorpe A, Miller CE, Ayasse AK, Jiorle R, et al. Two years of satellite-based carbon dioxide emission quantification at the world’s largest coal-fired power plants. Atmospheric Chemistry and Physics. 2023 November 24; 23(22): 14577-14591. DOI: 10.5194/acp-23-14577-2023.
8 Bhatta S, Pandit AK, Loughman R, Vernier J. Three-wavelength approach for aerosol-cloud discrimination in the SAGE III/ISS aerosol extinction dataset. Applied Optics. 2023 May; 62(13): 3454-3466. DOI: 10.1364/AO.485466.
9 Kansakar P, Hossain F. A review of applications of satellite earth observation data for global societal benefit and stewardship of planet earth. Space Policy. 2016 May; 3646-54.