


The Vic Emergency site is still reporting 53 ongoing fire incidents in Victoria, Australia which is down from the 100 incidents that were being tracked on March 7, 2019. Some of these fires, however, are still out of control. Weather experts have confirmed that Australia is experiencing a particularly brutal summer season with temperatures breaking records. The Australian Bureau of Meteorology has confirmed that January 2019 was the hottest month on record. These kind of temperatures create a hotter, drier environment. Very low rainfall accompanied the record heat of summer. At the national scale, each month was notably dry, and total summer rainfall was around 30% below average. All of those conditions create a flash point for bushfires to start.
Currently of the 53 incidents being tracked, these are the incidents that stand out:
Howqua – 2178 ha/5382 acres (contained)
Licola – 75,119 ha/185,623 acres (not under control)
Dargo – 21,186 ha/52,352 acres (not under control)
Timbarra – 22,705 ha/56105 acres (controlled)
Rosedale – 12,418 ha/30,685 acres (controlled)
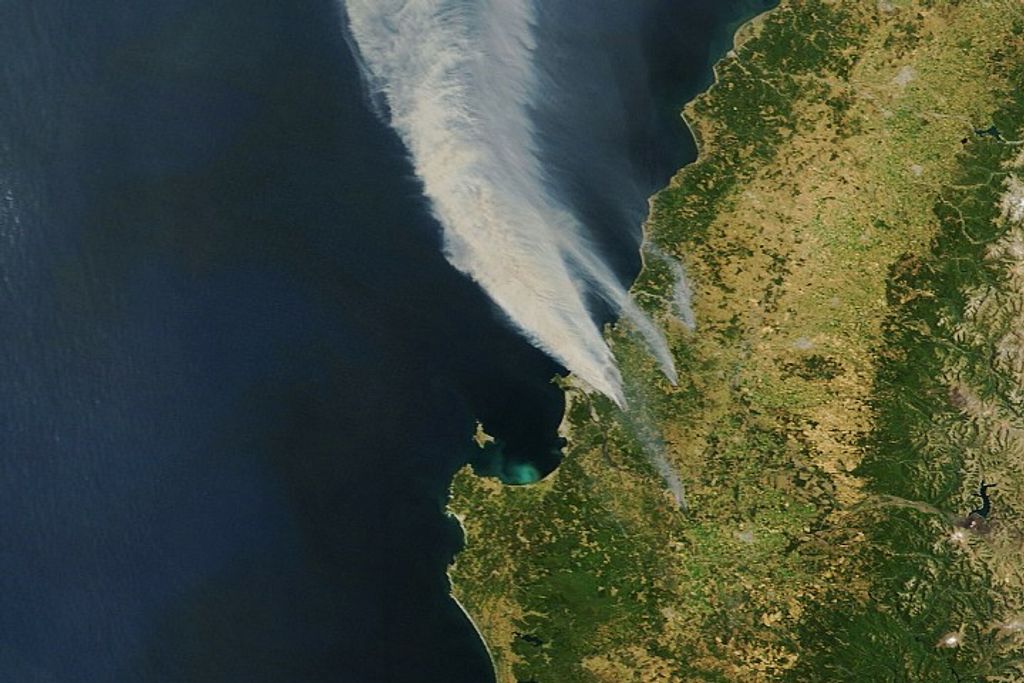
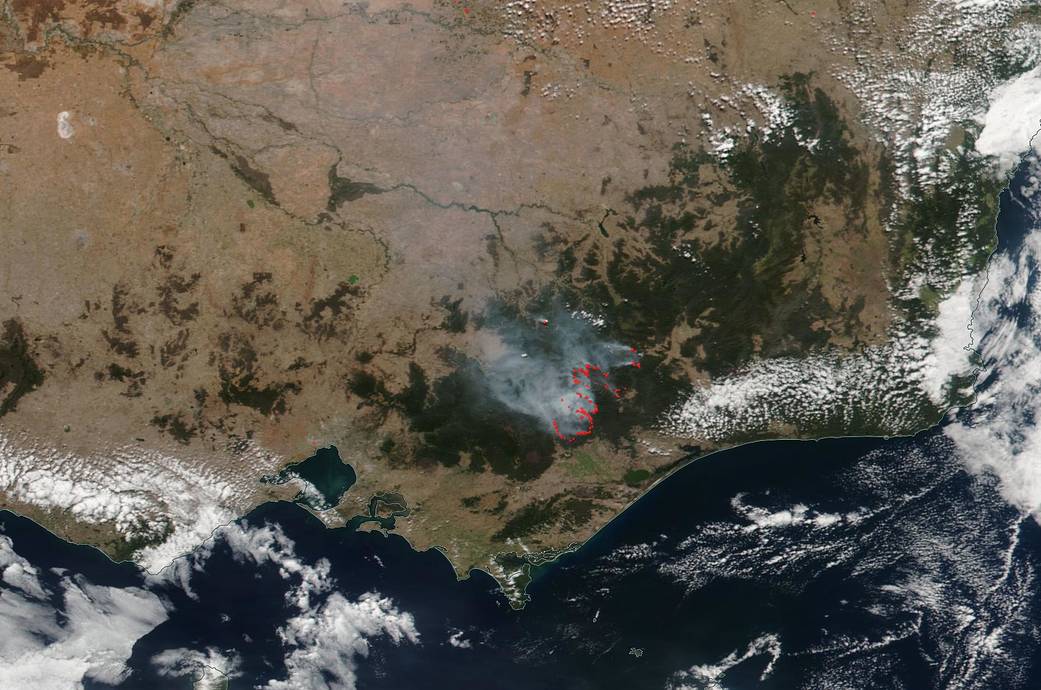
The area of Hume located to the northwest of the area creating the most smoke (the area in which the above bushfires are burning) is under an air advisory. The air quality in Hume, a suburb of Canberra, is designated as poor. In addition, this air advisory includes Seymour, Shepparton, Wangaratta, Bright and Mansfield. The air quality is deemed unhealthy for everyone.
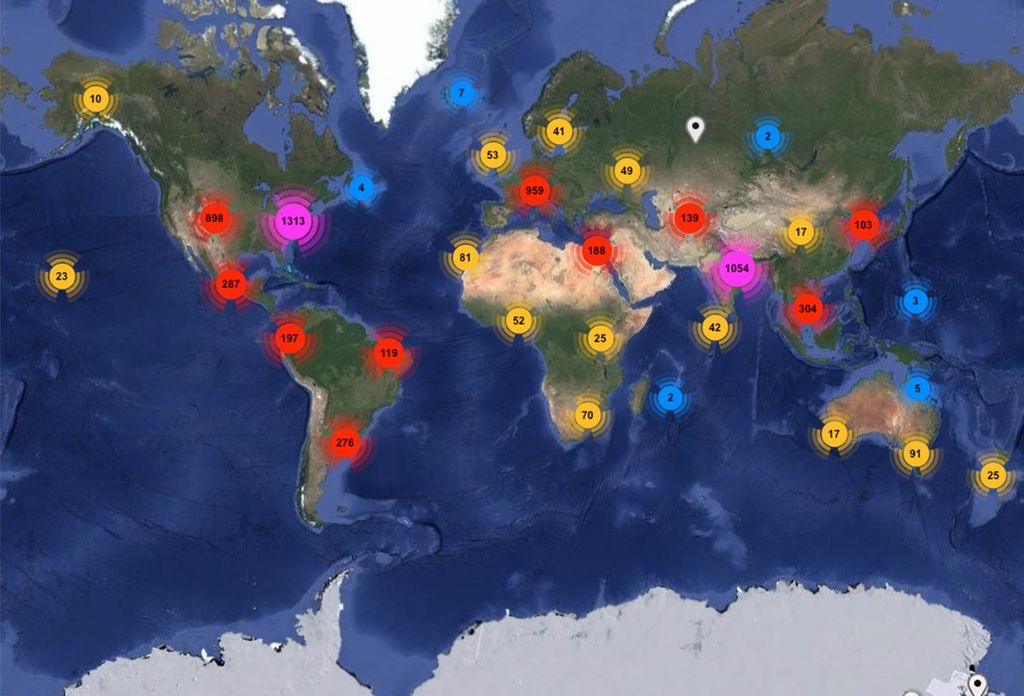
NASA’s Earth Observing System Data and Information System (EOSDIS) Worldview application provides the capability to interactively browse over 700 global, full-resolution satellite imagery layers and then download the underlying data. Many of the available imagery layers are updated within three hours of observation, essentially showing the entire Earth as it looks “right now.” This NOAA/NASA Suomi NPP satellite image was collected on March 15, 2019. Actively burning fires, detected by thermal bands, are shown as red points. Image Courtesy: NASA Worldview, Earth Observing System Data and Information System (EOSDIS). Caption: Lynn Jenner with information from the Vic Emergency website.