


![Request for Information – Potential [Placeholder for Prize]](https://assets.science.nasa.gov/dynamicimage/assets/science/missions/a-step/FFR_Earth_Background_20251120%20.png?w=1024)


For decades, NASA has used computer models to simulate the flow of air around aircraft in order to test designs and improve the performance of next-generation vehicles.
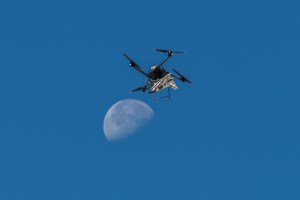
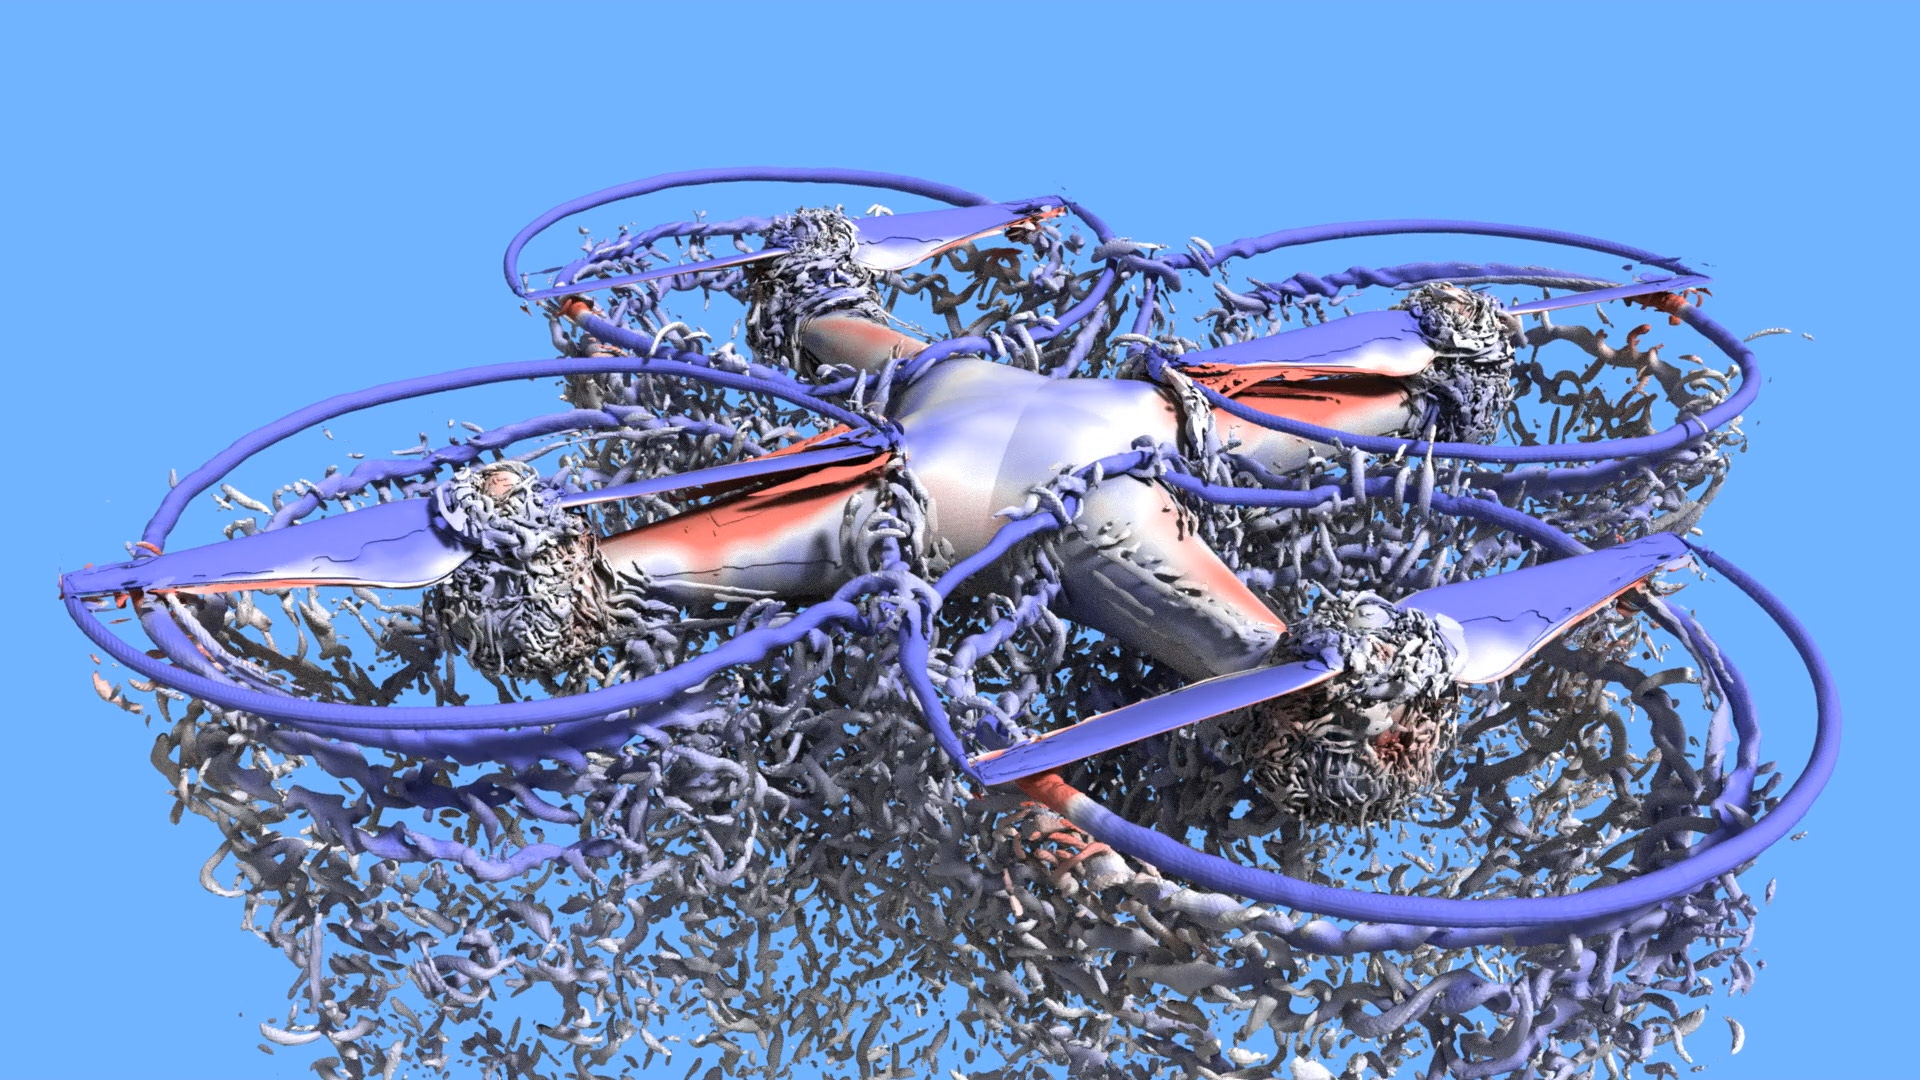
At NASA’s Ames Research Center in California’s Silicon Valley, researchers recently used this technique to explore the aerodynamics of a popular example of a small, battery-powered drone, a modified DJI Phantom 3 quadcopter.
The Phantom relies on four whirring rotors to generate enough thrust to lift it and any payload it’s carrying off the ground. Simulations revealed the complex motions of air due to interactions between the vehicle’s rotors and X-shaped frame during flight.
As an experiment, researchers added four more rotors to the vehicle to study the effect on the quadcopter’s performance. This configuration produced a nearly twofold increase in the amount of thrust.
The findings offer new insights into the design of autonomous, heavy-lift, multirotor vehicles for uses such as cargo transportation.
This research was presented at the 2017 American Institute of Aeronautics and Astronautics SciTech Forum in Grapevine, Texas, by Seokkwan Yoon of the NASA Advanced Supercomputing Division at Ames.
Author: Kayvon Sharghi
Credits: NASA Ames Research Center/NASA Advanced Supercomputing Division/Tim Sandstrom
Author: Kayvon Sharghi