


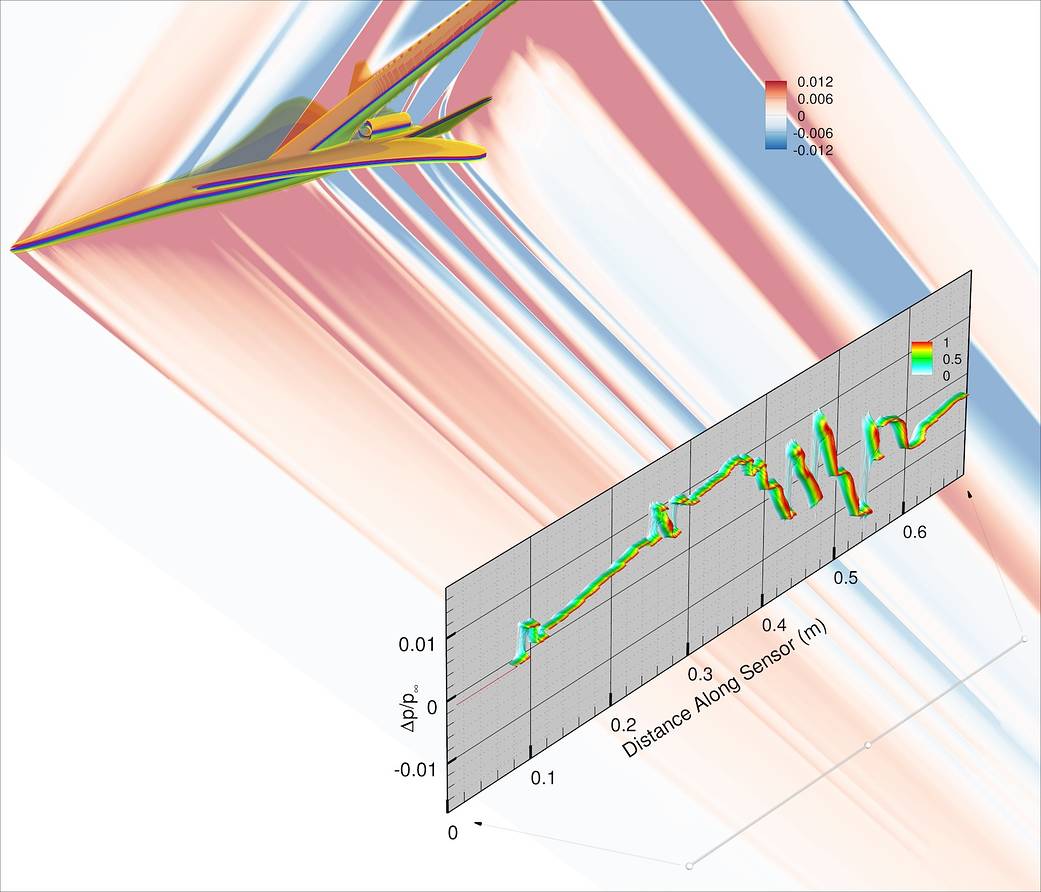
Low-Boom Wind Tunnel Model
Example uncertainty quantification for pressure signatures of the LM 1044 low-boom wind-tunnel model. Top Left: Wind-tunnel model with representation of model position uncertainty. Middle: Pressure coefficient contours on plane of symmetry showing shocks for model in nominal position (red means pressure above freestream, blue means below freestream). Bottom Right: Gray line indicates the location of the pressure signature, and the inset plot shows the probability density function of the pressure signature (red means very likely pressure values, white means least likely).
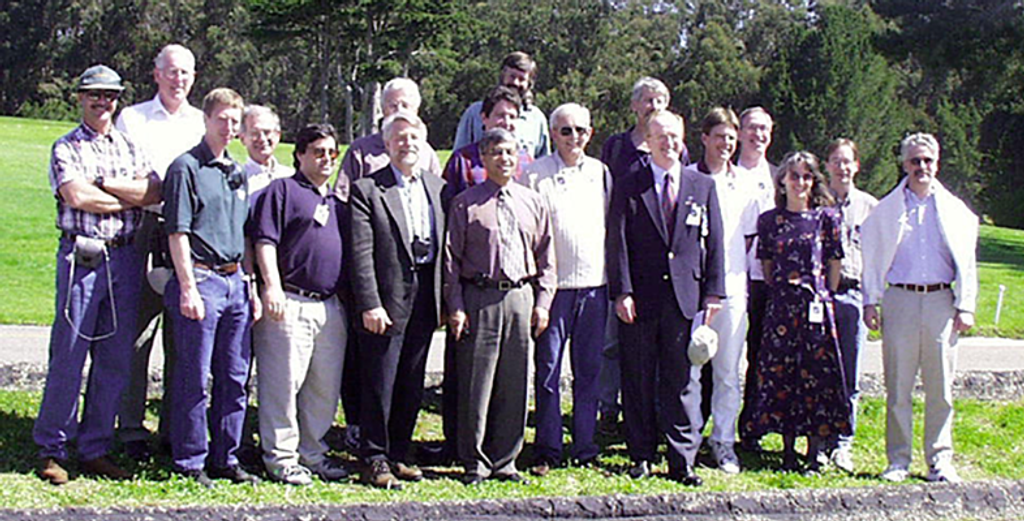
Image Credit: NASA/Ames, Marian Nemec