Food, fuel and shelter: vegetation is one of the most important requirements for human populations around the world. Satellites monitor how “green” different parts of the planet are and how that greenness changes over time. These observations help scientists understand the influence of natural cycles, such as drought and pest outbreaks, on vegetation, as well as human influences, such as land-clearing and global warming.
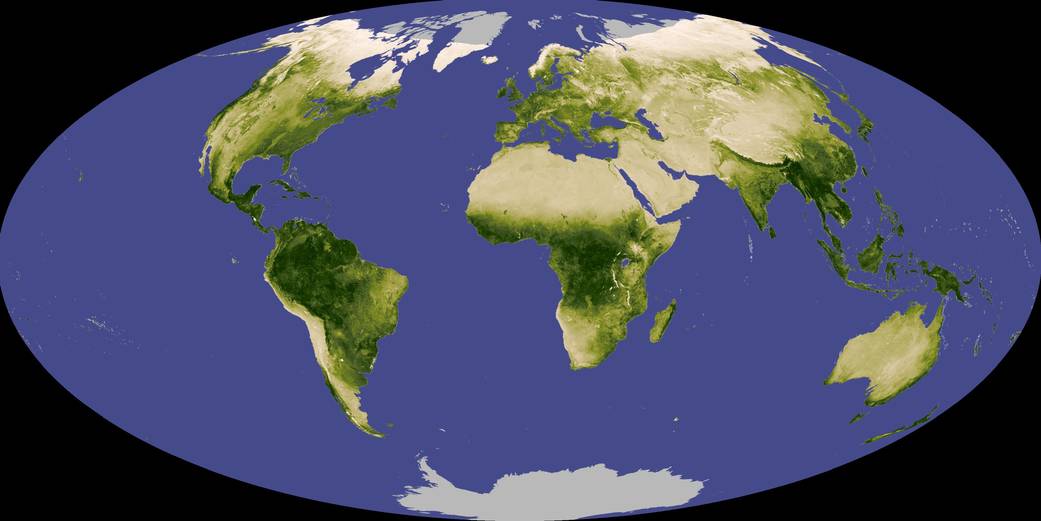
One method of mapping the difference in vegetation is a measurement known as the Normalized Difference Vegetation Index (NDVI). This image shows NDVI from Nov. 1, 2007, to Dec. 1, 2007, during autumn in the Northern Hemisphere. This monthly average is based on observations from the Moderate Resolution Imaging Spectroradiometer (MODIS) on NASA’s Terra satellite.
The greenness values on this global map range from -0.1 to 0.9, but have no actual unit. Instead, higher values (dark greens) show land areas with plenty of leafy green vegetation, such as the Amazon Rainforest. Lower values (beige to white) show areas with little or no vegetation, including sand seas and Arctic areas. Areas with moderate amounts of vegetation are pale green. Land areas with no data appear gray, and water appears blue.Image Credit: NASA

