


![Request for Information – Potential [Placeholder for Prize]](https://assets.science.nasa.gov/dynamicimage/assets/science/missions/a-step/FFR_Earth_Background_20251120%20.png?w=1024)


NOAA/NASA’s Suomi NPP satellite captured two recent images of the United States and both images show that the winds have changed yet again, blowing the smoke from western fires back to the East and crossing the continental U.S. Along with the smoke, small particles suspended in the air (aerosols) are also moved along the jet stream and bring the potential for hazardous air quality across the country.
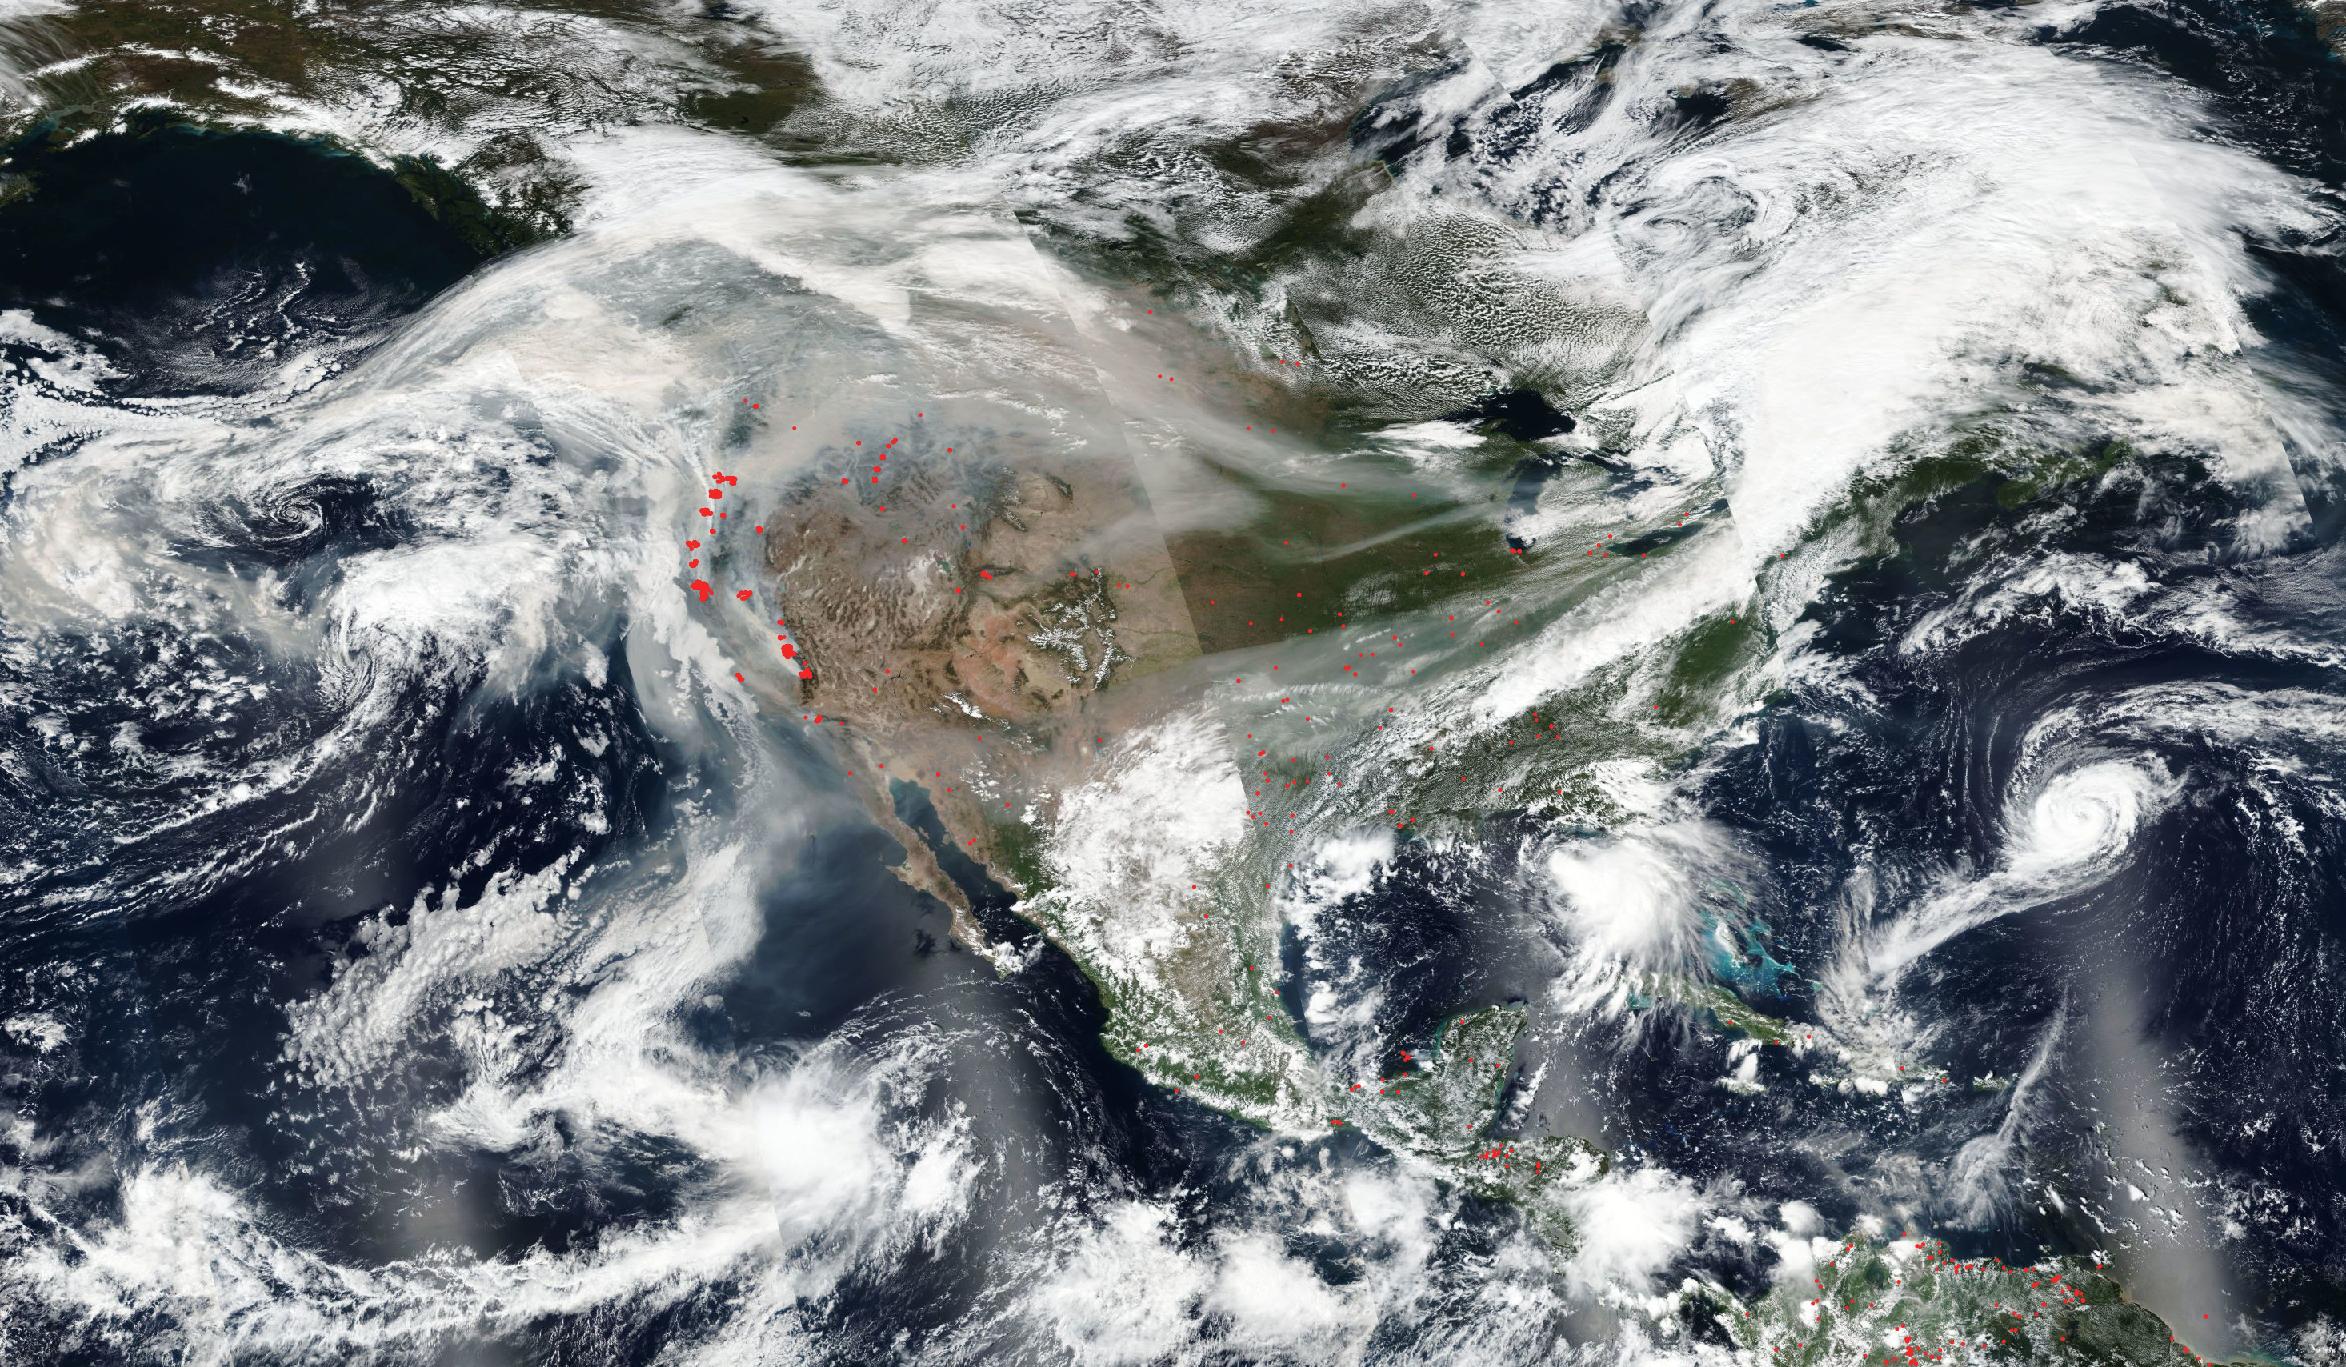
The image above shows the entire United States and the shroud of smoke that hangs over the majority of it. The image below shows the aerosols that accompany that smoke. Aerosols are a mixture of small particles and chemicals produced by the incomplete burning of carbon-containing materials such as trees, grasses, peat, brush, etc. All smoke contains carbon monoxide, carbon dioxide and particulate matter (PM or soot). The smaller the particles, the easier they are to be inhaled and absorbed into the lungs. From the EPA website: “The biggest health threat from smoke is from fine particles. These microscopic particles can penetrate deep into your lungs. They can cause a range of health problems, from burning eyes and a runny nose to aggravated chronic heart and lung diseases. Exposure to particle pollution is even linked to premature death.” But aerosols are also carried high in the atmosphere where it has little effect on the air quality for those in the Northeast. Those in the West, however are seeing extremely bad air quality since the smoke is at street level. According to Earth Observatory: “At the high altitude mapped in these images, the gas has little effect on the air we breathe; however, strong winds can carry it downwards to where it can significantly impact air quality. Carbon monoxide plays a role in both air pollution and climate change.”
A study was published in Journal of Geophysical Research: Atmospheres in June 2017 which discovered that particle pollution from wildfires, long known for containing soot and other fine particles known to be dangerous to human health, is much worse than previously thought. Naturally burning timber and brush from wildfires release dangerous particles into the air at a rate three times as high as levels known by the EPA, researchers found. The study also found wildfires spew methanol, benzene, ozone and other noxious chemicals. Residents that smell smoke or see haze in the air should take precautions against breathing too much of it and stay tuned to local air quality information. (Journal reference: https://agupubs.onlinelibrary.wiley.com/doi/full/10.1002/2016JD026315)
NASA’s Earth Observing System Data and Information System (EOSDIS) Worldview application provides the capability to interactively browse over 700 global, full-resolution satellite imagery layers and then download the underlying data. Many of the available imagery layers are updated within three hours of observation, essentially showing the entire Earth as it looks “right now.” Actively burning fires, detected by thermal bands, are shown as red points. Image Courtesy: NASA Worldview, Earth Observing System Data and Information System (EOSDIS). Caption: Lynn Jenner with information from the EPA and a Journal of Geophysical Research: Atmospheres in June 2017.