


Satellite Animation Shows the End of Maria and Lee
An animation of GOES East satellite imagery from Sept. 22 to Oct. 2 shows the demise of two former Atlantic Ocean hurricanes: Maria and Lee. On Monday, Oct. 2, the remnants of Maria were affecting the United Kingdom.
Credits: NASA/NOAA GOES Project
An animation of infrared and visible imagery from NOAA’s GOES Satellite shows the movement of former Hurricanes Maria and Lee and how they degenerated by Oct. 1 in the North Atlantic Ocean.
Lee appeared as a small hurricane in the Central Atlantic, while Maria moved up the U.S. East Coast.
On Oct. 1, a cold front extended from the remnants of Maria through 34 degrees north latitude and 50 degrees west longitude.
The United Kingdom’s Meteorological Service noted on Oct. 2 ” Low pressure is dominating our weather as we head into October and the UK will experience some heavy rain and strong to gale force winds. This unsettled weather is being influenced by what’s left of tropical systems Lee and Maria in the Atlantic.”
NOAA manages the GOES series of satellites and the NASA/NOAA GOES Project at NASA’s Goddard Space Flight Center in Greenbelt, Maryland used the data to create the animation.
For more information about the U.K. forecast for Oct. 2, visit: https://www.metoffice.gov.uk/news/releases/2017/wet-and-windy-this-weekend
Rob Gutro
NASA’s Goddard Space Flight Center
Sep. 29, 2017 – (Update #2) NASA Infrared Imagery Shows Wind Shear Affecting Tropical Storm Maria
Tropical Storm Maria is now caught up in the Westerlies and is being affected by wind shear that is elongating the storm. Infrared imagery from NASA’s Aqua satellite revealed that Maria’s strongest storms were east of the tropical cyclone’s center because of westerly wind shear.
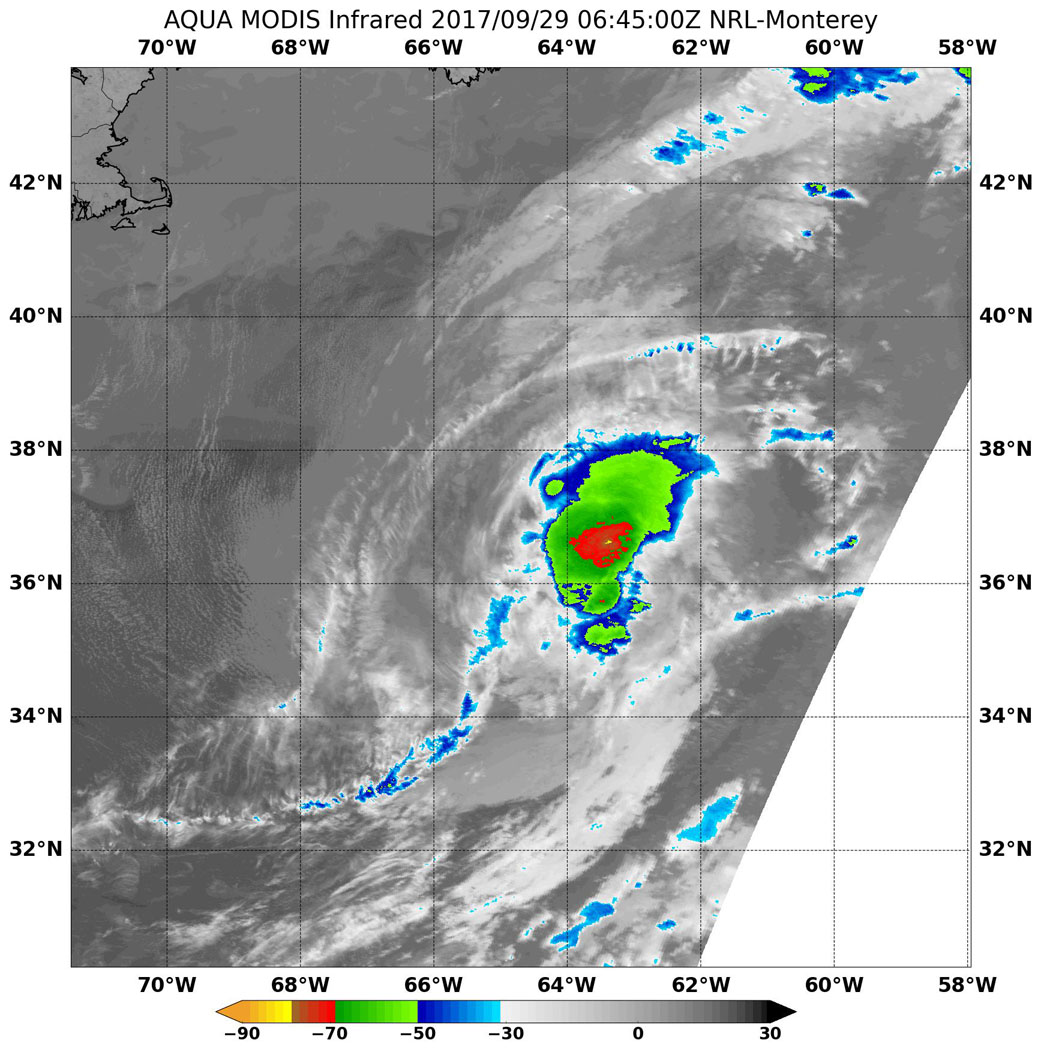
The prevailing Westerlies are the winds in the middle latitudes between 35 and 65 degrees latitude. They blow from the west to the east and steer storms in that general direction. Maria is now embedded in those winds and they are guiding the tropical storm across the Atlantic Ocean.
On Sept. 29 at 02:45 UTC (6:45 a.m. EST) the Moderate Resolution Imaging Spectroradiometer or MODIS instrument aboard NASA’s Terra satellite measured temperatures of Maria’s cloud tops. MODIS data was false-colored at the U.S. Naval Research Laboratory in Washington, D.C. and showed powerful thunderstorms with cloud top temperatures as cold as minus 70 degrees Fahrenheit (minus 56.6 degrees Celsius) east of the center.
National Hurricane Center forecaster Lixion Avila noted “satellite images indicate that cold air is already beginning to entrain into the circulation of the tropical cyclone. Most of deep convection is limited to a curved band to the east of the center.”
At 11 a.m. EDT (1500 UTC) on Sept.29 the center of Tropical Storm Maria was located near 37.5 degrees north latitude and 60.1 degrees west longitude. That’s about 525 miles (840 km) south-southeast of Halifax, Nova Scotia, Canada.
Maria was moving toward the east-northeast near 31 mph (50 kph), and this motion is expected to continue during the weekend. Maximum sustained winds are near 60 mph (95 kph) with higher gusts. The estimated minimum central pressure is 988 millibars.
Swells generated by Maria are affecting much of the east coast of the United States, Atlantic Canada, and Bermuda. These swells are likely to cause life-threatening surf and rip current conditions.
The NHC said that Maria should become post-tropical late on Saturday, Sept. 30 and then dissipate or be absorbed by a larger cyclone on Oct. 1 or 2. Maria is already embedded in the mid-latitude westerlies (winds).
For updated forecasts on Maria, visit: www.nhc.noaa.gov
Rob Gutro
NASA’s Goddard Space Flight Center
Sep. 29, 2017 – (Update #1) NASA Damage Map Aids Puerto Rico Hurricane Response
A NASA-produced map showing areas of eastern Puerto Rico that were likely damaged by Hurricane Maria has been provided to responding agencies, including the Federal Emergency Management Agency (FEMA). The hurricane, a Category 4 storm at landfall on Puerto Rico on Sept. 20, caused widespread damage and numerous casualties on the Caribbean island, an unincorporated U.S. territory with a population of about 3.4 million.
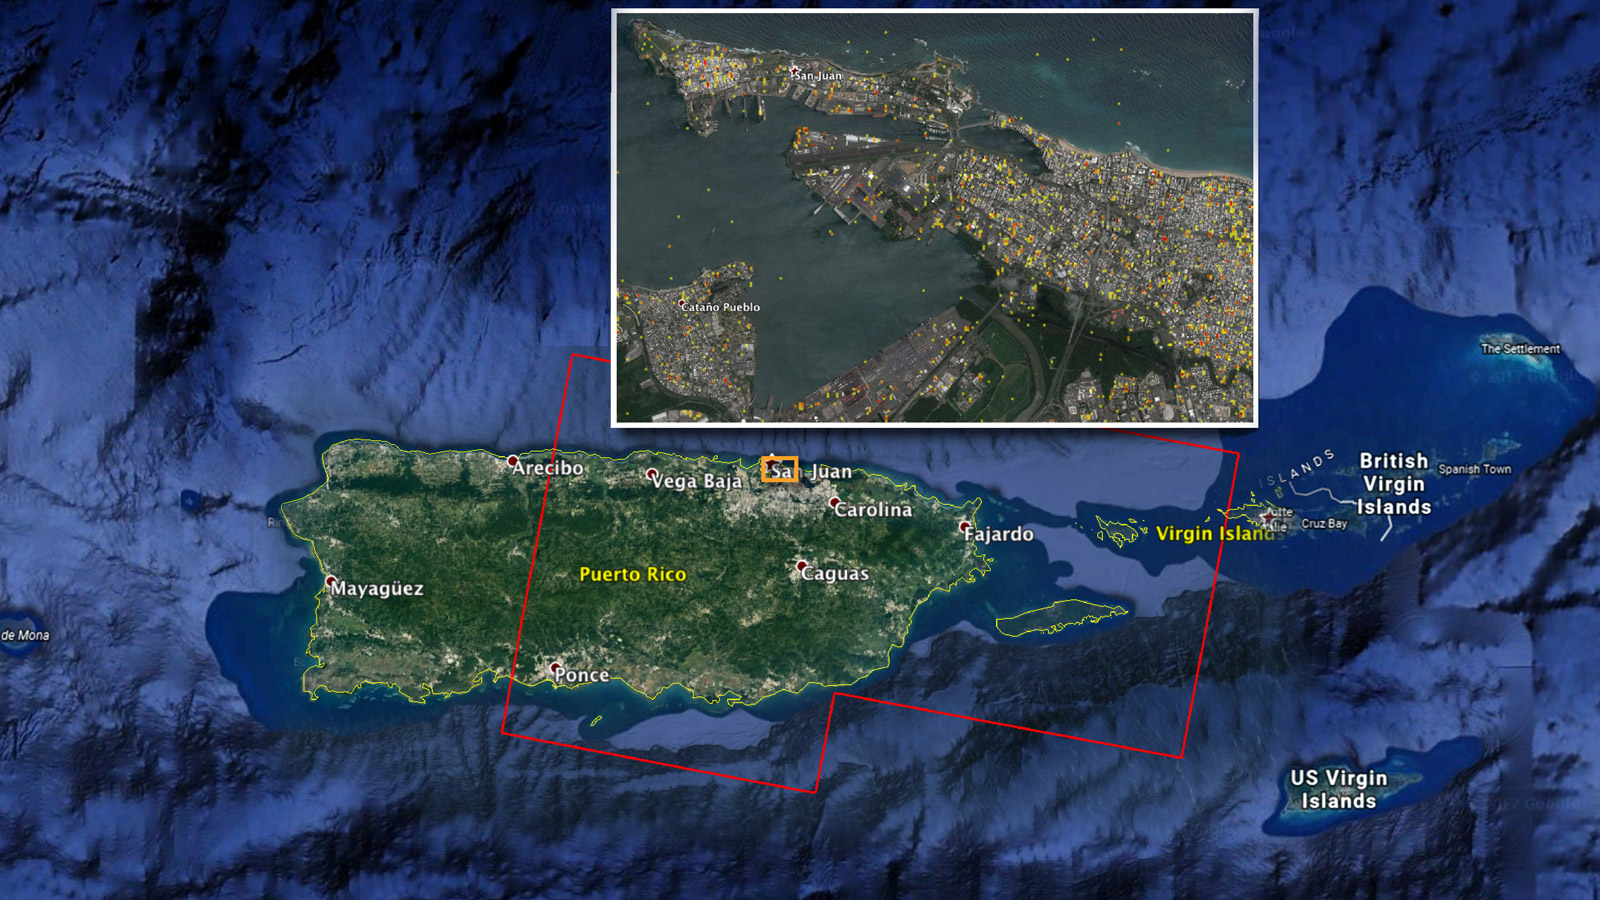
To assist in disaster response efforts, scientists at NASA’s Jet Propulsion Laboratory and Caltech, both in Pasadena, California, obtained and used before-and-after interferometric synthetic aperture radar (InSAR) satellite imagery of areas of Eastern Puerto Rico to identify the areas that are likely damaged. The imagery — acquired before the storm on March 25, 2017 and again one day after landfall on Sept. 21, 2017 — is from the radar instruments on the Copernicus Sentinel-1 satellites operated by the European Space Agency. The resulting Damage Proxy Map shown here may be viewed and downloaded in full resolution at: https://www.jpl.nasa.gov/spaceimages/details.php?id=pia21964
The full map data files may be downloaded at: http://aria-share.jpl.nasa.gov/events/201709-Hurricane_Maria/
The views indicate the extent of likely damage caused by the hurricane, based on changes to the ground surface detected by radar. The color variations from yellow to red indicate increasingly more significant ground and building surface change. The map is used as guidance to identify potentially damaged areas and may be less reliable over vegetated and flooded areas. The map covers the area within the large red polygon in the figure, which is 105 by 60 miles (169 by 96 kilometers) in extent. The inset, denoted by the orange rectangle, highlights damage in and around the capital city of San Juan. Each pixel in the map measures about 98 feet (30 meters) across.
NASA delivered the map to responding agencies, including FEMA, on Sept. 22, 2017. FEMA combined the map with building infrastructure data to estimate a damage density map, which was sent to its Urban Search and Rescue teams in the field in Puerto Rico.
The radar data were processed by the Advanced Rapid Imaging and Analysis (ARIA) team at JPL and Caltech. ARIA is a NASA-funded project that is building an automated system for demonstrating the ability to rapidly and reliably provide GPS and radar satellite data to support local, national and international hazard-monitoring and response communities. InSAR can “see” through clouds and is sensitive to changes in the roughness of the ground or building surfaces.
Using space-based radar imagery of disasters, ARIA data products can aid responders in making rapid assessments of the geographic region affected by a disaster, as well as detailed imaging of locations where damage occurred.
Preliminary validation of the Puerto Rico Hurricane Maria Damage Proxy Map was done by comparing it to anecdotal reports of damage. Sentinel-1 data were accessed through the Copernicus Open Access Hub. The image contains modified Copernicus Sentinel data (2017), processed by ESA and analyzed by the NASA-JPL/Caltech ARIA team.
The ARIA team expects to produce another Damage Proxy Map for western Puerto Rico this week, following acquisition of additional Copernicus Sentinel satellite data.
This analysis was supported by the NASA Disasters Program, part of the Earth Science Division in the Science Mission Directorate. The program works with international, regional and local disaster response agencies to produce critical information products using global environmental data from NASA’s fleet of Earth science satellites and other airborne and space-based assets, including data from other international space agencies. Dedicated teams of Earth-observation disaster specialists at NASA centers mobilize to respond in real-time to a wide range of natural hazards and human-produced events.
For more information about ARIA, visit: https://aria.jpl.nasa.gov
Alan Buis
NASA Jet Propulsion Lab
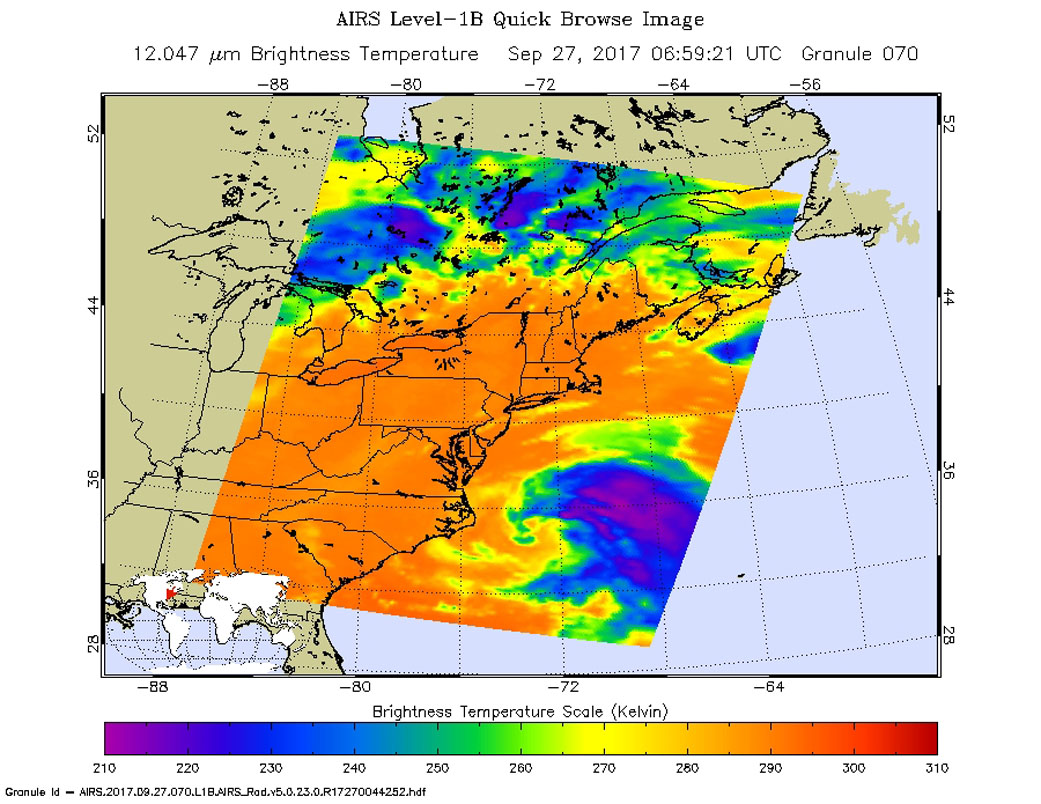
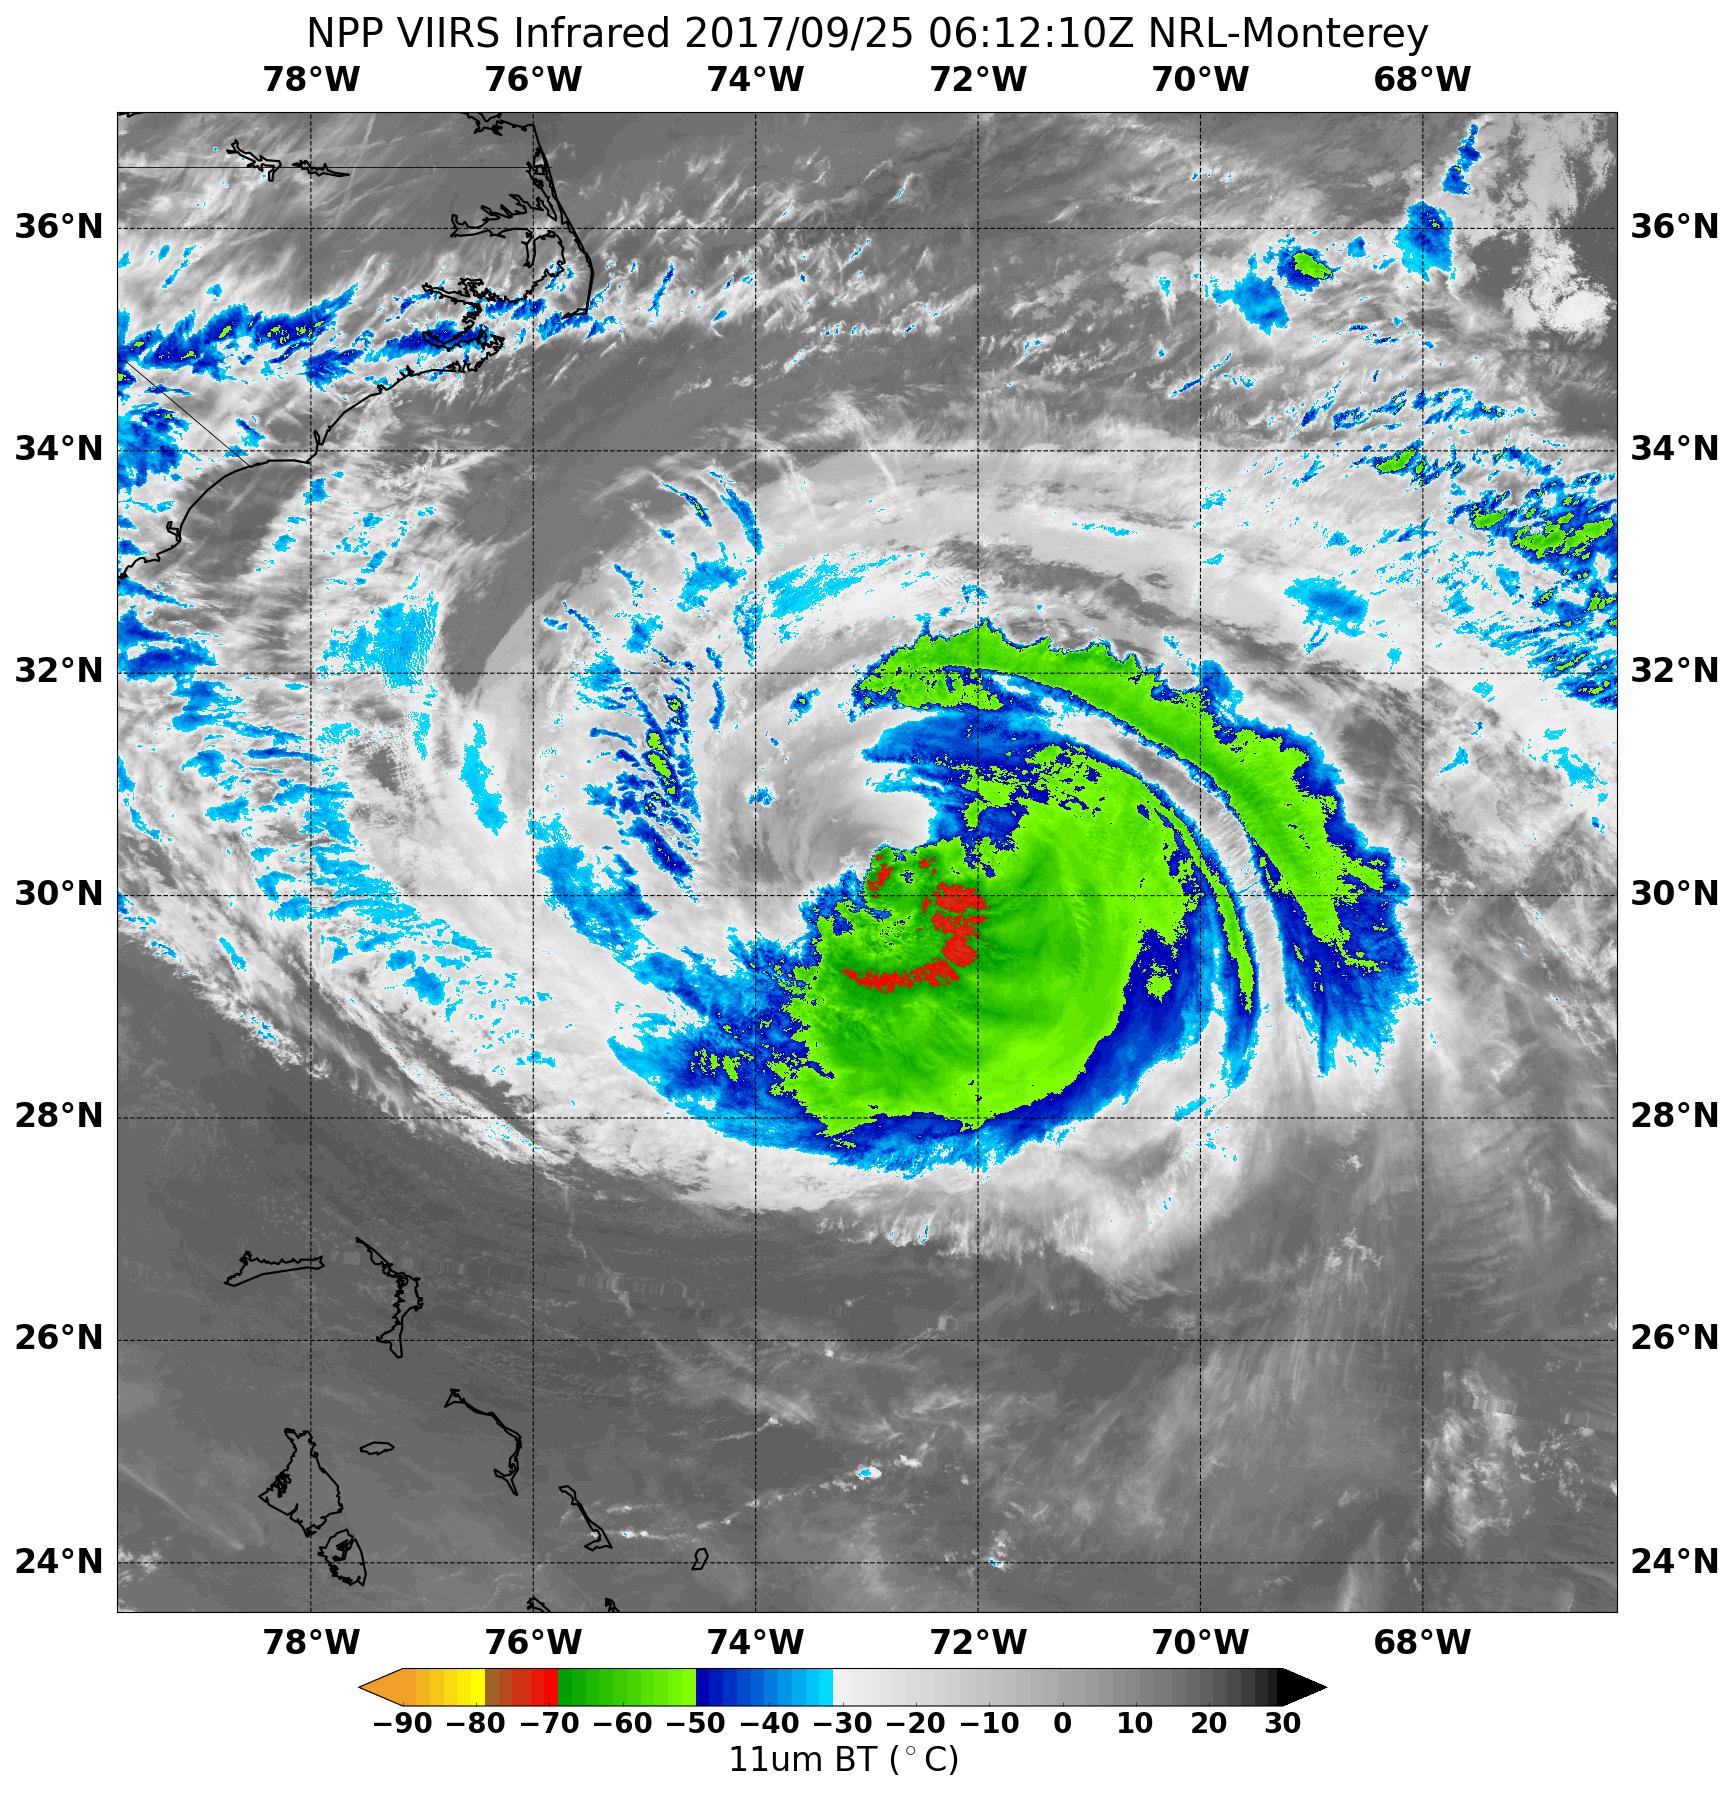
Sep. 28, 2017 – (Update #2) NASA Sees Maria Weaken to a Tropical Storm
NASA and NOAA satellites provided information and imagery to forecasters that showed Hurricane Maria weakened to a tropical storm on Sept. 28.
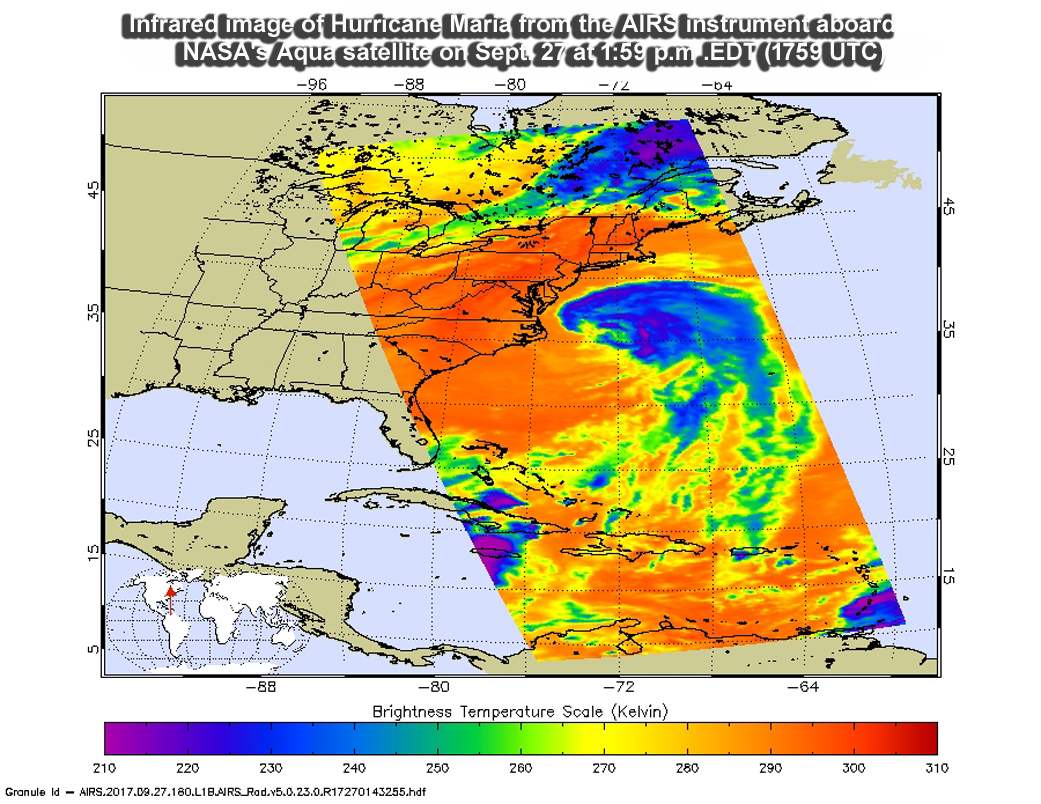
NASA’s Aqua satellite passed over Maria on Sept. 27 at 1:59 p.m. EDT (1759 UTC) when it was still a hurricane and analyzed the storm in infrared light. Infrared light provides temperature data and that’s important when trying to understand how strong storms can be. The higher the cloud tops, the colder and the stronger they are.
AIRS data showed coldest cloud top temperatures in thunderstorms mostly northeast of Maria’s center. Those temperatures were as cold as minus 63 degrees Fahrenheit (minus 53 degrees Celsius). Storms with cloud top temperatures that cold have the capability to produce heavy rainfall.
Maria continues to show little signs of strength, despite having weakened to a tropical storm.
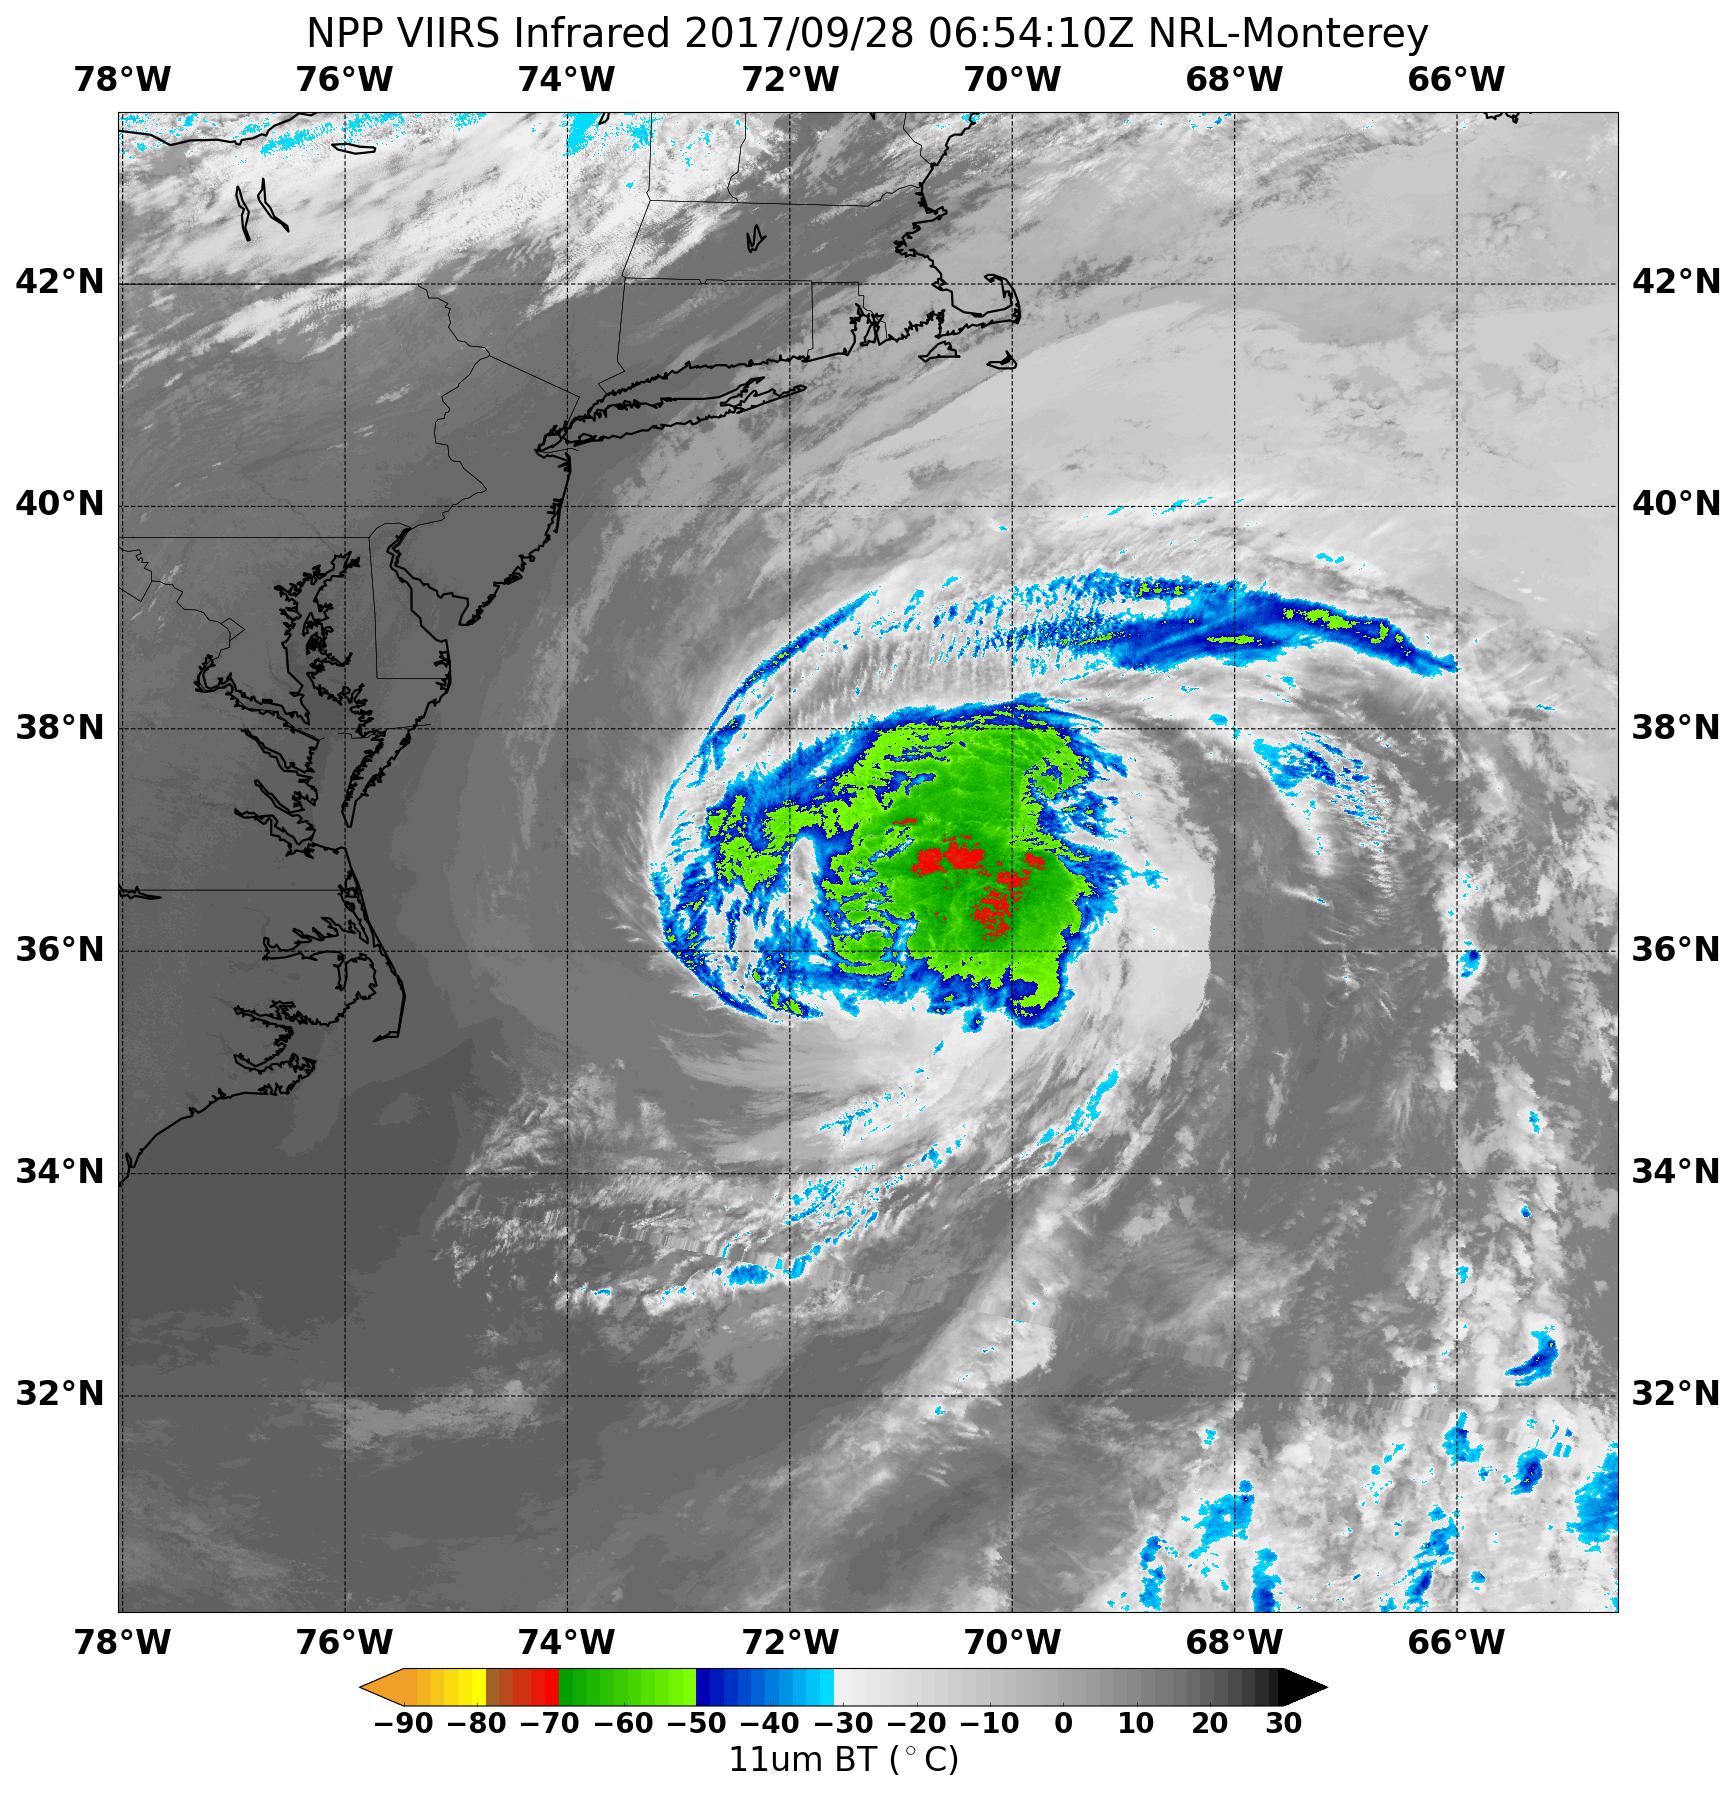
Infrared imagery on Sept. 28 at 2:54 a.m. EDT (0654) from the VIIRS instrument aboard NASA-NOAA’s Suomi NPP satellite showed a burst of strong convection containing cloud top temperatures colder than minus degrees 70 Celsius (minus 94 degrees Fahrenheit) had developed just east of the center.
At NASA’s Goddard Space Flight Center in Greenbelt, Maryland infrared and visible imagery from NOAA’s GOES East satellite was put together in an animation covering two days to show Maria’s progression along the U.S. East Coast and its weakening to a tropical storm. The animation used imagery from Sept. 26 at 10:15 a.m. EDT (1415 UTC) to Sept. 28 ending at 10:30 a.m. EDT (1430 UTC). During the animation, around 5 a.m. (0900) on Sept. 28 Maria had once again weakened into a tropical storm.
Credits: NASA-NOAA GOES Project
By 11 a.m. EDT (1500 UTC) on Sept. 28, Maria was still over 350 miles off-shore from the Mid-Atlantic States. As a result, there were no coastal watches or warnings in effect.
The center of Tropical Storm Maria was located near 36.8 degrees north latitude and 69.3 degrees west longitude. That’s about 365 miles (585 km) east-northeast of Cape Hatteras, North Carolina. Maria was moving toward the east near 13 mph (20 kph), and the storm is expected to accelerate eastward through tonight.
Maximum sustained winds are near 70 mph (110 km/h) with higher gusts. Some slight weakening is possible during the next 48 hours. The estimated minimum central pressure is 982 millibars.
The National Hurricane Center expects a turn back toward the east-northeast with an additional increase in forward speed on Friday, Sept. 29 as the storm gets pushed by an approaching elongated area of low pressure. On the forecast track, Maria will continue to move away from the U.S. east coast and pass well to the south of Atlantic Canada during the next couple of days.
NHC cautions that swells generated by Maria are affecting much of the east coast of the United States, Atlantic Canada, and Bermuda. These swells are likely to cause life-threatening surf and rip current conditions.
For updated forecasts on Maria, visit: www.nhc.noaa.gov
Rob Gutro
NASA’s Goddard Space Flight Center
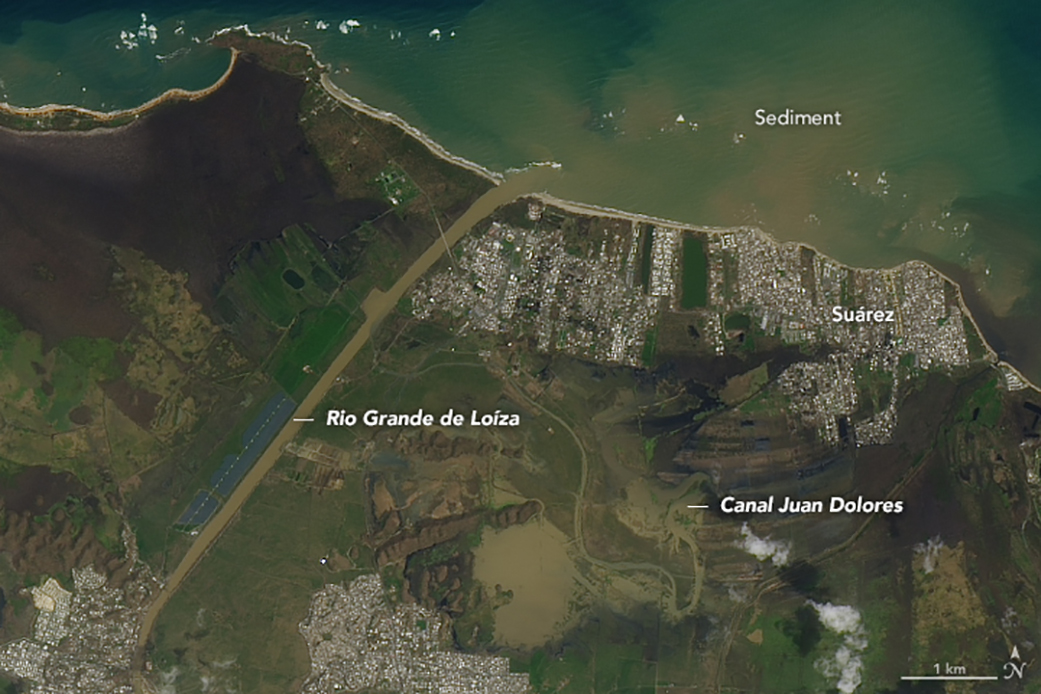
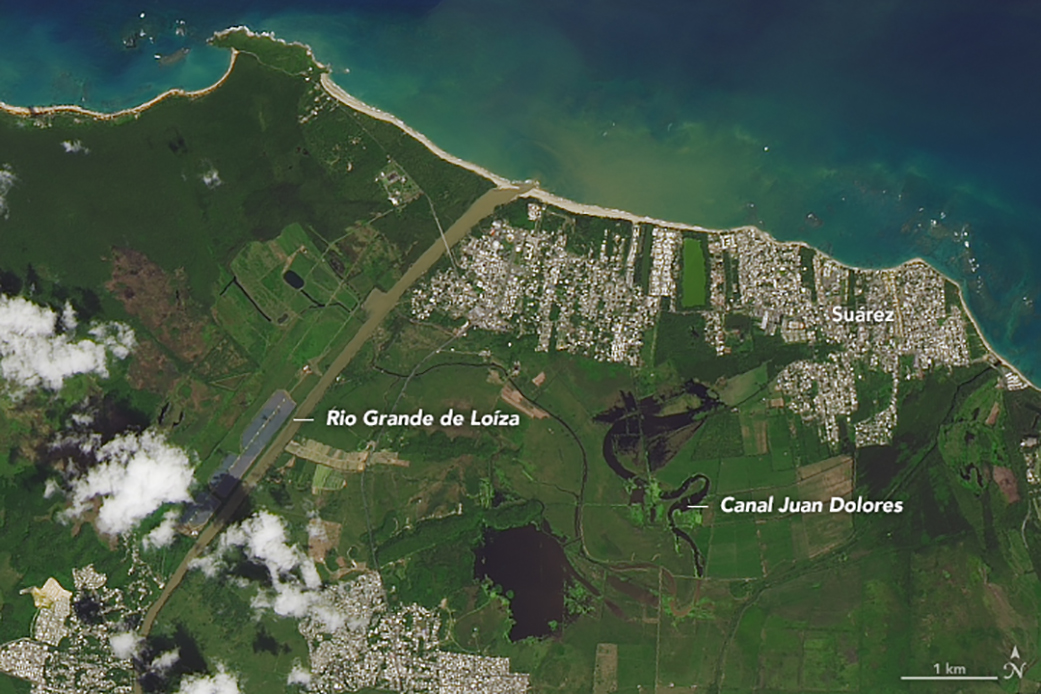
Sep. 28, 2017 – (Update #1) Puerto Rico Landscape Ravaged by Hurricane Maria
Hurricane Maria tore across Puerto Rico on September 20, 2017, ravaging both urban and rural areas with category 4 winds and intense rainfall for several days. Most of the electric power grid and telecommunications network was knocked offline; towns both inland and at the coast were swamped with floodwaters and storm surges; and the lush green landscape turned brown from damaged vegetation and mud and debris deposits.
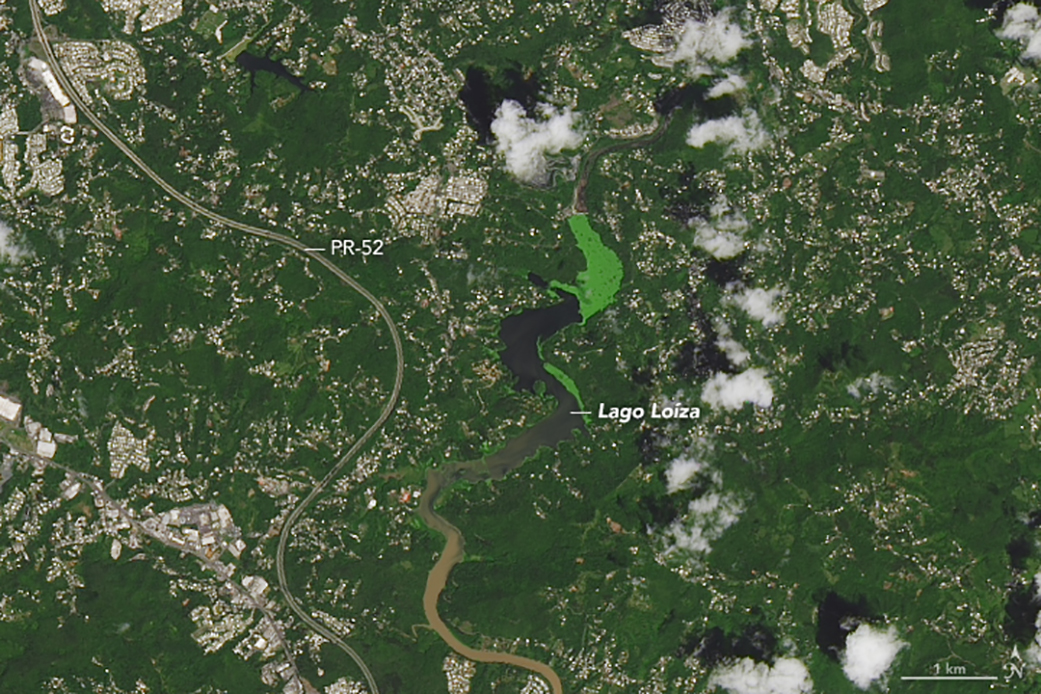
On September 26, 2017, the Operational Land Imager (OLI) on the Landsat 8 satellite captured some of the first natural-color satellite images of Puerto Rico after Hurricane Maria. Cloud cover is common in the tropics and has been particularly bad in the days since the storm, so researchers have been unable to see much from orbit.
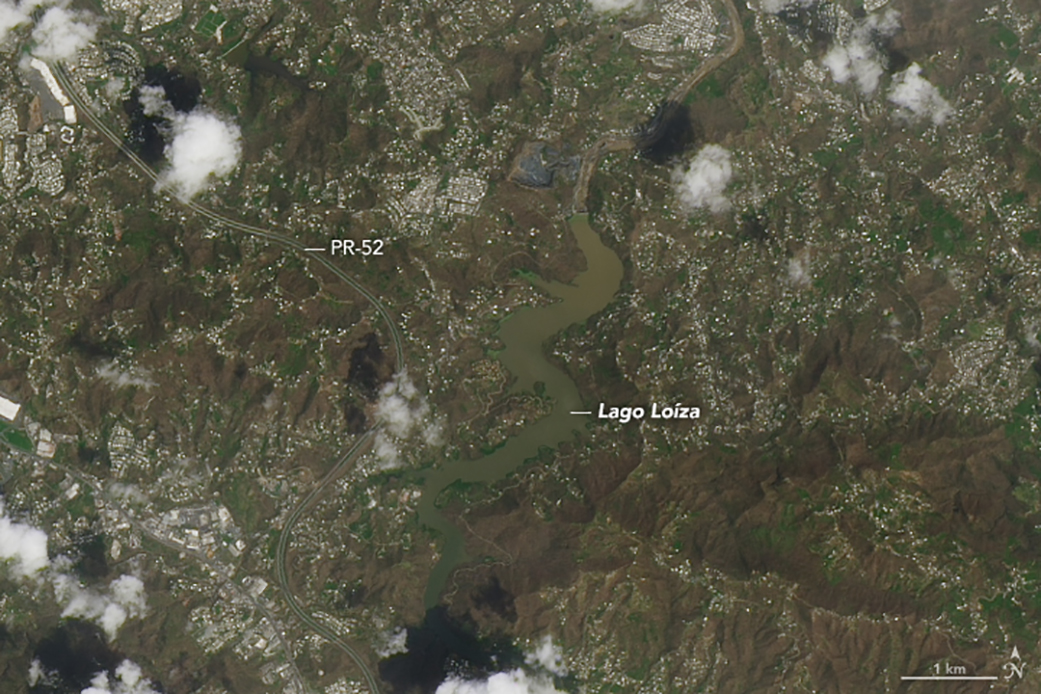
The images below show the Rio Grande de Loíza, the island’s largest river by volume, where it meets the Atlantic Ocean several miles east of San Juan and west of Suárez. In each pair the second image shows the same area one year ago (September 23, 2016) so as to provide a proper seasonal comparison. (Note: the green color of the lake in 2016 could be an algae bloom or some other form of water vegetation.)
The images below show an interior portion of the island around the Lago Loíza reservoir, south of San Juan and north of Caguas.
NASA’s Disasters Program has delivered to the Federal Emergency Management Agency (FEMA) a map of areas in eastern Puerto Rico that have likely been damaged as the result of the landfall of Hurricane Maria. The “damage proxy map” was created by the Advanced Rapid Imaging and Analysis team (Jet Propulsion Laboratory) and derived from synthetic aperture radar images from the European Space Agency’s Copernicus Sentinel-1A and Sentinel-1B satellites.
The National Oceanic and Atmospheric Administration is making aerial surveys of the U.S. states and territories affected by hurricanes Harvey, Irma, and Maria. Click here to see photos as they become available.
Related Reading and Resources
- NASA (2017) NASA Earth Science Disasters Program. Accessed September 27, 2017.
- NOAA (2017) Assessing Maria’s Destruction from the Air. Accessed September 27, 2017.
- FEMA (2017) Hurricane Maria. Accessed September 27, 2017.
- CNN (2017, September 26) ‘Apocalyptic’ devastation in Puerto Rico, and little help in sight. Accessed September 27, 2017.
- Good Morning America, via Yahoo News (2017, September 25) Chopper ride over Puerto Rico shows ‘unprecedented disaster’ after Maria. Accessed September 27, 2017.
- Mashable (2017, September 26) Photos reveal dire situation unfolding in Puerto Rico after Hurricane Maria. Accessed September 27, 2017.
NASA Earth Observatory image by Joshua Stevens, using Landsat data from the U.S. Geological Survey.
Instrument(s):
- Landsat 8 – OLI
- Landsat 8 – TIRS
Mike Carlowicz
NASA Earth Observatory
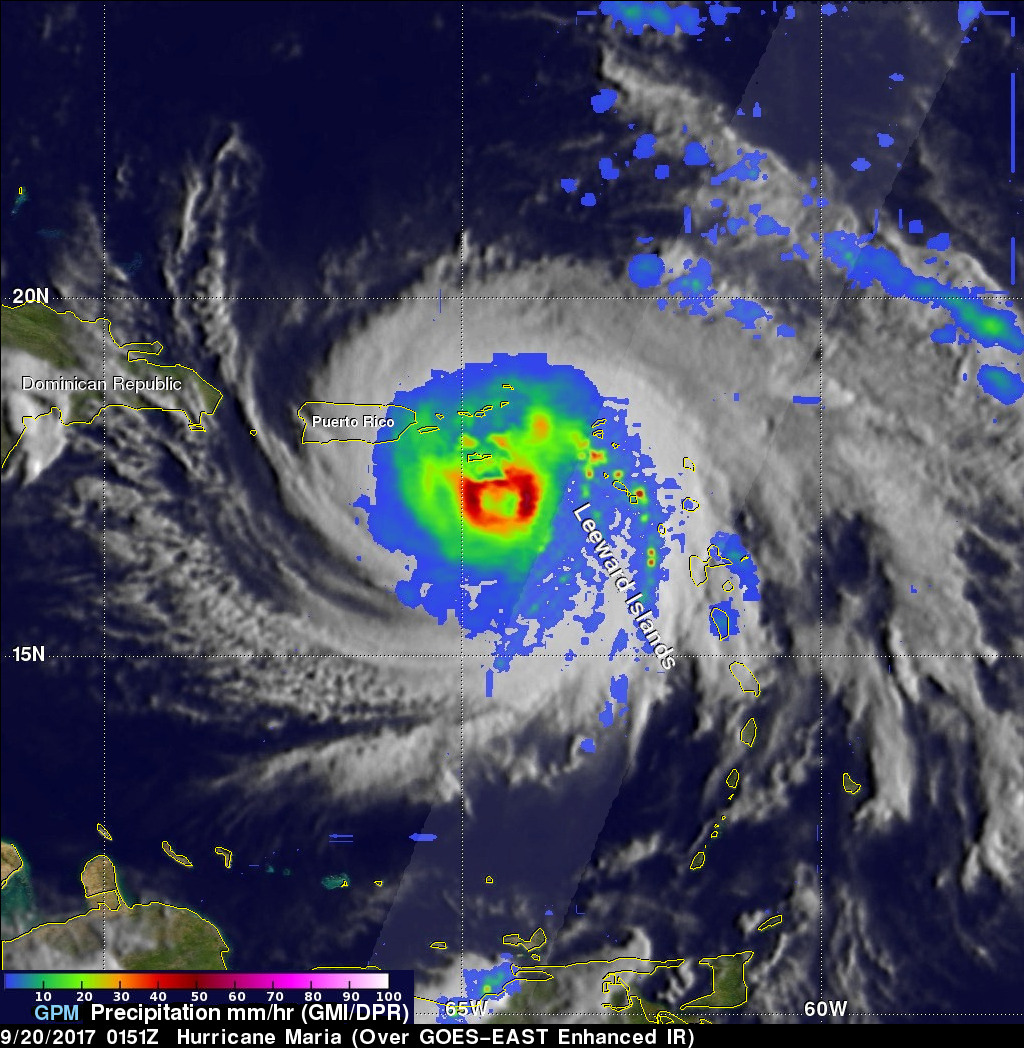
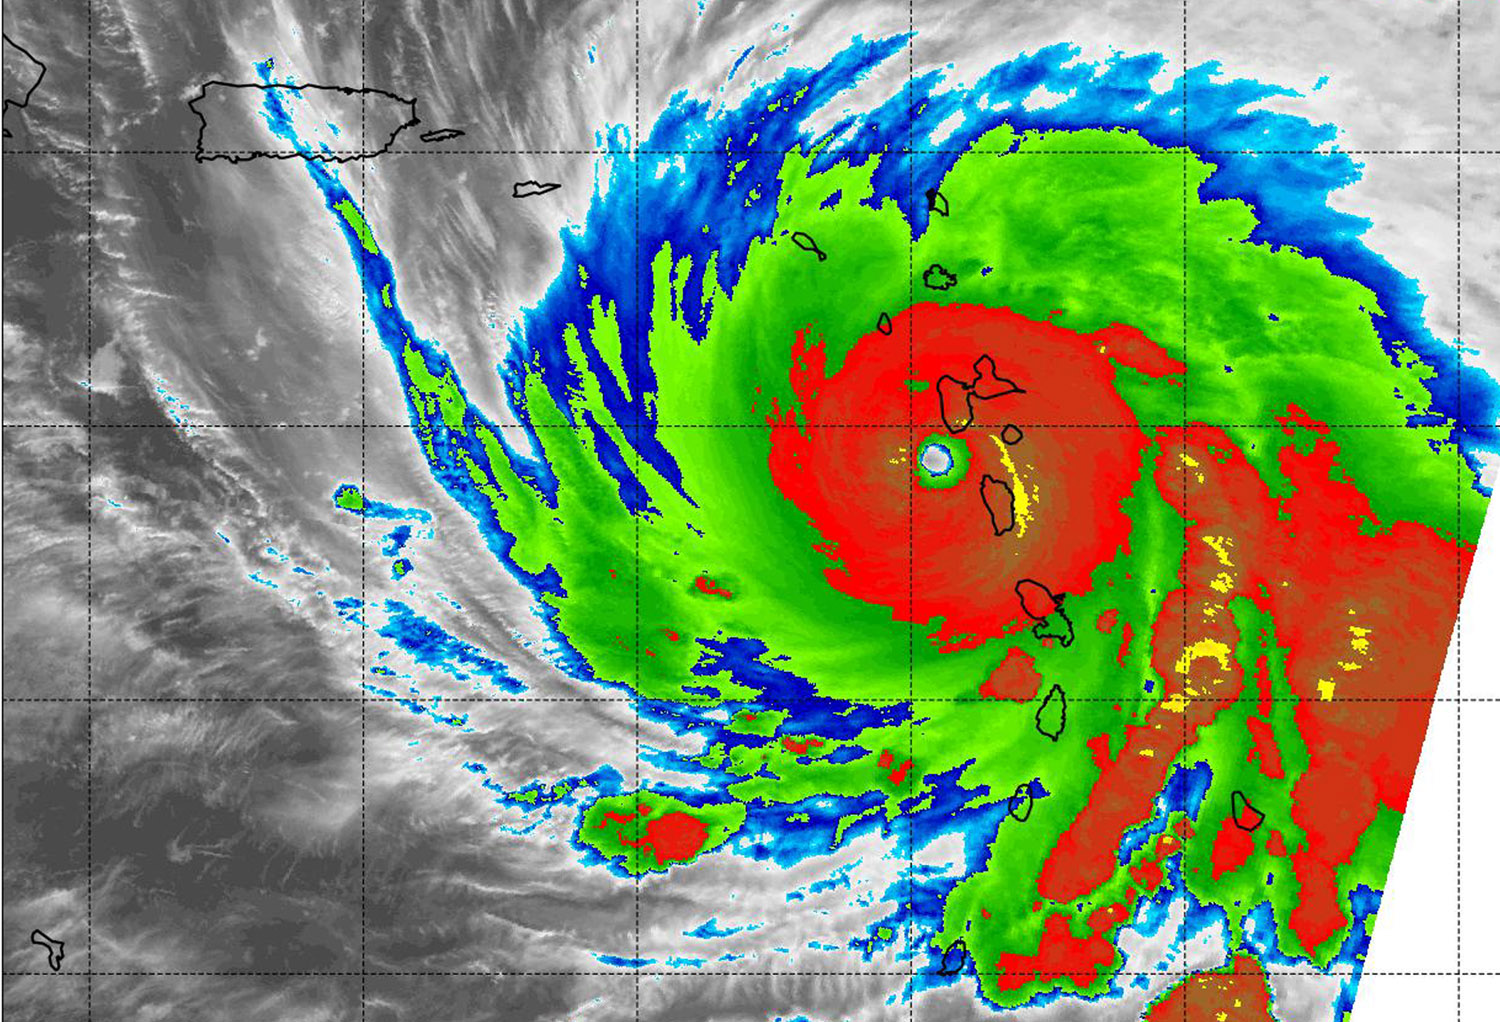
Sep. 27, 2017 – NASA Satellites Peer into a Lop-sided Hurricane Maria
NASA’s Aqua satellite and Global Precipitation Measurement mission, or GPM, satellites have been peering into what appears to be a somewhat lop-sided Hurricane Maria. The storm appears asymmetric because vertical wind shear is pushing clouds and showers to the eastern side of the storm.
Credits: NASA/JAXA, Hal Pierce
On Sept. 27, NHC forecaster Daniel Brown noted, “Deep convection and banding has increased over the eastern and northeastern portion of the large circulation of Maria since yesterday.”

The GPM core observatory satellite flew over Maria on Sept. 25, 2017, at 9:28 p.m. EDT (Sept. 26, 2017, at 0128 UTC). This informative GPM pass showed that the western side of the hurricane was drier and contained much less precipitation than the eastern side. GPM’s Dual-Frequency Precipitation Radar (DPR) scanned directly through the center of Maria’s eye and showed that there were only light to moderate rain showers around the hurricane’s center. DPR found a few convective storms within Maria dropping rain at a rate of less than 2 inches (51 mm) per hour.
This close examination of Maria’s 3-D rainfall structure was made possible by using GPM’s radar data (DPR Ku Band) data at NASA’s Goddard Space Flight Center in Greenbelt, Maryland. This 3-D cross-section view showed the locations of downpours within bands of convective storms east of the hurricanes center. A few of these storms were revealed to be returning strong echoes to GPM’s radar. GPM is a joint mission between NASA and the Japan Aerospace Exploration Agency (JAXA).
On Sept. 27 at 2:59 a.m. EDT (0659 UTC) infrared data of Tropical Storm Maria was taken from the AIRS instrument aboard NASA’s Aqua satellite. The AIRS data showed coldest cloud top temperatures northeast of Maria’s center, where the strongest storms were located. The AIRS data showed that the coldest cloud tops in that area were colder than minus 63 degrees Fahrenheit (minus 53 degrees Celsius).
Watches and Warnings on Sept. 27, 2017
A Storm Surge Warning is in effect for Ocracoke Inlet to Cape Hatteras, North Carolina. A Tropical Storm Warning is in effect from Ocracoke Inlet to the North Carolina/Virginia Border and the Albemarle and Pamlico Sounds. A Storm Surge Watch is in effect from north of Cape Hatteras to Duck, North Carolina.
Maria’s Location and Strength on Sept. 27, 2017
At 11 a.m. EDT (1500 UTC), the center of Hurricane Maria was located near 35.6 degrees north latitude and 72.6 degrees west longitude. Maria is moving toward the north-northeast near 6 mph (9 kph), and this motion is expected to continue today. Maria is forecast to accelerate east-northeastward on Thursday and Thursday night. On the forecast track, Maria will begin to move away from the coast of North Carolina later today and tonight.
Reports from an Air Force Reserve reconnaissance aircraft indicate that the maximum sustained winds are near 75 mph (120 kph) with higher gusts. Some weakening is forecast during the next 48 hours.
Maria remains a large storm. Hurricane-force winds extend outward up to 105 miles (165 km) primary to the northeast of the center, and tropical-storm-force winds extend outward up to 230 miles (370 km).
The estimated minimum central pressure based on reconnaissance aircraft data is 978 millibars.
The National Hurricane Center (NHC) predicts that cool ocean water and moderate wind shear will cause Maria to weaken to a tropical storm in less than 24 hours. Maria is predicted to move northward, paralleling the United States East Coast for a couple days. Storm surge flooding and rip currents are expected in that area. Maria is then forecast to turn toward the northeast and move away from the coast.
For forecast updates on Maria, visit: www.nhc.noaa.gov
Hal Pierce and Rob Gutro
NASA’s Goddard Space Flight Center, Greenbelt, Md.
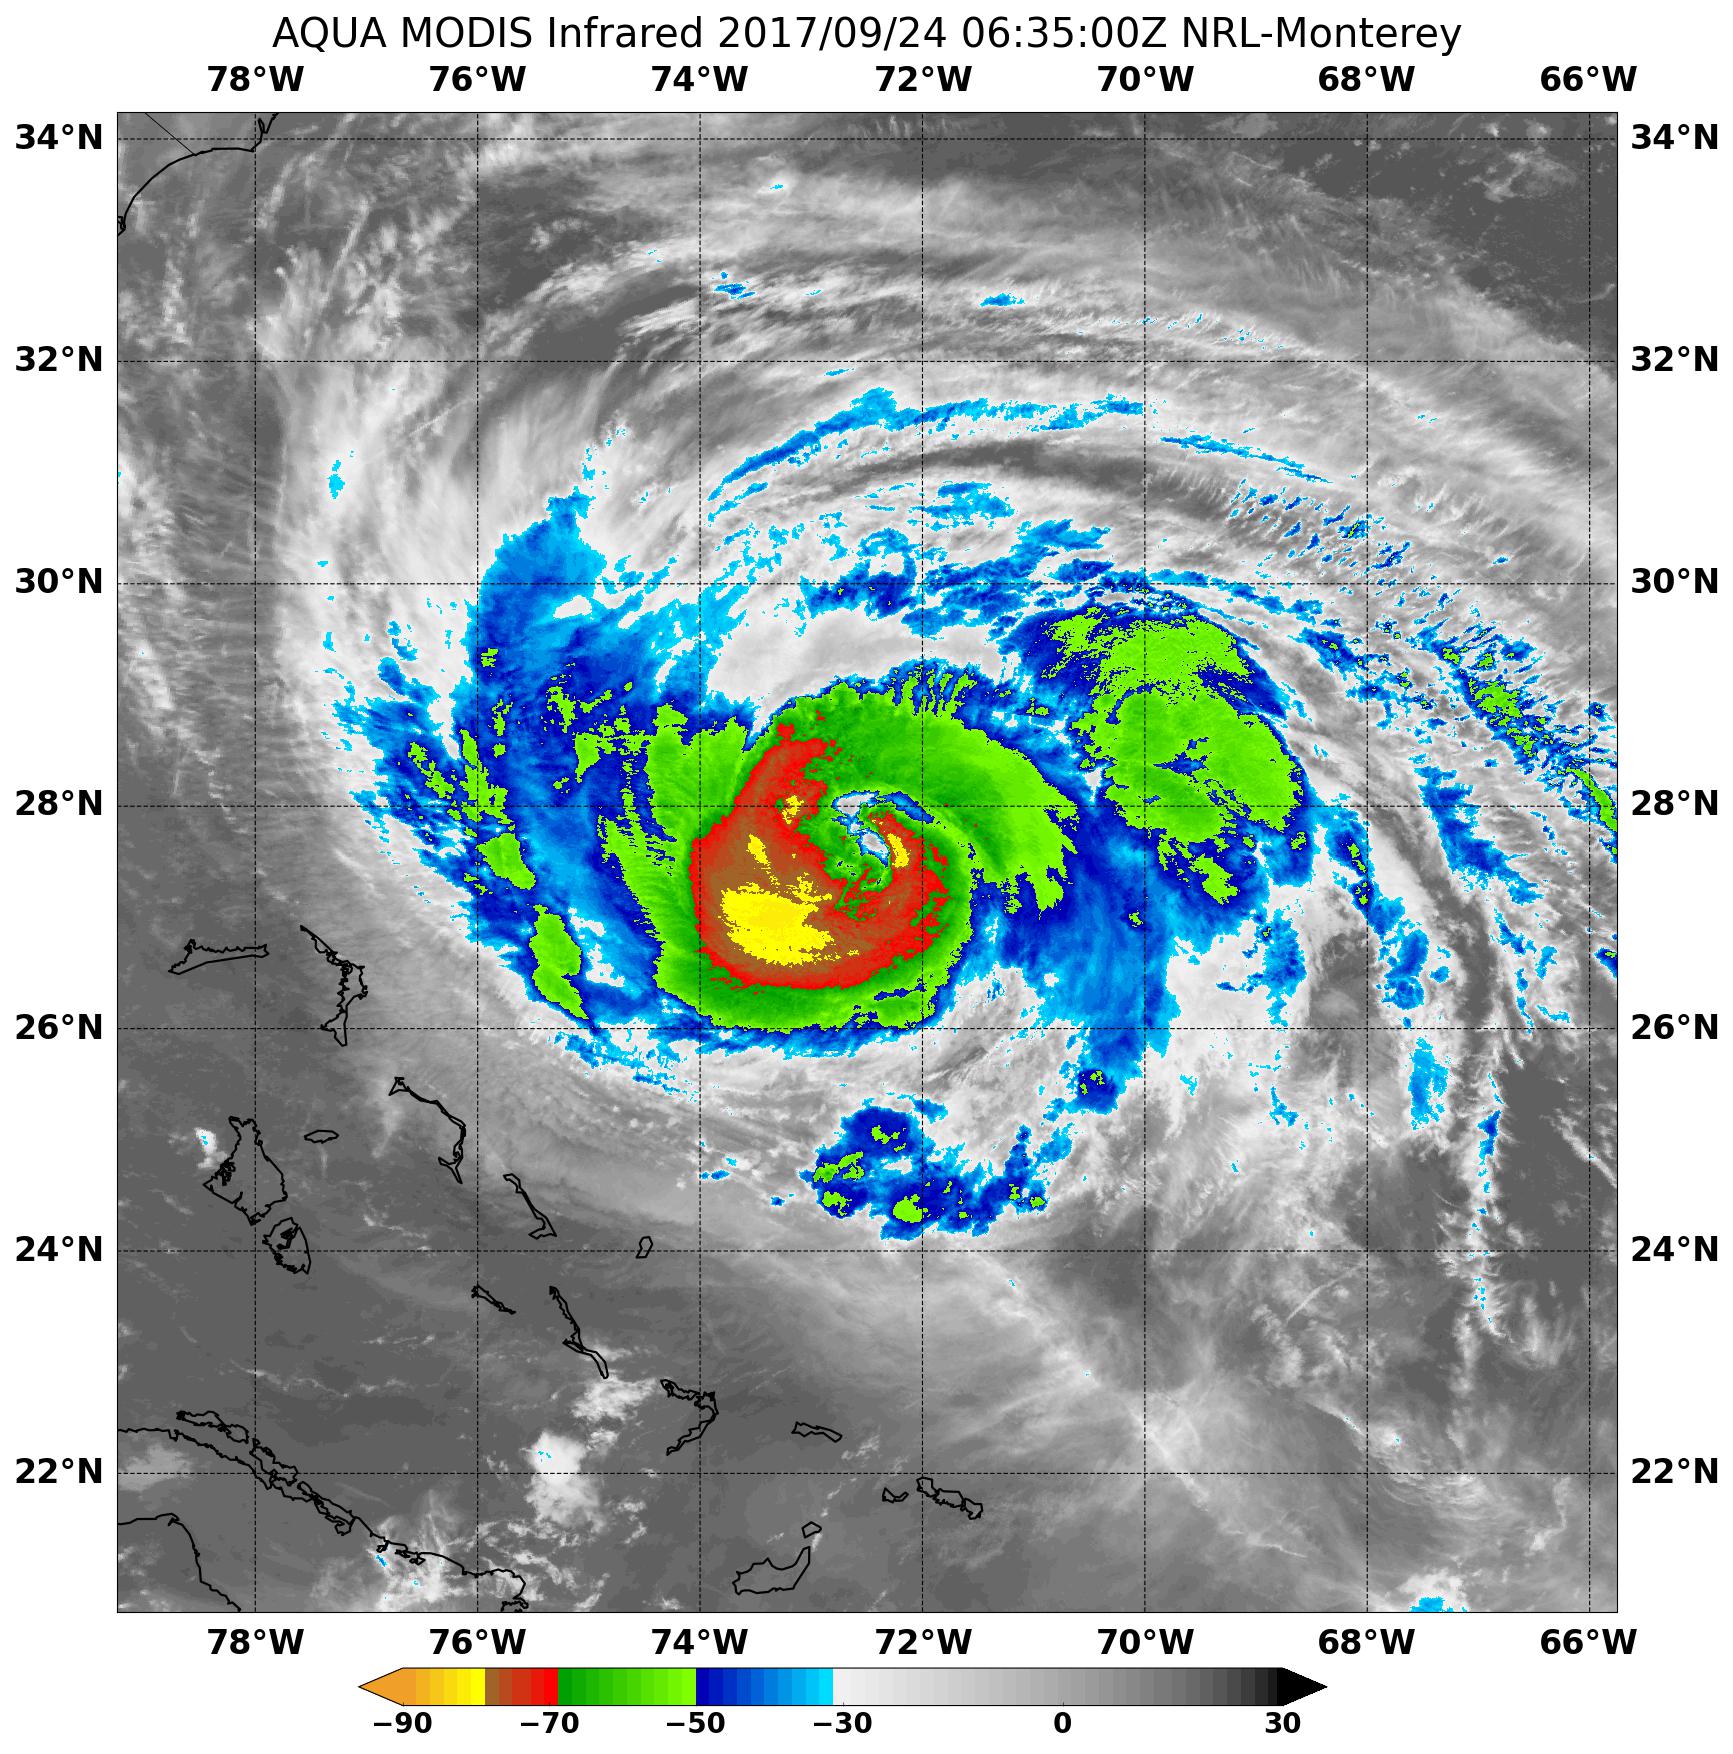
Sept. 26, 2017 – NASA Satellite Data Shows Hurricane Maria’s Strongest Side
NASA’s Aqua satellite provided an infrared look at Hurricane Maria’s cloud top temperatures and found the coldest cloud tops and strongest storms were facing east of the center and away from the U.S. However, Maria is a large hurricane. On Sept. 26, the National Hurricane Center reported that hurricane-force winds extend outward up to 105 miles (165 km) from the center and tropical-storm-force winds extend outward up to 240 miles (390 km).
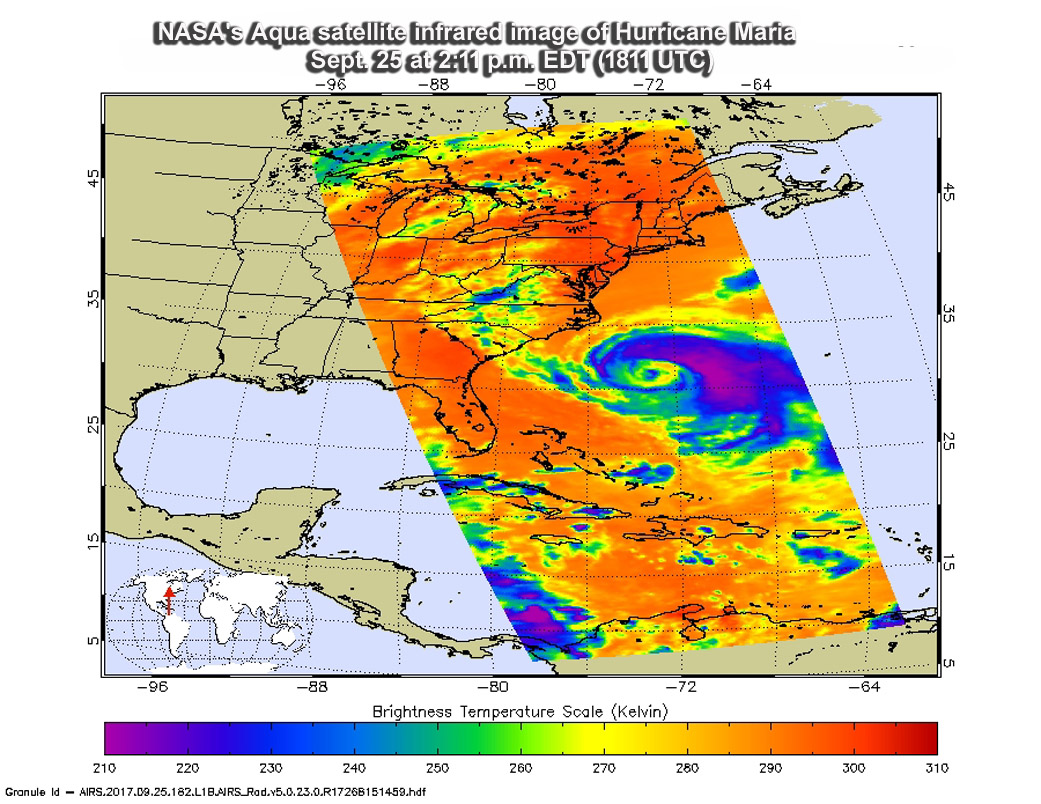
The Atmospheric Infrared Sounder or AIRS instrument aboard NASA’s Aqua satellite passed over Hurricane Maria on Sept. 25 at 2:11 p.m. EDT (1811 UTC) and analyzed the storm in infrared light. Infrared light provides scientists with temperature data and that’s important when trying to understand how strong storms can be. The higher the cloud tops, the colder and the stronger they are. So infrared light as that gathered by the AIRS instrument can identify the strongest sides of a tropical cyclone. The AIRS image clearly showed the bulk of strong storms in Maria’s northeastern quadrant as well as in the storms surrounding the eye.
Cloud top temperatures in thunderstorms around the eyewall as cold as minus 63 degrees Fahrenheit (minus 53 degrees Celsius). Storms with cloud top temperatures that cold have the capability to produce heavy rainfall.
On Sept. 27, the National Hurricane Center noted “the satellite presentation of Maria has continued to slowly degrade over the past 24 hours, as deep convection is now confined to the southeastern portion of the circulation.”
AIRS data also showed cooler sea surface temperatures, which are expected to help weaken Maria.
At the same time as the AIRS image, another instrument aboard Aqua called MODIS, or Moderate Resolution Imaging Spectroradiometer took a visible light image of Maria. In the visible image, Maria’s eye was covered by high clouds.
Warnings in Effect on September 26, 2017
The National Hurricane Center (NHC) posted a Storm Surge Warning for Ocracoke Inlet to Cape Hatteras, North Carolina. A Tropical Storm Warning is in effect for Bogue Inlet to the North Carolina/Virginia border, and for the Albemarle and Pamlico Sounds.
A Storm Surge Watch is in effect for Cape Lookout to west of Ocracoke Inlet, and north of Cape Hatteras to Duck, North Carolina.
At 11 a.m. EDT on Sept. 26, the National Hurricane Center reported that tropical-storm-force winds nearing North Carolina’s Outer Banks. Storm Surge and Tropical Storm Warnings were in place from North Carolina to Virginia.
Status of Hurricane Maria
At 11 a.m. EDT (1500 UTC), the center of Hurricane Maria was located near 33.6 degrees north latitude and 73.1 degrees west longitude. That’s about 175 miles (285 km) southeast of Cape Hatteras, North Carolina. The latest minimum central pressure estimated from reconnaissance aircraft data is 971 millibars.
Maria was moving toward the north near 7 mph (11 kph) and NHC said this general motion with some decrease in forward speed is expected, followed by a turn toward the north-northeast on Wednesday, Sept. 27. On the forecast track, the center of Maria will pass east of the coast of North Carolina during the next couple of days.
Maximum sustained winds are near 75 mph (120 kph) with higher gusts. Gradual weakening is forecast during the next couple of days, and Maria is forecast to become a tropical storm within the next day or so.
NHC Key Messages About Maria
The National Hurricane Center shared Key Messages about this large hurricane:
1. Maria is forecast to continue moving northward, paralleling the U.S. east coast for the next 36 hours, and will likely bring some direct impacts to portions of the North Carolina coast through Wednesday where a tropical storm warning is in effect.
2. Storm surge flooding, especially along the sound side of the North Carolina Outer Banks, is expected, and a storm surge warning and watch are in effect for portions of eastern North Carolina.
3. Swells generated by Maria are affecting much of the east coast of the United States. These swells are also affecting Bermuda, the Turks and Caicos Islands, and the Bahamas. These swells are likely to cause life-threatening surf and rip current conditions.
For forecast updates on Hurricane Maria, visit: www.nhc.noaa.gov
More information about AIRS can be found at airs.jpl.nasa.gov
Rob Gutro
NASA’s Goddard Space Flight Center
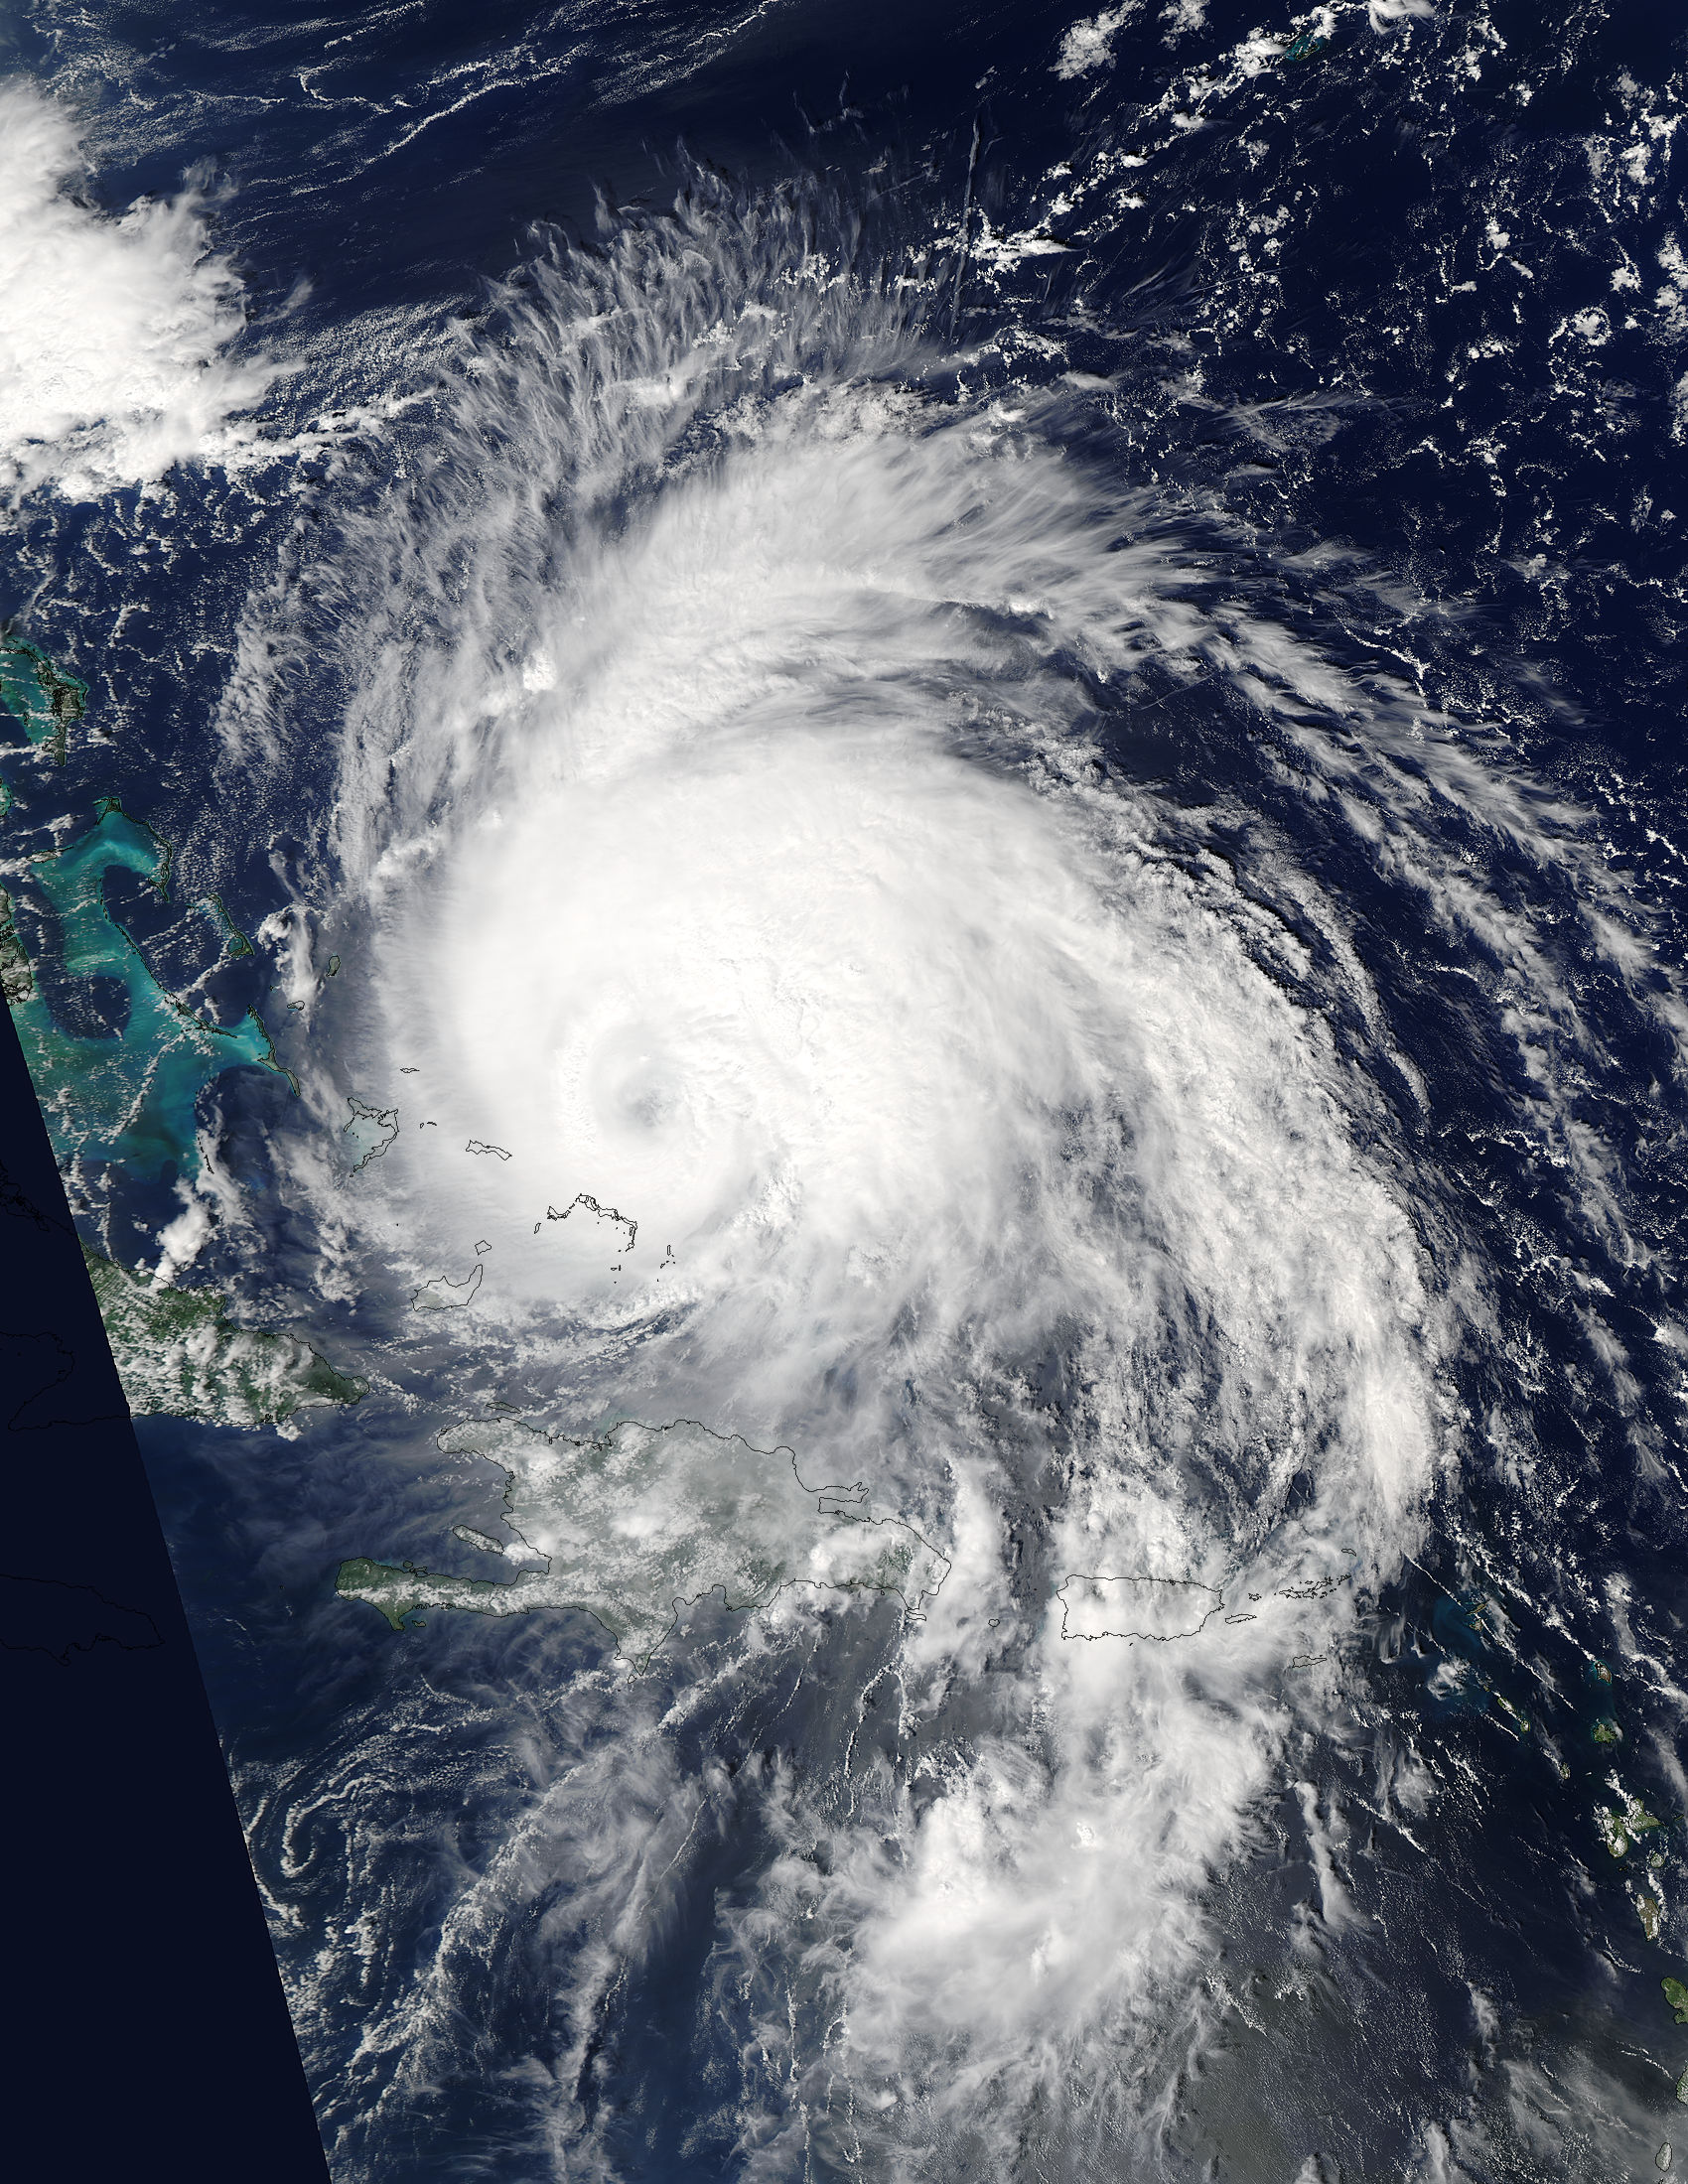
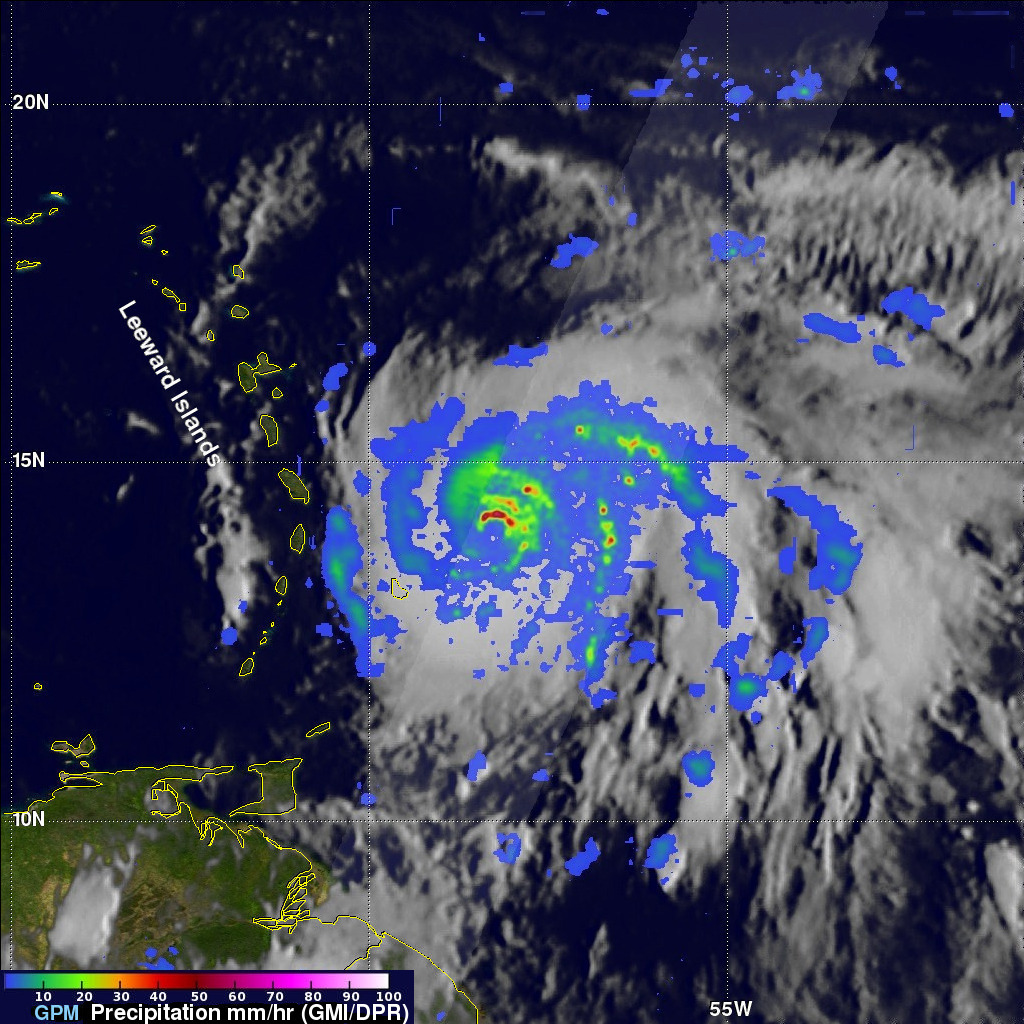
Sep. 25, 2017 – NASA-NOAA’s Suomi NPP Satellite Gets 2 Looks at Hurricane Maria
Hurricane Maria was analyzed in visible and infrared light as NASA-NOAA’s Suomi NPP passed overhead over two days. NASA’s GPM satellite also provided a look at Maria’s rainfall rates.

On Sept. 23 at 8:12 a.m. EDT (1212 UTC) the Global Precipitation Measurement mission or GPM core observatory estimated of hourly rainfall in multiple intense rainfall bands of thunderstorms around Maria’s western side. Rain was found falling at a rate of over 6.57 inches (137 mm) per hour and some thunderstorm tops in these rain bands were found to reach heights above 9.7 miles (15.7 km). GPM is managed by NASA and the Japan Aerospace Exploration Agency.
On Sept. 24 at 1:54 p.m. EDT (1754 UTC) the Visible Infrared Imaging Radiometer Suite (VIIRS) instrument aboard NASA-NOAA’s Suomi NPP satellite captured a visible light image of Hurricane Maria that showed the eye had become cloud filled. Maria was located northeast of Bahamas and far off the Florida east coast.
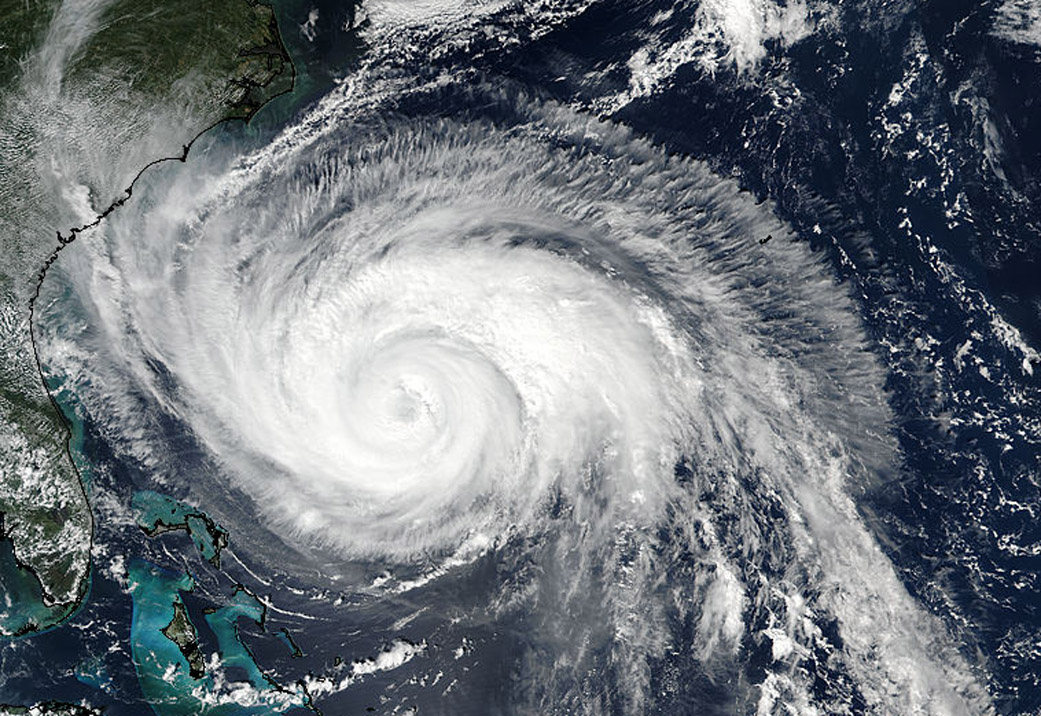
On Sept. 25 at 2:12 a.m. EDT (0612 UTC) the VIIRS instrument aboard NASA-NOAA’s Suomi NPP satellite provided tan infrared image of Hurricane Maria. The Infrared image provided forecasters with temperature data that showed where the strongest storms were located within the hurricane. Coldest clouds tops and strongest storms were in the southeastern quadrant where temperatures were as cold as or colder than minus 80 degrees Fahrenheit (minus 62.2 Celsius). NASA research has shown that storms with cloud top temperatures that cold can produce heavy rainfall.
On Sept. 25, National Hurricane Center forecaster Daniel Brown noted “Deep convection is primarily confined to the eastern semicircle of the circulation and the radius of maximum winds has significantly increased.”
Watches and Warnings in Effect
On Sept. 25 there were a number of Watches and Warnings in effect. A Tropical Storm Warning is in effect for Cape Lookout to Duck, North Carolina and the Albemarle and Pamlico Sounds. A Tropical Storm Watch is in effect for north of Duck to the North Carolina/Virginia border and from north of Surf City to south of Cape Lookout.
A Storm Surge Watch is in effect from Cape Lookout to Duck.
Maria’s Location and Status on Sept. 25
At 11 a.m. EDT (1500 UTC), the center of Hurricane Maria was located near 31.2 degrees north latitude and 72.9 degrees west longitude 72.9 West.
Maria was moving toward the north near 7 mph (11 kph), and this general motion with some decrease in forward speed is expected through Tuesday night.
Reports from an Air Force Reserve Hurricane Hunter aircraft indicate that maximum sustained winds are near 80 mph (130 kph) with higher gusts. Gradual weakening is forecast during the next couple of days and Maria is forecast to become a tropical storm
Tuesday night, Sept. 26. Maria is a large hurricane. Hurricane-force winds extend outward up to 90 miles (150 km) primarily to the east of center and tropical-storm-force winds extend outward up to 230 miles (370 km).The latest minimum central pressure reported by reconnaissance aircraft is 963 millibars.
Dangerous Ocean Conditions on U.S. East Coast
Swells generated by Maria are affecting portions of the coast of the southeastern United States and Bermuda and will be increasing along the Mid-Atlantic and southern New England coasts today. Swells also continue to affect Puerto Rico, the northern coast of Hispaniola, the Turks and Caicos Islands, and the Bahamas. These swells are likely to cause life-threatening surf and rip current conditions.
Maria’s Forecast Track
On the forecast track, the center of Maria will move well east of the southeast coast of the United States during the next day or so.
For updated forecasts on Maria, visit: www.nhc.noaa.gov.
Rob Gutro
NASA’s Goddard Space Flight Center
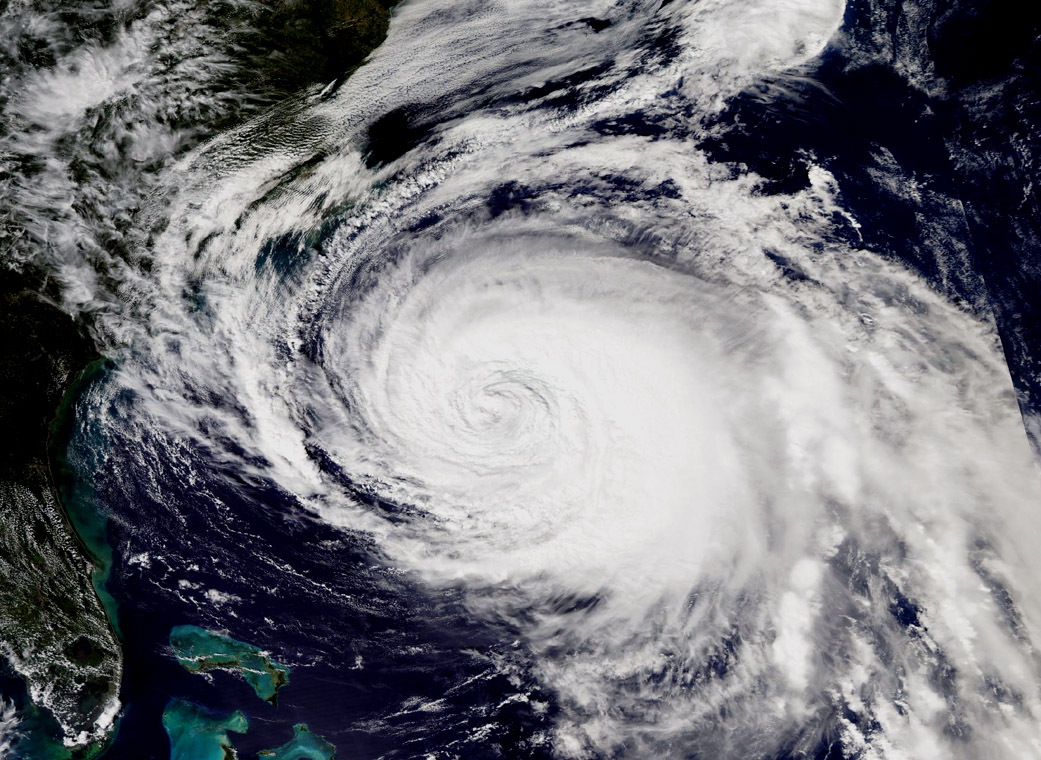
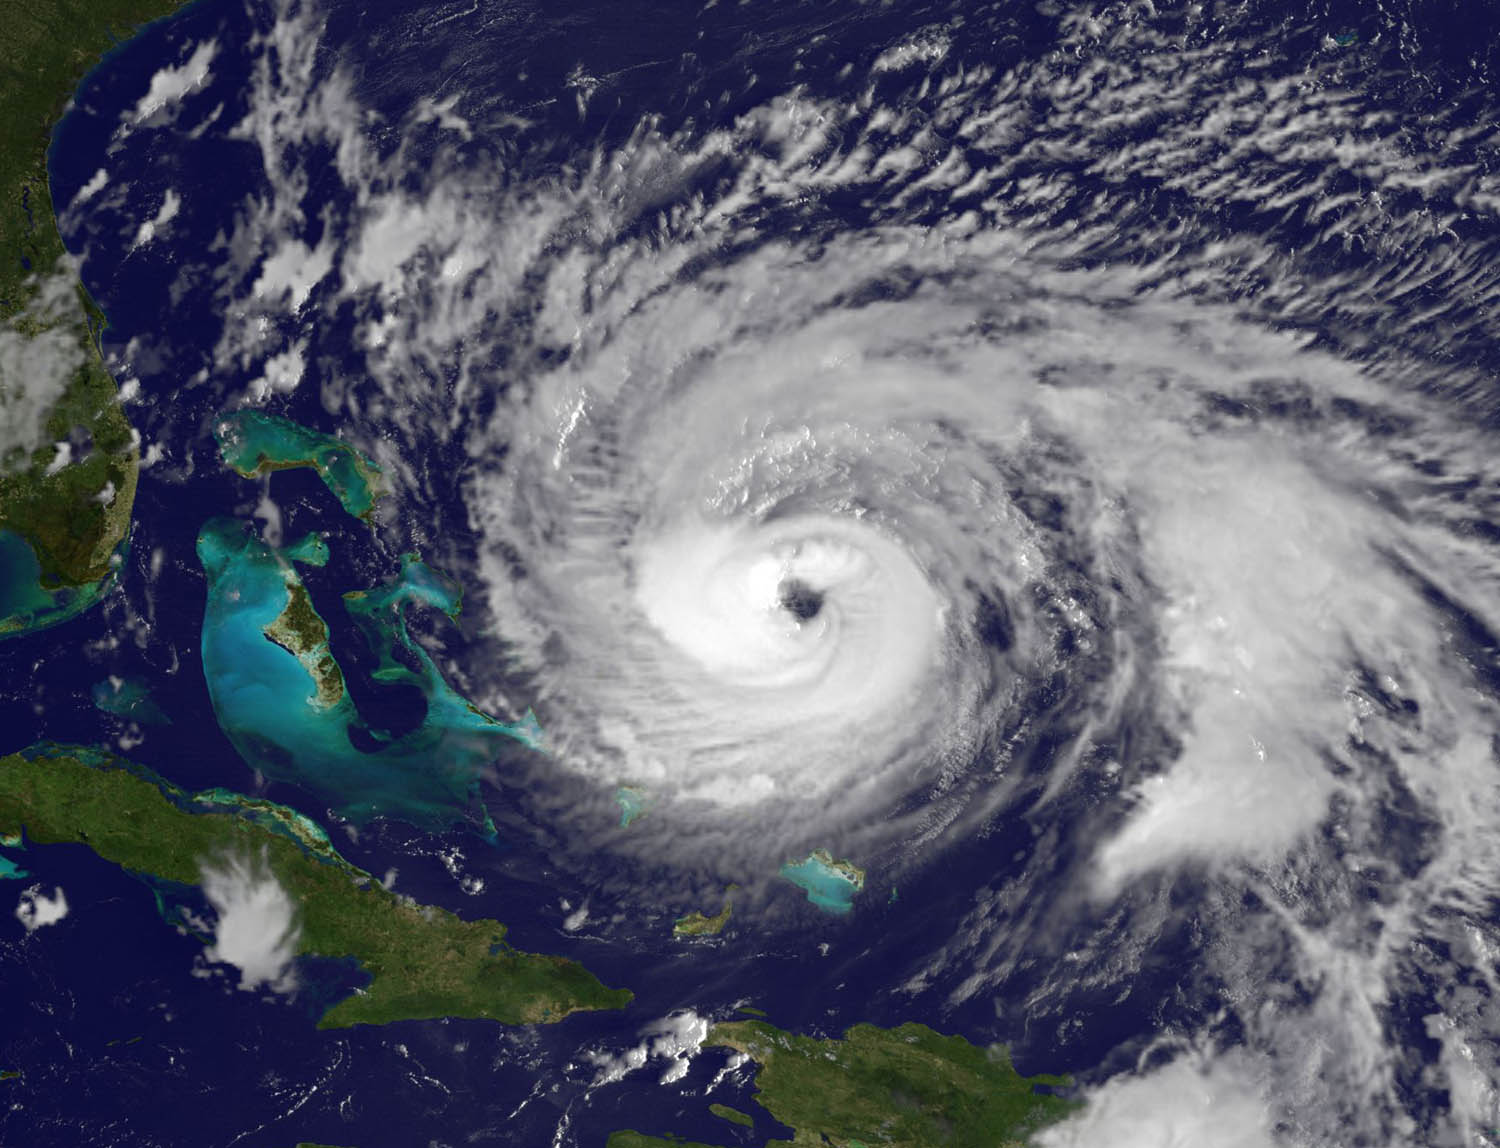
Sep. 24, 2017 – NASA Infrared Data Targets Maria’s Strongest Side
Infrared light provides valuable temperature data to forecasters and cloud top temperatures give clues about highest, coldest, strongest storms within a hurricane. NASA’s Aqua satellite provided that data and showed strongest storms were in Hurricane Maria’s southwestern quadrant.
On Sept. 24 at 2:35 a.m. EDT (0635 UTC) the Moderate Resolution Imaging Spectroradiometer or MODIS instrument aboard NASA’s Aqua satellite analyzed Maria’s cloud top temperatures in infrared light. MODIS found cloud top temperatures of strong thunderstorms in Maria’s quadrant as cold as or colder than minus 80 degrees Fahrenheit (minus 62.2 Celsius). Cloud top temperatures that cold indicate strong storms that have the capability to create heavy rain.
NOAA Hurricane Hunter aircraft showed that Maria now has a 30 nautical mile wide eye and indicated that air pressure within had dropped to 948 millibars. On Sept. 23 at 11:20 a.m. EDT (1520 UTC) the MODIS instrument aboard NASA’s Terra satellite captured a visible image of Hurricane Maria and it’s 30 nautical mile wide eye, when the storm was located east of the Bahamas.
The National Hurricane Center has noted that Maria has taken slightly more of a westward jog, and cautioned “Interests along the Carolina and Mid-Atlantic coasts should monitor the progress of Maria. Tropical storm or hurricane watches may be needed for a portion of the coast later today, Sunday, Sept. 24.”
At 5 a.m. EDT on Sunday, September 24, 2017, the eye of Hurricane Maria was located near 27.9 degrees north latitude and 72.7 degrees west longitude. That’s about 530 miles (855 km) south-southeast of Cape Hatteras, North Carolina. Maria was moving toward the north near 9 mph (15 kph), and this general motion is expected to continue through Monday.
Reports from a NOAA Hurricane Hunter aircraft indicate that maximum sustained winds are now near 110 mph (175 kph) with higher gusts. Maria is a category 2 hurricane on the Saffir-Simpson Hurricane Wind Scale. Some fluctuations in intensity are likely during the next day or so. Hurricane-force winds extend outward up to 60 miles (95 km) from the center and tropical-storm-force winds extend outward up to 240 miles (390 km).
Fluctuations in intensity appear likely during the next 24 to 36 hours as Maria remains over warm water and in an environment of light or moderate vertical wind shear. After that time, the hurricane is likely to encounter the colder water left by Hurricane Jose, which should cause a weakening trend.
On the forecast track, the core of Maria will be moving well east of the United States southeast coast during the next two days.
Maria continues to generate dangerous ocean conditions. Swells generated by Maria are increasing along portions of the southeastern United States coast and Bermuda and will be increasing along the Mid-Atlantic coast later today. Swells also continue to affect Puerto Rico, the Virgin Islands, the northern coast of Hispaniola, the Turks and Caicos Islands, and the Bahamas. These swells are likely to cause life-threatening surf and rip current conditions.
For updates and effects on wind, storm surge and rainfall, visit: www.nhc.noaa.gov.
Rob Gutro
NASA’s Goddard Space Flight Center
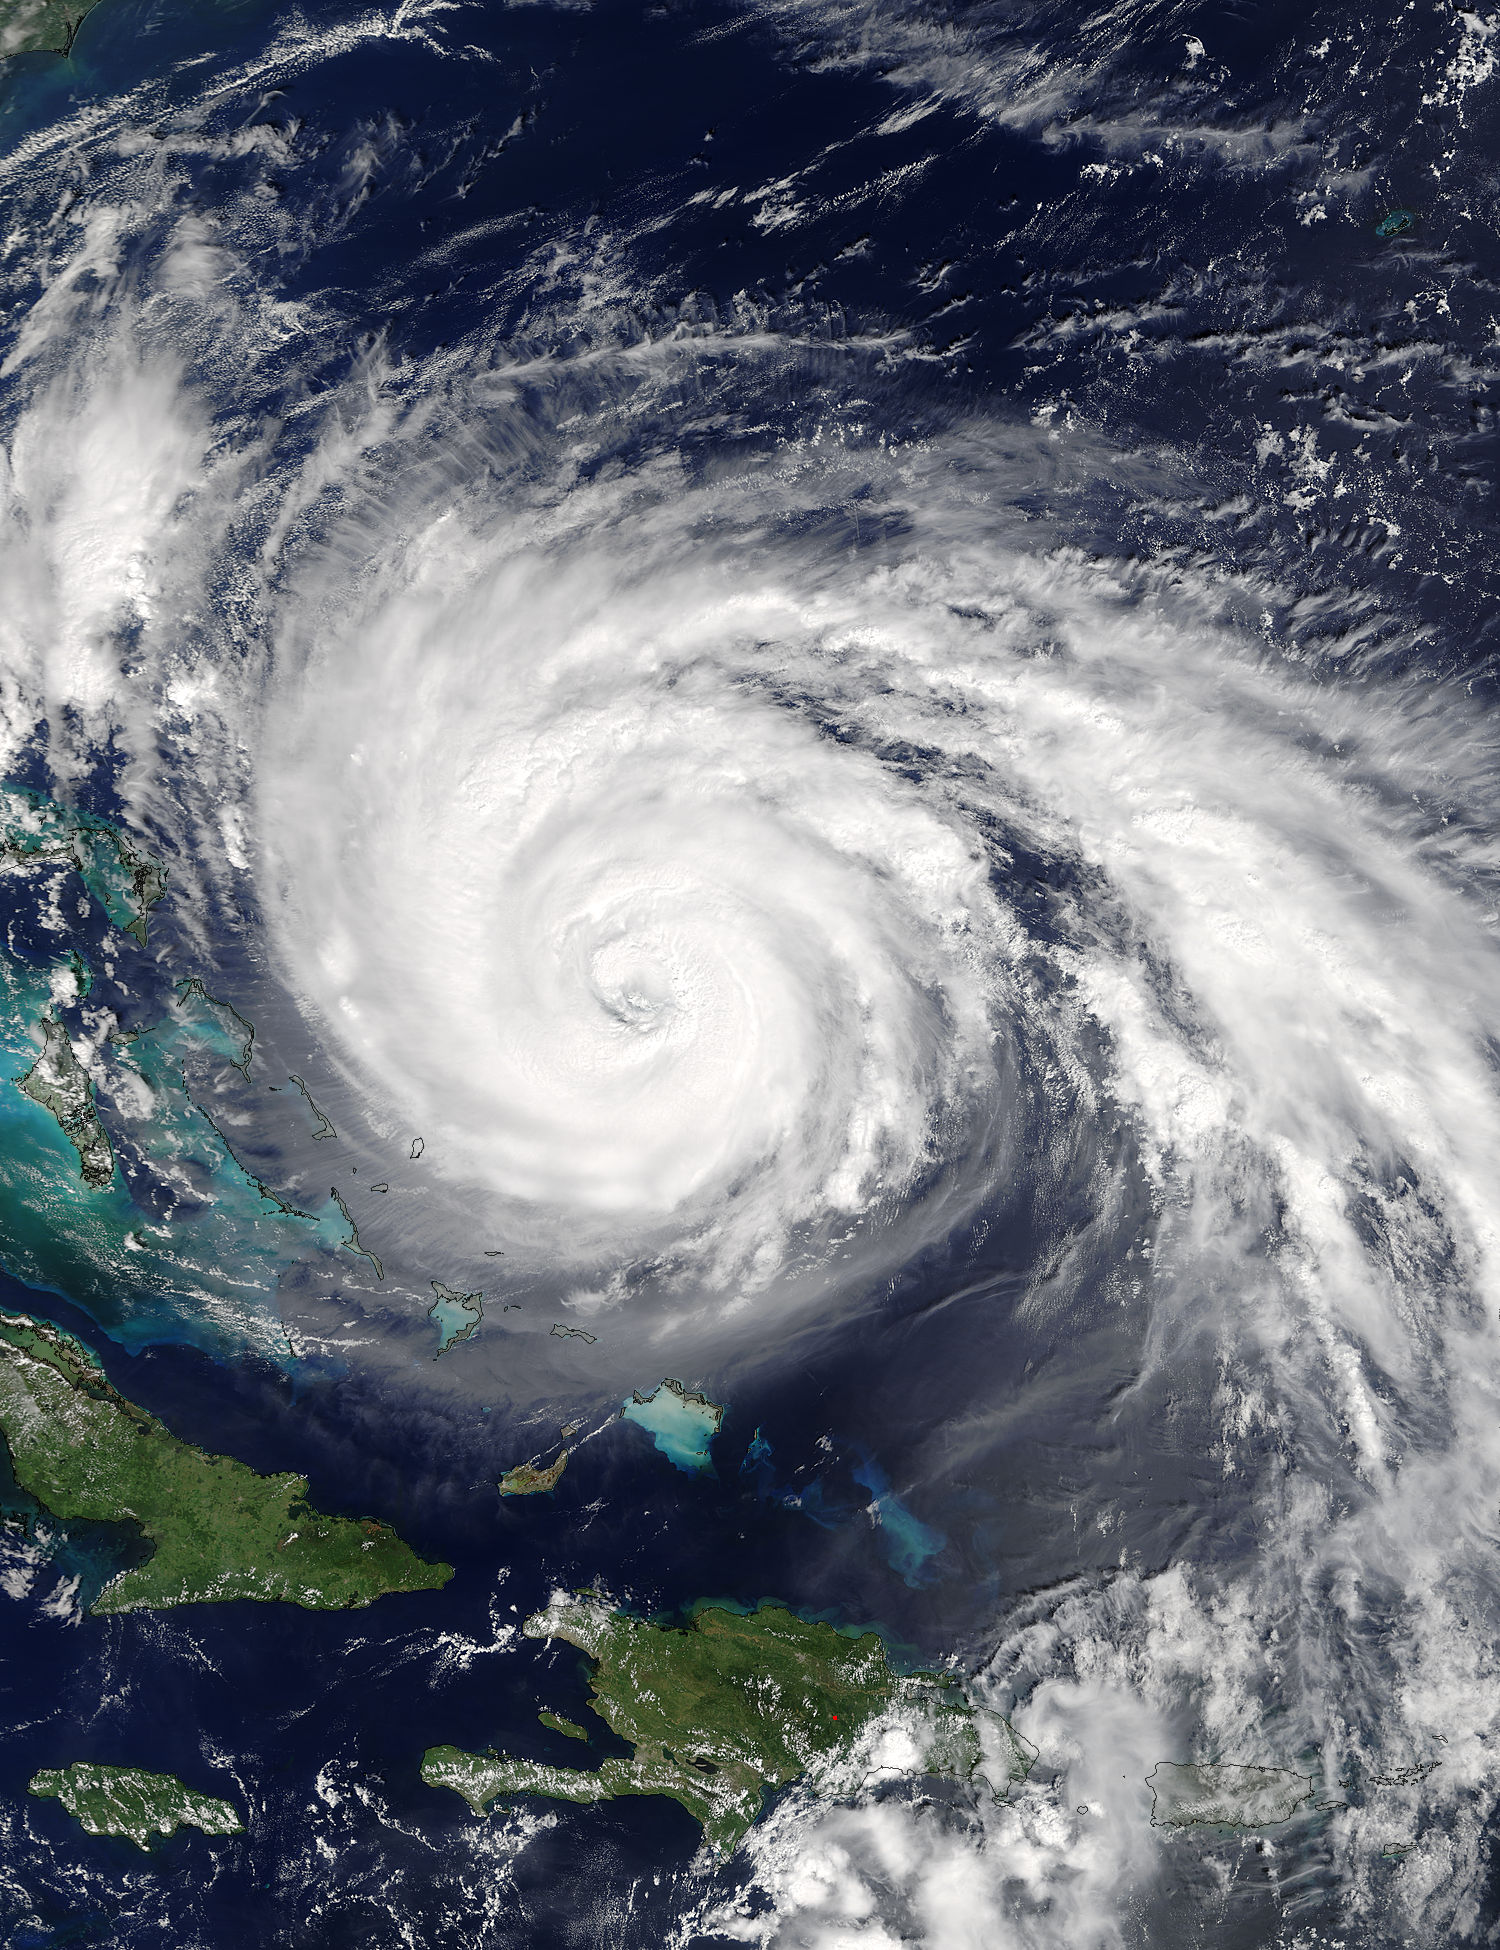
Sep. 23, 2017 – (Update #2) NASA Finds Wind Shear Affecting Hurricane Maria as its Eye Clears
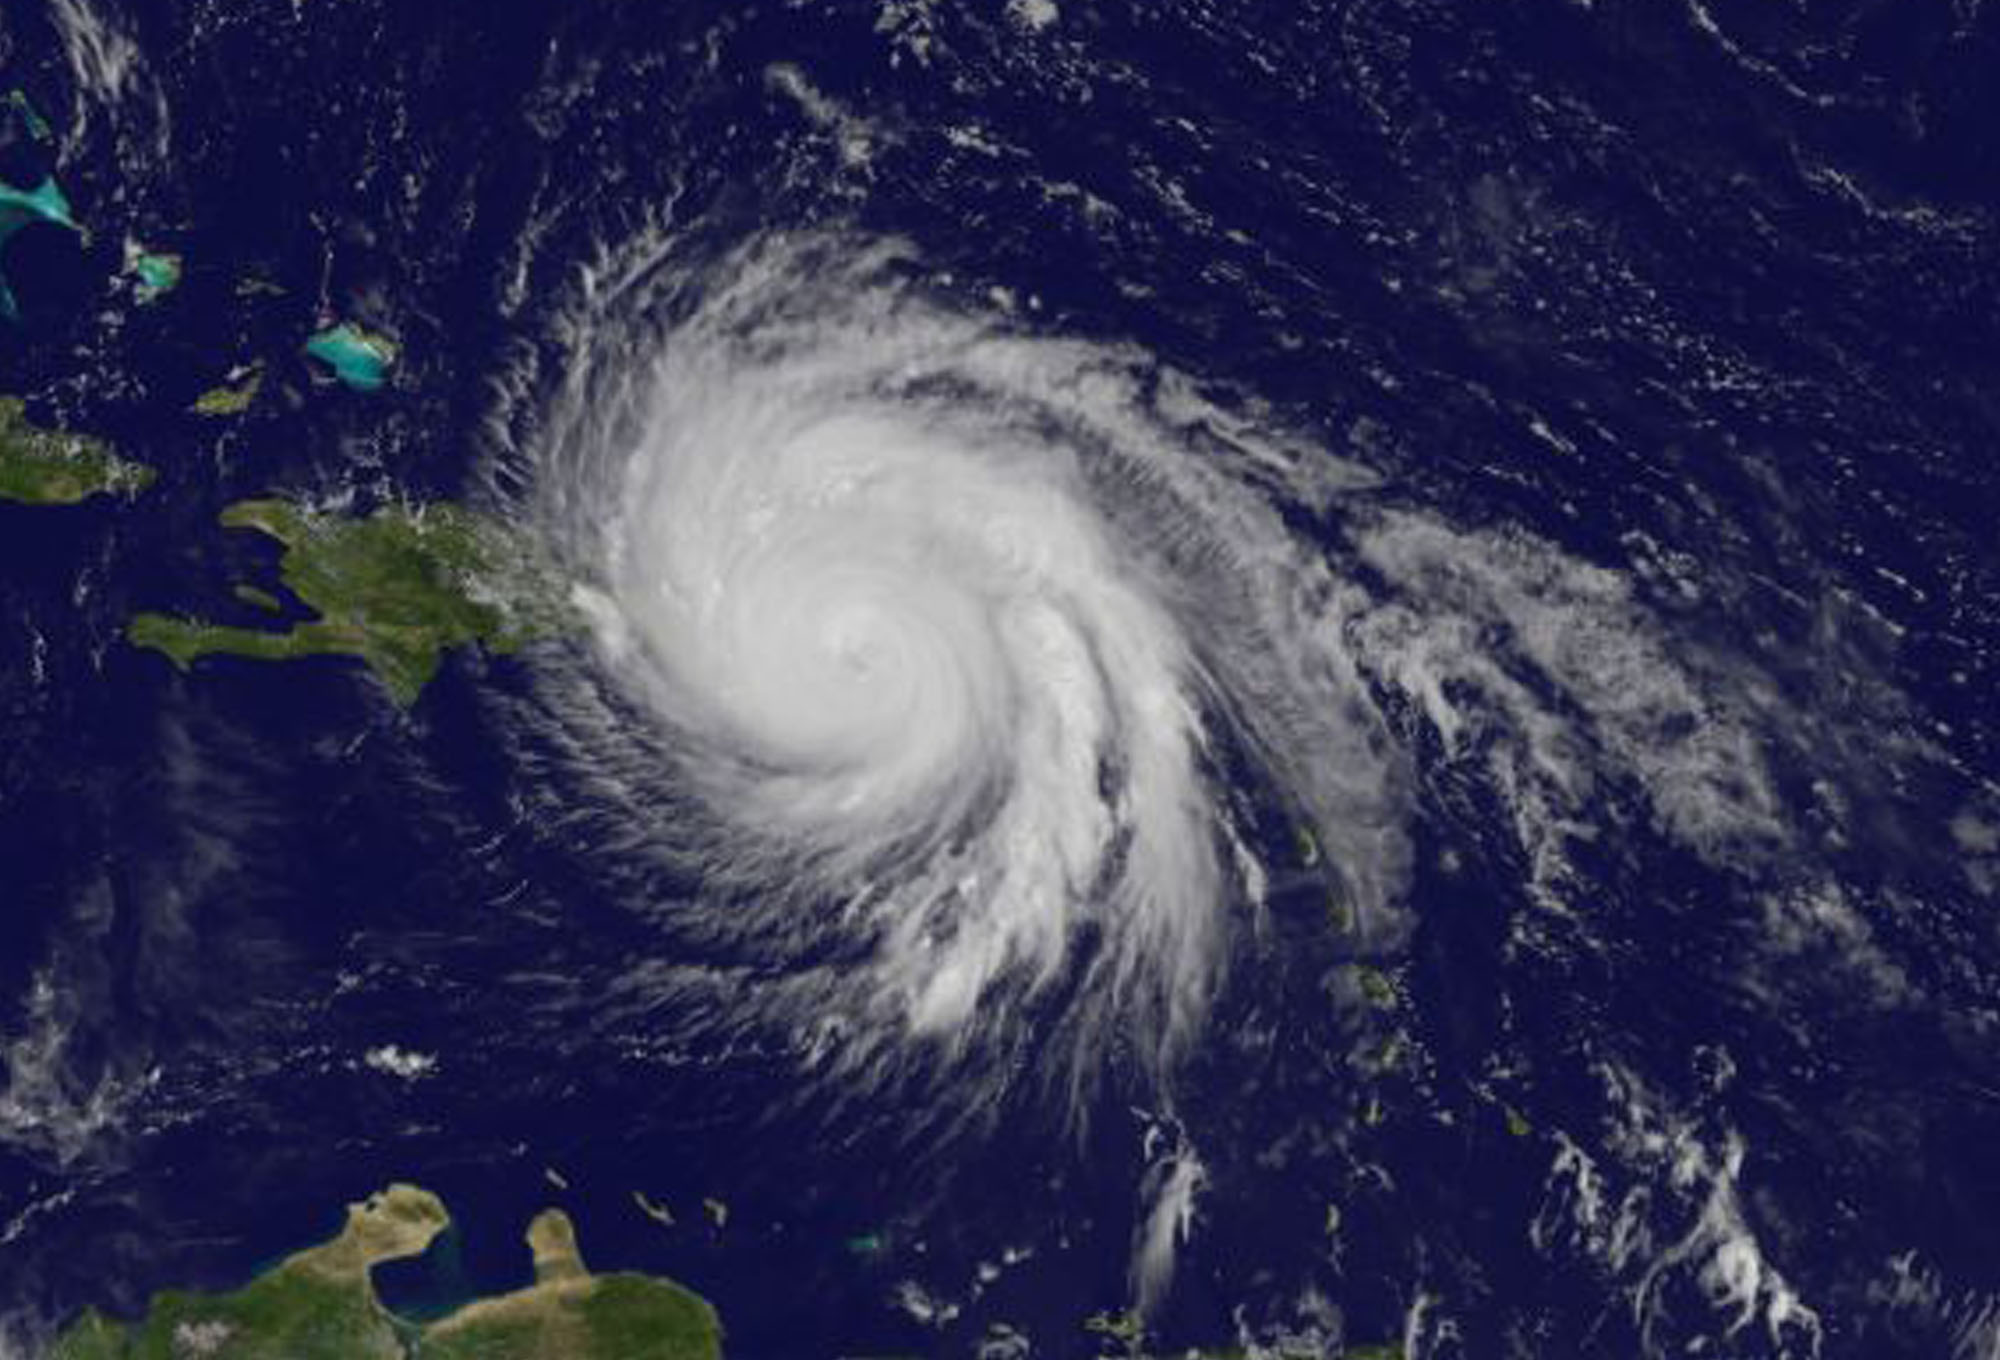
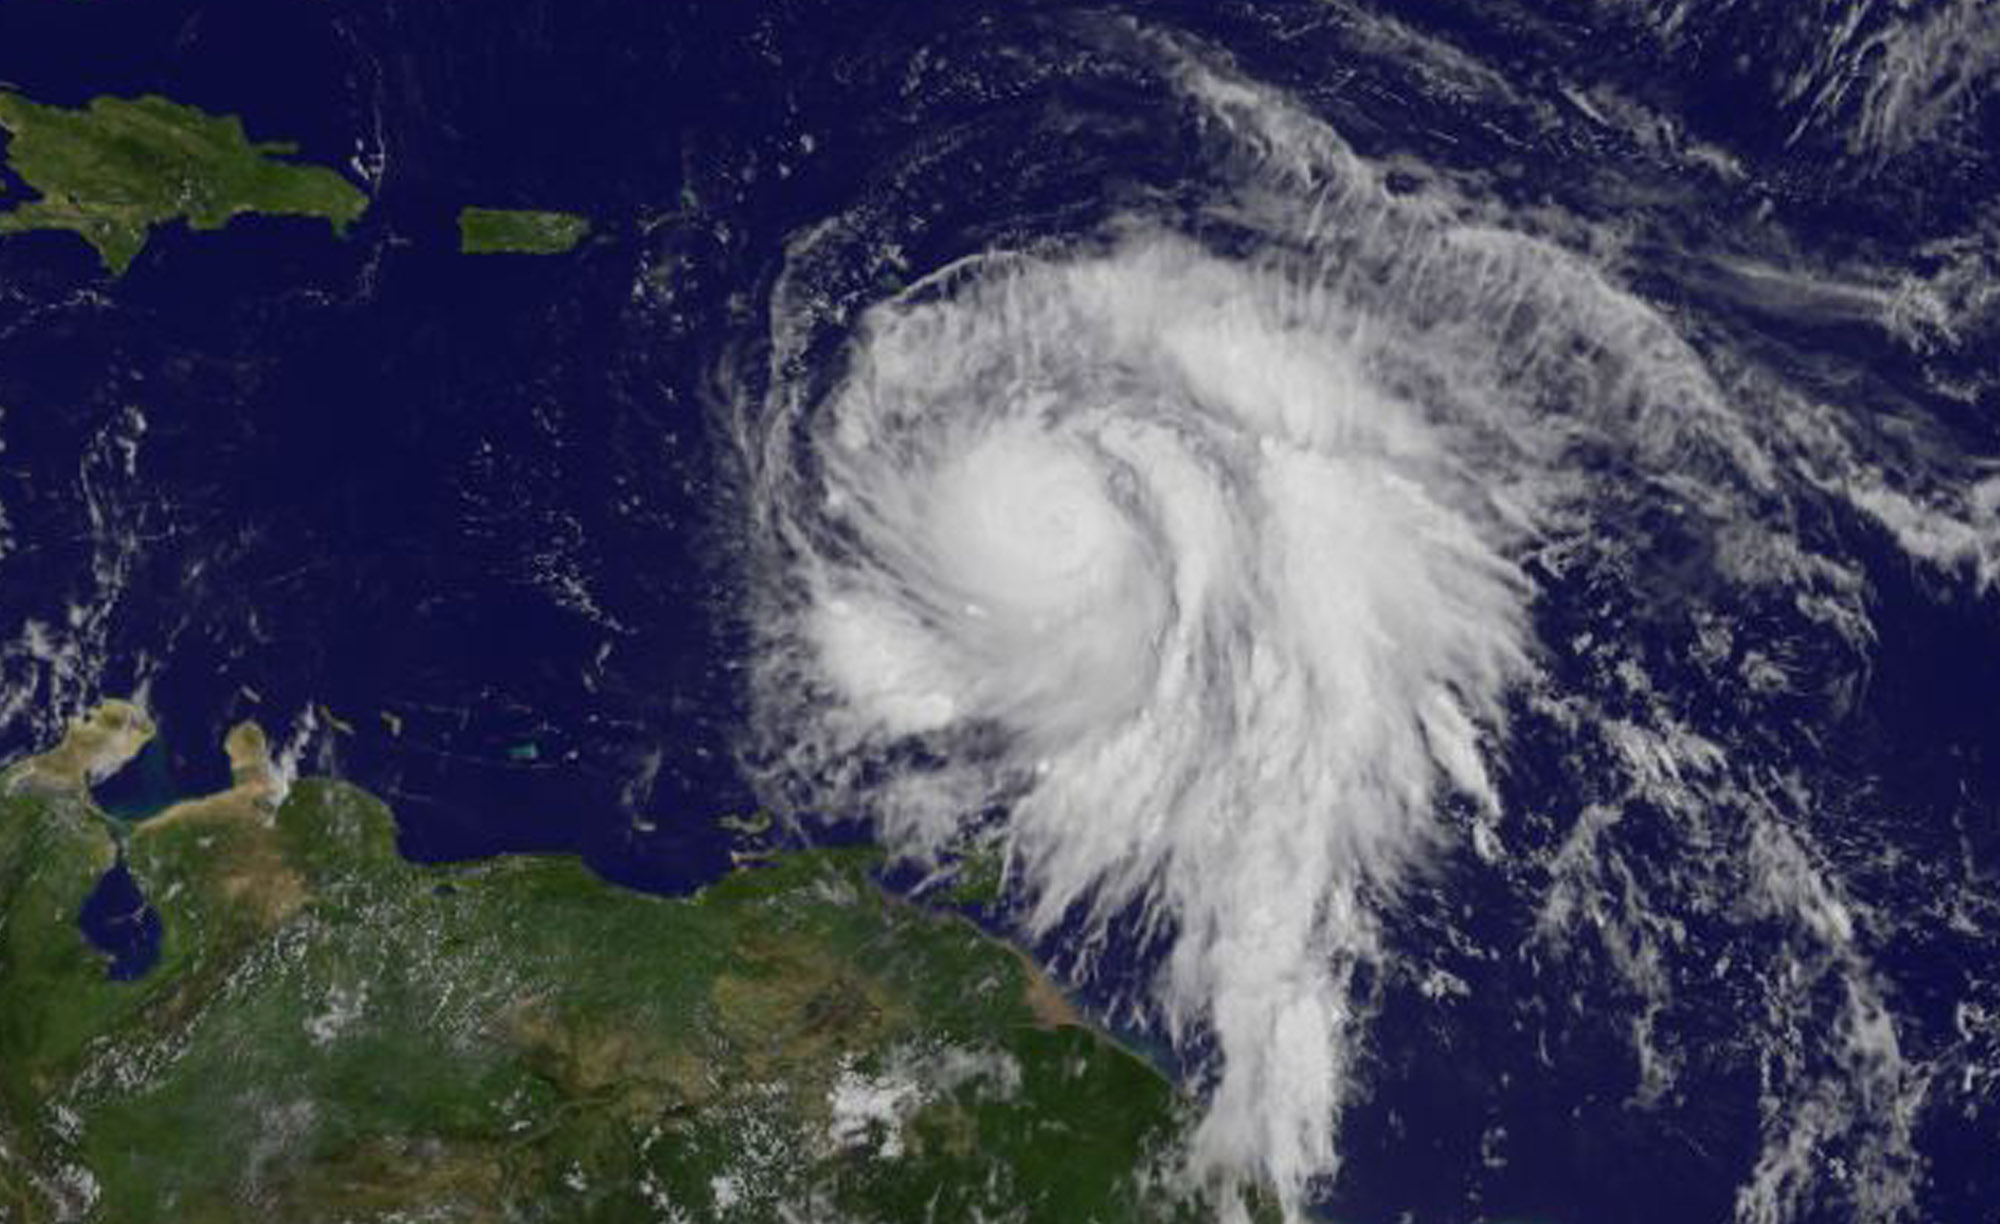
Satellite imagery from NASA shows that Hurricane Maria continues to move in a northerly direction while its eye remained east of the Bahamas. NASA’s Aqua satellite showed high clouds over the eye on Sept. 22 and one side of the hurricane over the Bahamas. On Sept. 23, NOAA’s GOES East satellite revealed a more clear eye but a less symmetric storm as Maria moved away from the Bahamas.
On Sept. 22 at 1:45 p.m. EDT (17:45 UTC) Hurricane Maria was over Turks and Caicos Islands, and the Bahamas the MODIS instrument aboard NASA’s Aqua satellite captured an image of the hurricane. At the time of the image Maria’s eye had become filled in with high clouds.
The next day, NOAA’s GOES East satellite provided a visible view of Hurricane Maria. On Saturday, Sept. 23 at 8:15 a.m. EDT Maria was moving past the Bahamas and regained a clear eye. The National Hurricane Center noted of the image, “the 35 nautical mile wide eye has become better defined in satellite imagery.”
The GOES image also showed Maria is experiencing about 15 knots of southwesterly vertical wind shear, “which is likely the reason for an asymmetric distribution of convection in the eyewall at this time,” said National Hurricane Center forecaster Jack Beven.
NOAA manages the GOES East satellite and the NASA/NOAA GOES Project at NASA’s Goddard Space Flight Center in Greenbelt, Md. created the image.
The National Hurricane Center noted on Saturday, September 23, 2017 that warnings on Maria were discontinued for the Bahamas and The Turks and Caicos Islands while high swells are expected to increase along portions of the Southeastern United States coast.
At 5 a.m. EDT (0900 UTC) on Saturday, September 23, 2017 the center of Hurricane Maria was located near 24.8 degrees north latitude and 72.0 degrees west longitude. That’s about 165 miles (270 km) east-northeast of San Salvador and 340 miles (545 km) east of Nassau. Maria was moving toward the north-northwest near 9 mph (15 kph), and the National Hurricane Center expects this general to continue through tonight.
Maximum sustained winds are now near 120 mph (195 kph) with higher gusts. Maria is a category 3 hurricane on the Saffir-Simpson Hurricane Wind Scale. Fluctuations in intensity are expected during the next couple of days. The estimated minimum central pressure is 952 millibars.
A turn toward the north is expected on Sunday, Sept. 24. On the forecast track, Maria should move away from the Bahamas into the open waters of the western Atlantic today.
Swells generated by Maria are affecting Puerto Rico, the Virgin Islands, the northern coast of Hispaniola, the Turks and Caicos Islands, and the Bahamas. These swells will begin to increase along portions of the southeastern United States coast and Bermuda today. These swells are likely to cause life-threatening surf and rip current conditions.
For forecast updates on Maria, visit: www.nhc.noaa.gov
Rob Gutro
NASA’s Goddard Space Flight Center
Sep. 23, 2017 – (Update #1) Satellite Animation Shows Hurricane Maria and Post-Tropical Storm Jose
Credits: NASA-NOAA GOES Project
Sep. 22, 2017 – (Update #2) NASA Tracking Hurricane Maria on Bahamas Approach
NASA-NOAA’s Suomi NPP satellite provided a look at Maria’s temperatures to find the strongest sides of the storm, while NOAA’s GOES satellite revealed the extent of the storm in a visible image as it moved toward the Bahamas.
On Sept. 22 at 3:18 a.m. EDT (0718 UTC) the VIIRS instrument aboard NASA-NOAA’s Suomi NPP satellite provided a thermal image of Hurricane Maria north of Hispaniola and nearing the Bahamas. The image showed highest coldest clouds around the eyewall and in bands of thunderstorms to the northeast and south and southeast of the center, stretching over Hispaniola and Puerto Rico. Those clouder clouds have the capability of producing heavy rainfall.
At 5:04 a.m. AST/EDT the National Weather Service (NWS) in San Juan, Puerto Rico reported those bands of thunderstorms were still dropping heavy rain. Satellite estimates indicate heavy rain over eastern Puerto Rico and heavier rain about to move into western Puerto Rico. The heavy rain will cause flooding. NWS noted “Some locations that are or will experience flooding include San Juan, Ponce, Arecibo, Yauco, Fajardo, Guayama, Coamo, Jayuya, Adjuntas, Santa Isabel, Canovanas, Sabana Seca, San Sebastian, Naranjito, Humacao, Mayaguez, San German, Lajas, Hatillo and Penuelas.” Flood warnings are in effect until 5:45 p.m. EDT today, Friday, September 22, 2017. In hilly terrain there are hundreds of low water crossings which are potentially dangerous in heavy rain.
A visible image of Hurricane Maria was taken from NOAA’s GOES East satellite on Sept. 22 at 10 a.m. EDT (1400 UTC) showed the storm just north of Turk Island and nearing the Bahamas. The National Hurricane Center (NHC) reported “Maria is still producing 125-mph winds as it passes northeast of the Turks and Caicos Islands.
Both the Suomi NPP and GOES East images were created at NASA’s Goddard Space Flight Center in Greenbelt, Md. NOAA manages the GOES series of satellites and the NASA/NOAA GOES Project uses the data to create images and animations. The Rapid Response Team at Goddard produces imagery from the Suomi NPP satellite.
A Hurricane Warning is in effect for Turks and Caicos Islands and the Southeastern Bahamas and a Tropical Storm Warning is in effect for the Central Bahamas.

At 11 a.m. EDT (1500 UTC), the eye of Hurricane Maria was located near 22.3 degrees north latitude and 71.0 degrees west longitude. That’s about 55 miles (90 km) north of Grand Turk Island, and 445 miles (715 km) east-southeast of Nassau. Maria was moving toward the northwest near 8 mph (13 kph).
Data from an Air Force Reserve Hurricane Hunter aircraft indicate that maximum sustained winds remain near 125 mph (205 kph) with higher gusts. Maria is a category 3 hurricane on the Saffir-Simpson Hurricane Wind Scale. A gradual weakening is forecast during the next 48 hours. The minimum central pressure based on data from the reconnaissance aircraft is 958 millibars.
NHC said a turn toward the north-northwest is expected later today, followed by a turn toward the north by late Saturday. On the forecast track, Maria’s core will move away from the Turks and Caicos Islands today, and pass northeast and east of the Bahamas through Sunday, Sept. 24.
For updated forecasts on Maria, visit: www.nhc.noaa.gov.
Rob Gutro
NASA’s Goddard Space Flight Center
Sep. 22, 2017 – (Update #1) Hurricane Satellite Animation Shows Hurricane Maria and Post-Tropical Storm Jose
Credits: NASA-NOAA GOES Project
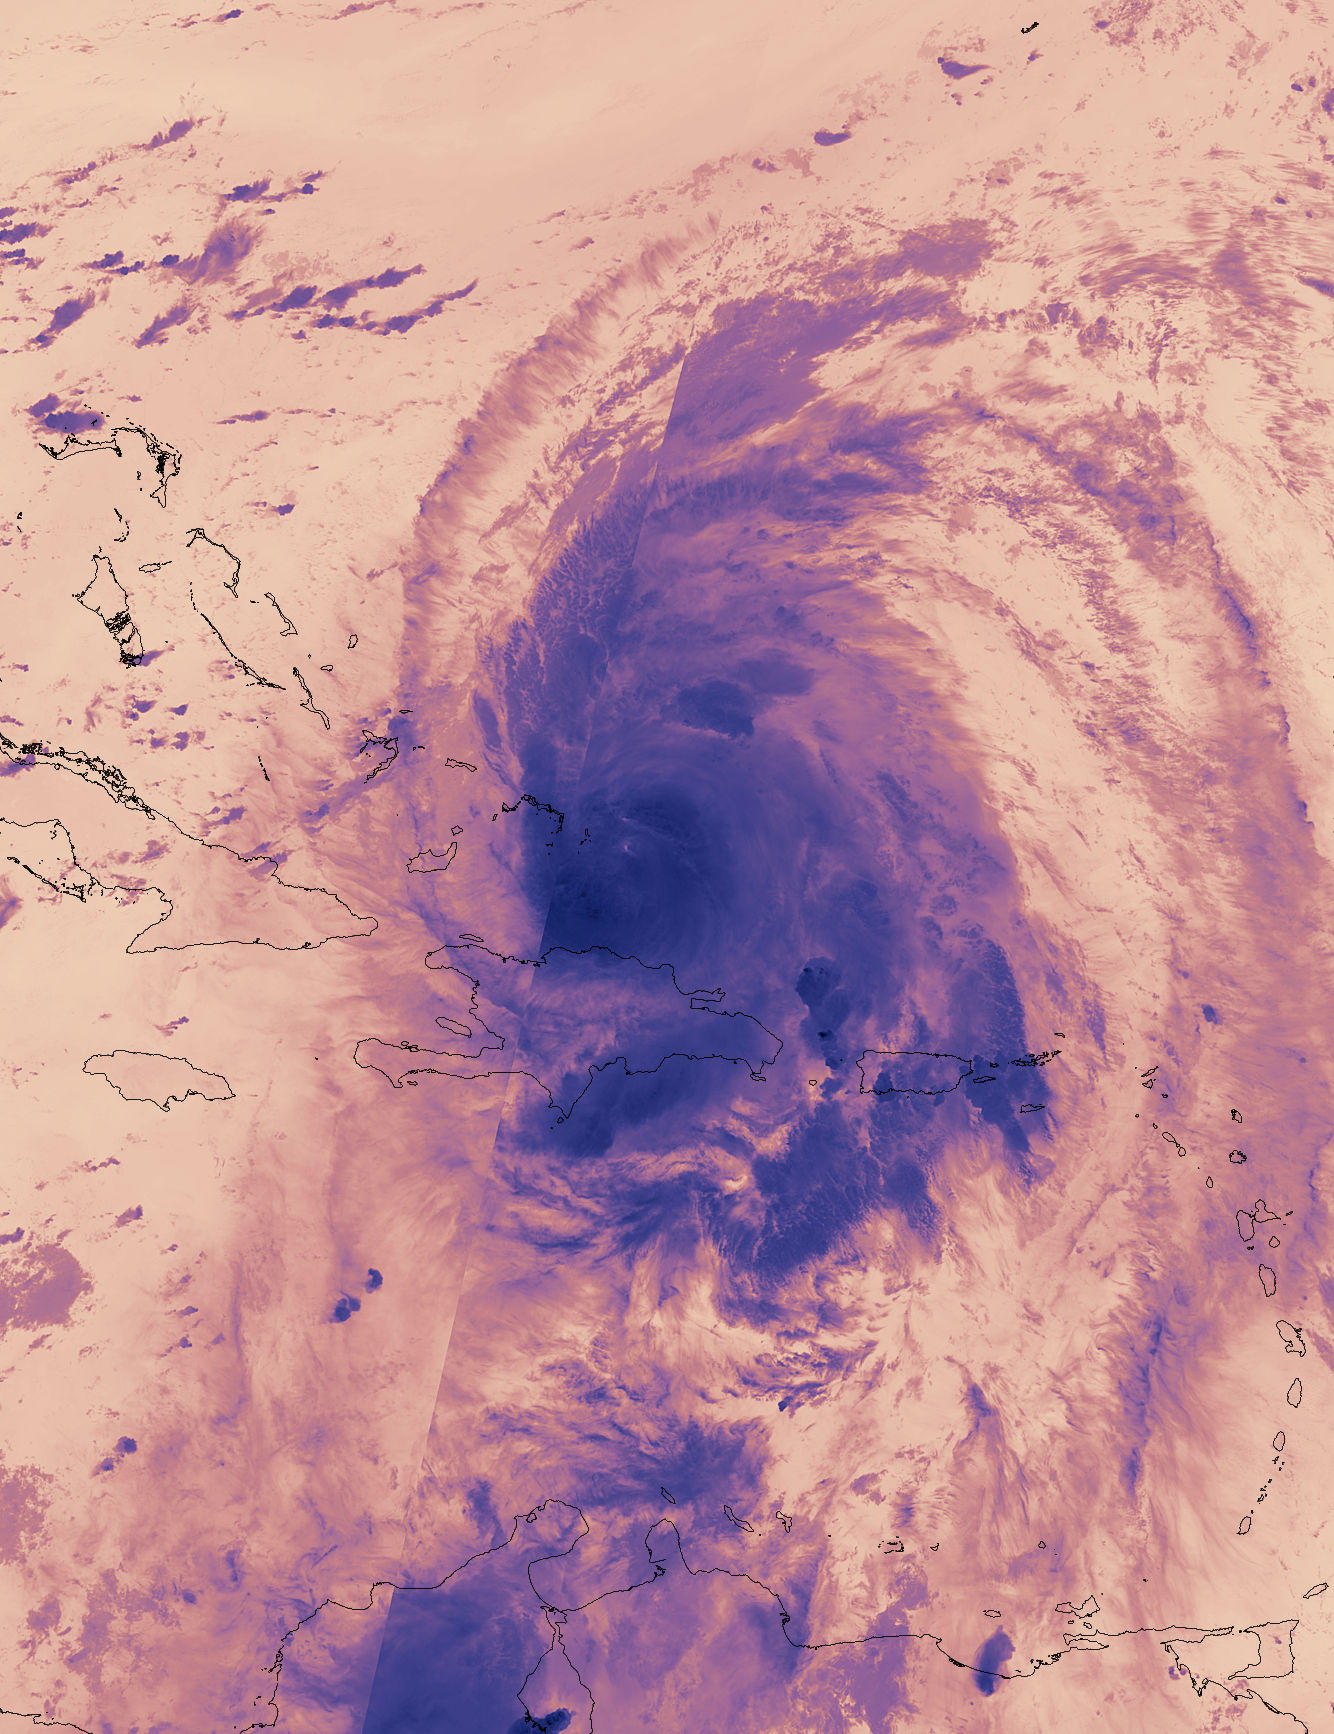
Sep. 21, 2017 – (Update #3) NASA Measures Hurricane Maria’s Torrential Rainfall, Sees Eye Re-open
Hurricane Maria has caused catastrophic flooding in Puerto Rico and left a wake of heavy rainfall that NASA measured using a fleet of satellites in space. NASA satellite imagery also saw Maria’s eye close up as it tracked across Puerto Rico and re-open after its exit.
Calculating Maria’s Rainfall
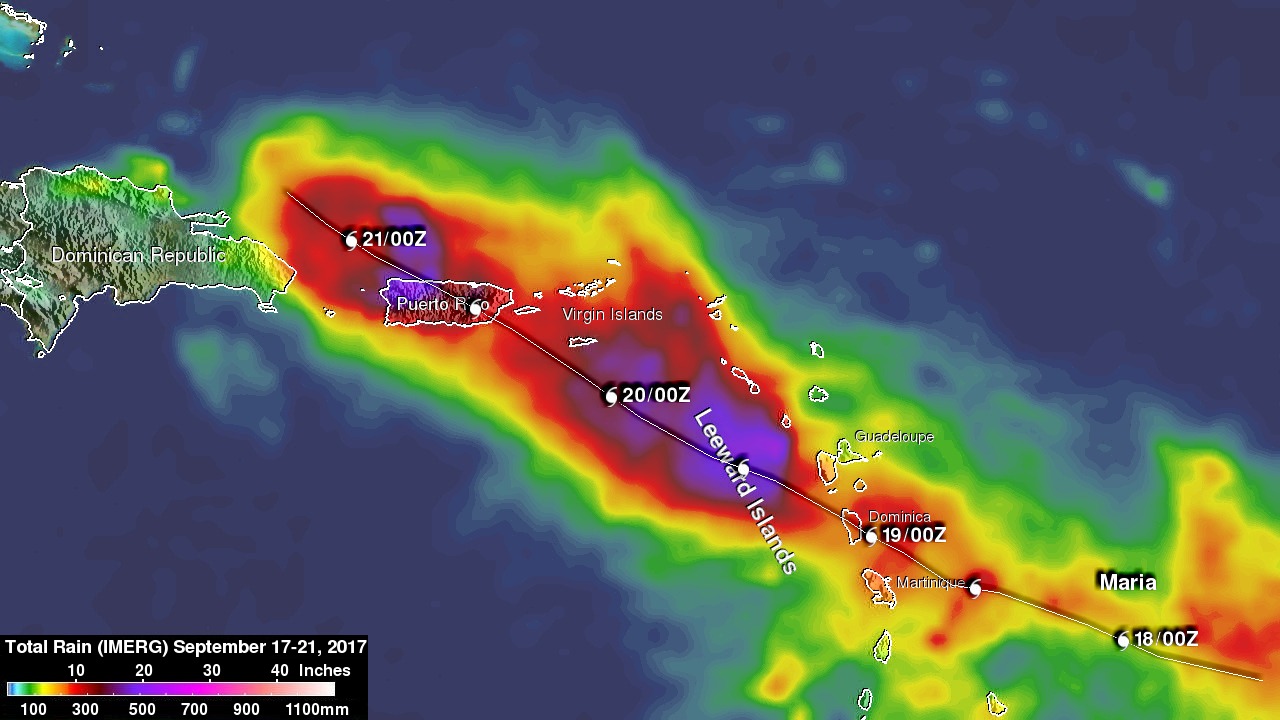
The Global Precipitation Measurement mission or GPM core satellite, a joint mission between NASA and the Japan Aerospace Exploration Agency can measure rainfall from space. That rainfall data, combined with data from other satellites provided a tally of Hurricane Maria’s rainfall over the course of several days.
At NASA’s Goddard Space Flight Center in Greenbelt, Maryland, NASA’s Integrated Multi-satellitE Retrievals for GPM (IMERG) data were used to estimate the total amount of rain that Hurricane Maria dropped from Sept. 17 to early Sept. 21, 2017. During that period Maria dropped heavy rain in the Leeward Islands, Virgin Islands and Puerto Rico. IMERG estimated that rainfall totals greater than 10 inches (254 mm) were common along Maria’s track. IMERG rainfall estimates indicated that more than 20 inches (512 mm) of rain fell over a large part of Puerto Rico.
Extreme flooding was reported in the streets of San Juan, the capital of Puerto Rico. The National Weather Service issued flash flood warnings for the entire island. Hurricane Maria has now moved to the northwest of Puerto Rico but is still expected to contribute to rainfall over the island on Friday. Feeder bands of thunderstorms are transporting rain over Puerto Rico and the Dominican Republic even as the hurricane moves toward the Turks and Caicos Islands.
Hurricane Maria’s Eye Winks
Hurricane Maria made landfall near Yabucoa, Puerto Rico, around 6:15 a.m. EDT/AST on Sept. 20. Maximum sustained winds in the hurricane were reported to be 149.5 mph (130 knots) as Maria moved toward San Juan, Puerto Rico.
On Sept. 20 at 10:50 a.m. EDT (14:50 UTC) NASA’s Terra satellite provided a visible image as Hurricane Maria was moving over Puerto Rico. Maria’s eye had become obscured by clouds.
On Sept. 21 at 1:54 a.m. EDT (0554 UTC) the VIIRS instrument aboard NASA-NOAA’s Suomi NPP satellite provided a thermal image of Hurricane Maria after it re-emerged eye moved off the coast of Puerto Rico and as just northeast of Hispaniola. The image showed that the eye had become visible again and powerful thunderstorms with very cold cloud tops surrounded it’s eye.
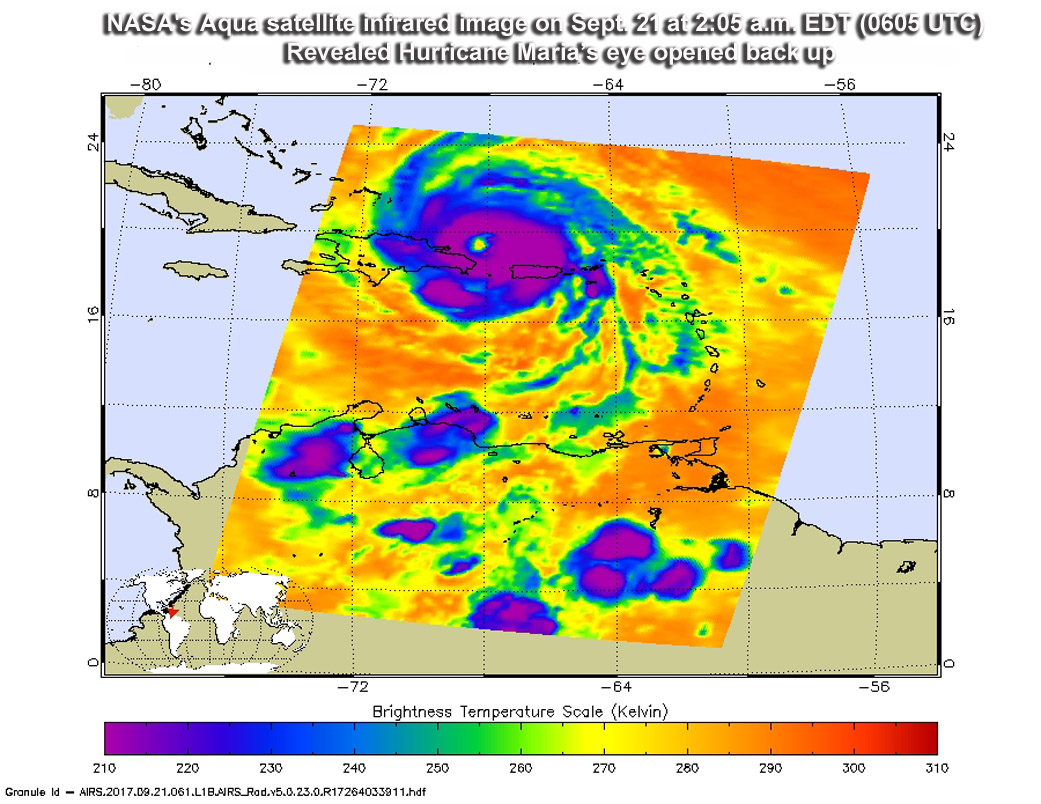
Another infrared image of Hurricane Maria was taken from the Atmospheric Infrared Sounder or AIRS instrument aboard NASA’s Aqua satellite on Sept. 21 at 2:05 a.m. EDT (0605 UTC). Maria’s eye opened up, and there were clear areas where the sea surface shows through. Powerful thunderstorms circle the large eye where cloud top temperatures of strong thunderstorms in Maria’s eyewall as cold as or colder than minus 63 degrees Fahrenheit (minus 53 Celsius).
Warnings and Watches in Effect on Sept. 21
The National Hurricane Center (NHC) said a Hurricane Warning is in effect for the Dominican Republic from Cabo Engano to Puerto Plata, Turks and Caicos Islands and the Southeastern Bahamas. A Tropical Storm Warning is in effect for the Dominican Republic west of Puerto Plata to the northern border of the Dominican Republic and Haiti, Dominican Republic west of Cabo Engano to Andres/Boca Chica. A Tropical Storm Watch is in effect for the Central Bahamas.
Location and Status of Maria on Sept. 21
At 11 a.m. EDT/AST (1500 UTC), the large eye of Hurricane Maria was located near 20.2 north latitude and 69.1 degrees west longitude. That’s about 105 miles (175 km) east-northeast of Puerto Plata, Dominican Republic and about 155 miles (255 km) southeast of Grand Turk Island. Maria is moving toward the northwest near 9 mph (15 kph), and this general motion is expected to continue through tonight. The minimum central pressure based on aircraft data is 960 millibars.
Data from an Air Force Reserve reconnaissance aircraft indicate that maximum sustained winds remain near 115 mph (185 kph) with higher gusts. Maria is a category 3 hurricane on the Saffir-Simpson Hurricane Wind Scale. Some strengthening is possible during the next day or so. Hurricane-force winds extend outward up to 60 miles (95 km) from the center and tropical-storm-force winds extend outward up to 150 miles (240 km).
Credits: NASA/JAXA, Hal Pierce
The NHC said “A turn toward the north-northwest is forecast early Friday, with that motion continuing through early Saturday. On the forecast track, Maria’s eye will continue to pass offshore of the northern coast of the Dominican Republic today, and then move near or just east of the Turks and Caicos Islands and southeastern Bahamas tonight and on Friday, Sept. 22.
For forecast updates on Maria, visit: www.nhc.noaa.gov
Rob Gutro
NASA’s Goddard Space Flight Center
Sep. 21, 2017 – (Update #2) Satellite Animation Shows Hurricane Maria and Tropical Storm Jose
Credits: NASA/NOAA GOES Project
Sep. 21, 2017 – (Update #1) – NOAA’s GOES-16 Provides Critical Data on Hurricane Maria
Although not yet operational, data from NOAA’s GOES-16 satellite proved vital in forecasting operations for Hurricane Maria as it neared Puerto Rico on September 20, 2017. Radar in San Juan went out at 5:50 a.m. EDT, just before Maria made landfall on the island. Land-based radar is used during storms to provide detailed information on hurricane wind fields, rain intensity, and storm position and movement. With this critical technology disabled and a major hurricane approaching, forecasters were able to utilize data from NOAA’s latest geostationary satellite, GOES-16, to track the storm in real-time.
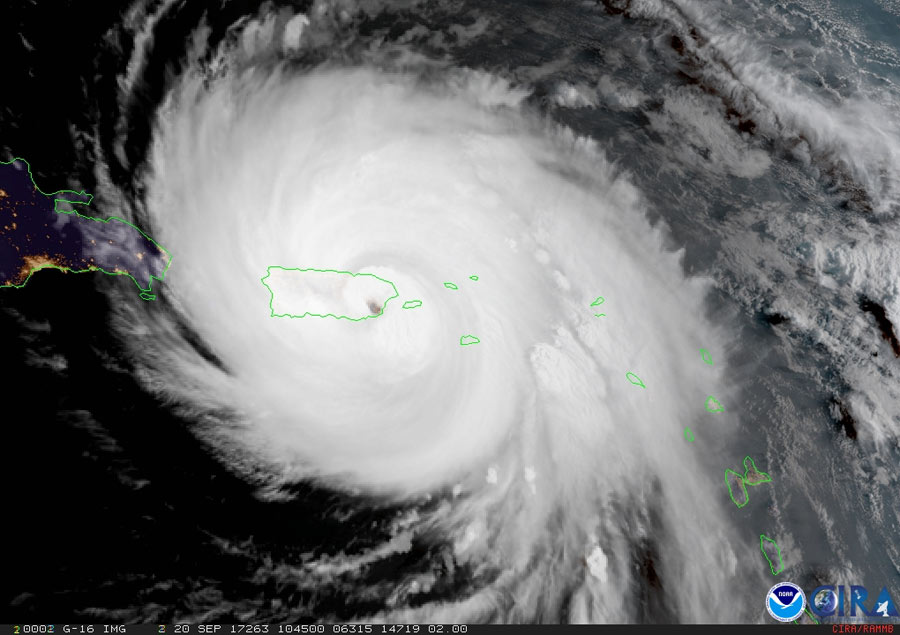
GOES-16 is able to scan a targeted area of severe weather as often as every 30 seconds, a capability not available with current GOES. This rapid scanning rate is allowing forecasters to analyze cloud patterns and track Maria in real time. GOES-16 also has five times more channels than the current GOES imager, providing better estimates of the structure of tropical cyclones and their environments. The four-fold improvement in resolution from GOES-16 provides greater accuracy of feature attributes, allowing for better characterization of the eyes of hurricanes.
GOES-16 captured this infrared imagery of Hurricane Maria over Puerto Rico on September 20, 2017. The dark red color, like that near the eyewall of the storm, corresponds to areas of great intensity. Credit: CIRA.
Credits: NOAA/NASA/CIRA
In the absence of radar, GOES-16 data helped fill the void and allowed forecasters to keep an eye on Maria, which made landfall on September 20 near Yabucoa, Puerto Rico, around 6:15 a.m. EDT as a category 4 hurricane. Forecasters continue to use the new capabilities available from GOES-16 to track the storm.
GOES-16, launched in November 2016, is currently in a central checkout orbit of 89.5 degrees west longitude, where it is undergoing an extended validation phase. The satellite will be relocated to its operational location as GOES-East at 75.2 degrees west late this year.
By GOES-R team which is a collaborative program at NOAA and NASA
Sept. 20, 2017 – Update No. 2 – NASA Finds Very Heavy Rainfall in Hurricane Maria
NASA looked into Hurricane Maria and found that powerful convective storms within the hurricane were dropping heavy rainfall. Maria brought that heavy rainfall to Puerto Rico and made landfall on Sept. 20 at 6:15 a.m. EDT.
Credits: NASA/JAXA/NASA Goddard’s Scientific Visualization Studio
Download this video in HD formats from NASA Goddard’s Scientific Visualization Studio
The Global Precipitation Measurement mission, or GPM, core observatory satellite collected data on rainfall rates as it passed above Hurricane Maria earlier on Sept. 19 at 9:51 p.m. AST/EDT (Sept. 20 0151 UTC). The rainfall analysis was derived from GPM’s Microwave Imager (GMI) and Dual-Frequency Precipitation Radar (DPR) data received by the satellite. GPM’s radar (DPR Ku band) found that some extreme storms within the hurricane’s feeder bands were dropping rain at a rate of greater than 5.4 inches (137 mm) per hour.
GPM is a joint mission between NASA and the Japan Aerospace Exploration Agency (JAXA).
NASA-NOAA’s Suomi NPP satellite VIIRS instrument captured a thermal image on Sept. 20 at 2:12 a.m. EDT (0612 UTC). The image showed very cold cloud top temperatures in the powerful thunderstorms in Maria’s eyewall. At the time, Maria’s eye was just east of the American Virgin Islands, and its northwestern quadrant stretched over Puerto Rico.
Landfall in Puerto Rico
The National Hurricane Center noted: “Geostationary satellite images and surface observations indicate that the center of Hurricane Maria made landfall near Yabucoa,
Puerto Rico, around 6:15 a.m. EDT/AST. Maximum sustained winds in the hurricane were reported to be 149.5 mph (130 knots) as Maria moved toward San Juan, Puerto Rico. A sustained wind 60 mph (96 kph) with a wind gust to 113 mph (182 kph) was reported at Yabucoa Harbor, Puerto Rico.”
A National Ocean Service tide gauge at Yabucoa Harbor, Puerto Rico, recently reported a water level of 4.3 feet above Mean Higher High Water (MHHW).
Maria Engulfs Puerto Rico in Satellite Imagery
A visible light image of Hurricane Maria was taken from NOAA’s GOES East satellite on Sept. 20 at 10:45 a.m. EDT (1445) as the Category 4 hurricane was moving across Puerto Rico. The island was totally covered by Maria’s clouds. Maria’s eastern quadrant also covered the western half of Hispaniola.
NOAA manages the GOES Series of satellites and images and animations are created at the NASA/NOAA GOES Project at NASA’s Goddard Space Flight Center in Greenbelt, Maryland.
Warnings and Watches
A Hurricane Warning is in effect for the U.S. Virgin Islands, British Virgin Islands, Puerto Rico, Culebra, and Vieques, Dominican Republic from Cabo Engano to Puerto Plata, Turks and Caicos Islands and the Southeastern Bahamas.
A Tropical Storm Warning is in effect for Dominican Republic west of Puerto Plata to the northern border of the Dominican Republic and Haiti, Dominican Republic west of Cabo Engano to Punta Palenque. A Hurricane Watch is in effect for the Dominican Republic from Isla Saona to Cabo Engano.
Status on Sept. 20, 2017
At 11 a.m. EDT (1500 UTC), the center of Hurricane Maria was located inland over Puerto Rico near 18.4 degrees north latitude and 66.5 degrees west longitude. Maria is moving toward the northwest near 12 mph (19 kph), and this general motion with a gradual decrease in forward speed is expected through early Friday, Sept. 22.
Maximum sustained winds are near 140 mph (220 kph) with higher gusts. Maria is a Category 4 hurricane on the Saffir-Simpson Hurricane Wind Scale. Little change in strength is forecast during the next 48 hours, and Maria is expected to remain a dangerous major hurricane through Friday. The estimated minimum central pressure is 930 millibars.
On the forecast track, the center will pass offshore of the northeastern coast of the Dominican Republic tonight and Thursday and then move near the Turks and Caicos Islands and southeastern Bahamas Thursday night and Friday.
For updated forecasts, visit: www.nhc.noaa.gov.
Harold F. Pierce / Rob Gutro
NASA’s Goddard Space Flight Center, Greenbelt, Md.
Sept. 20, 2017 – Update No. 1 – Satellite Animation Shows Hurricane Maria Make Landfall in Puerto Rico, Jose Along East Coast
Credits: NASA’s Goddard Space Flight Center/Ryan Fitzgibbons
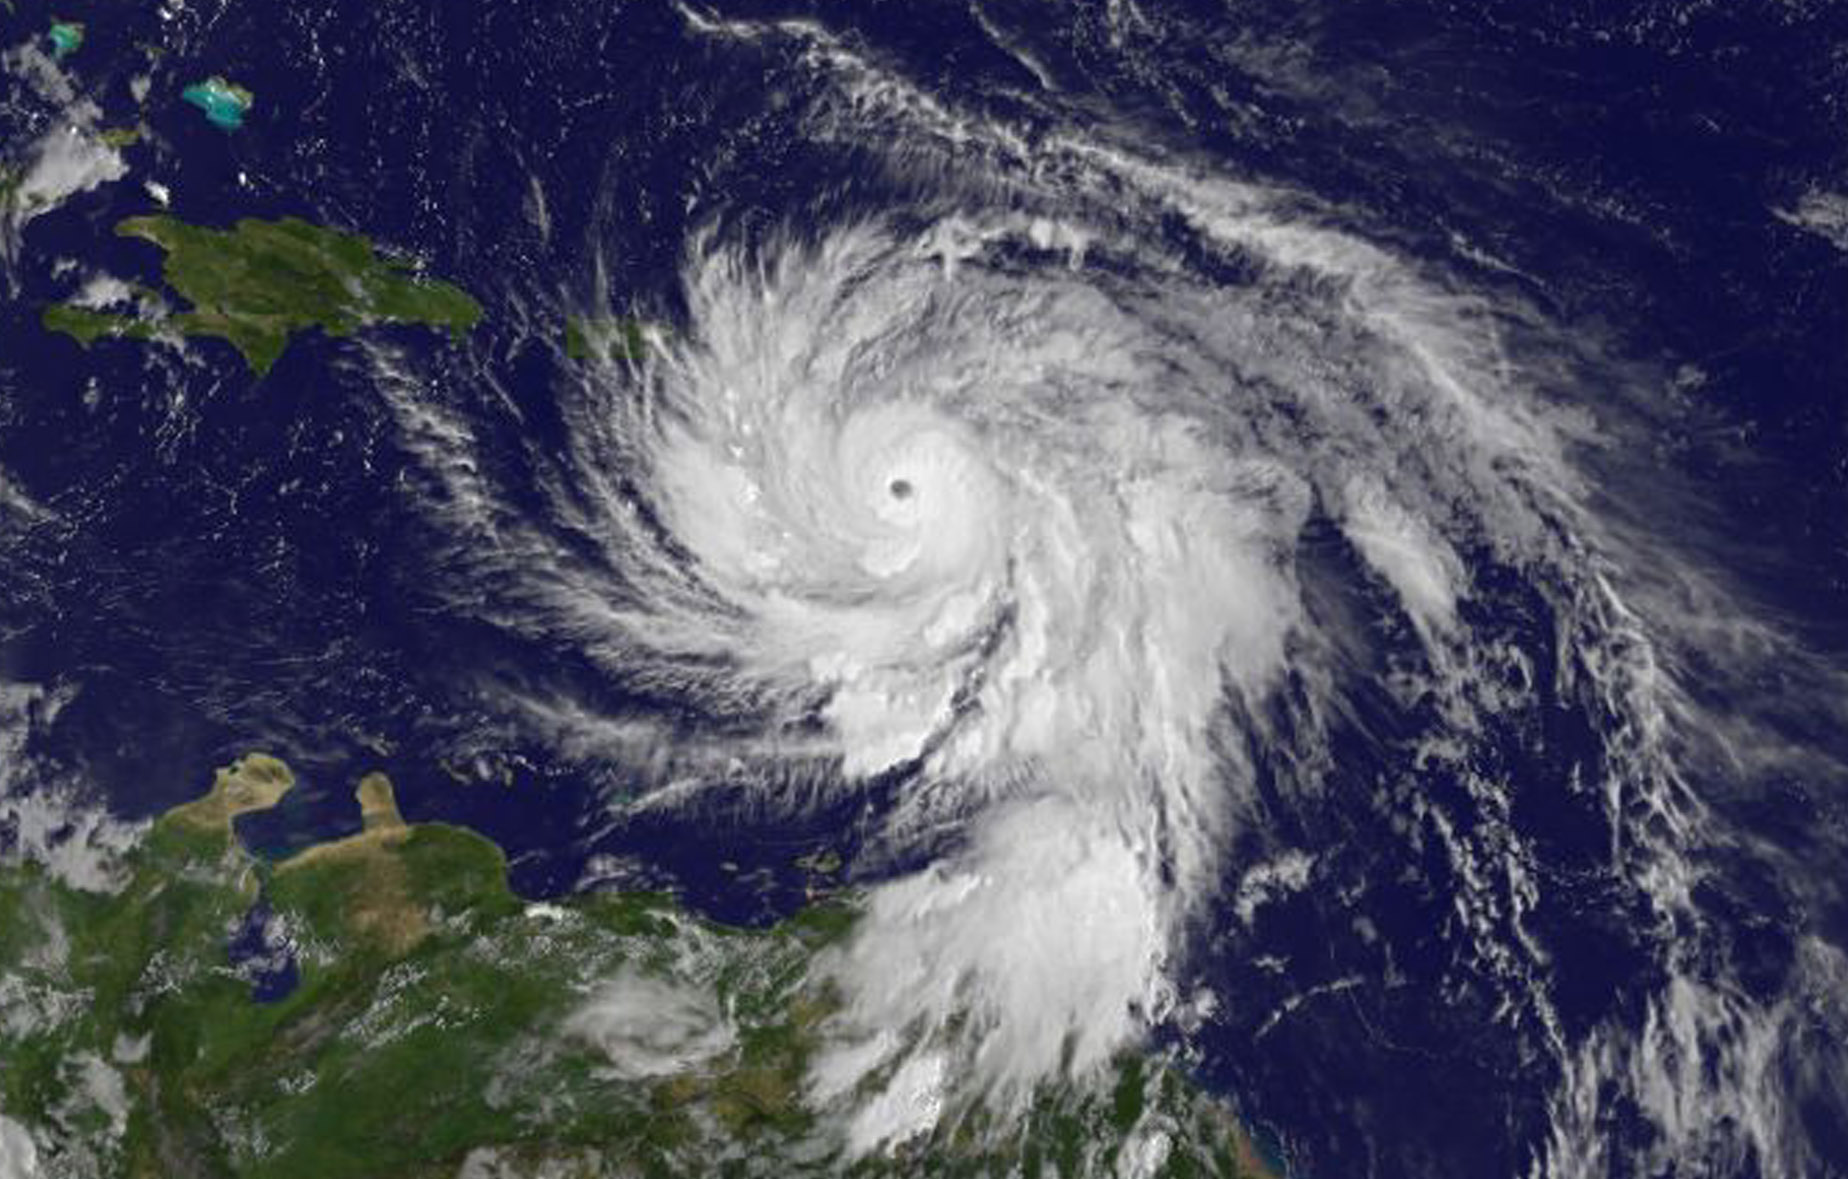
Sep. 19, 2017 – NASA Looks Within Category 5 Hurricane Maria Before and After First Landfall
Satellite data is enabling forecasters to look inside and outside of powerful Hurricane Maria. A NASA animation of satellite imagery shows Hurricane Maria’s first landfall on the island of Dominica. NASA’s GPM satellite provided a 3-D look at the storms within that gave forecasters a clue to Maria strengthening into a Category 5 storm, and NASA’s Aqua satellite gathered temperature data on the frigid cloud tops of the storm.
Maria’s First Landfall
On Monday, Sept. 18 at 9:35 p.m. AST/EDT the National Hurricane Center reported that Maria made landfall on Dominica as a category 5 hurricane. Radar data from Martinique and Air Force Reserve Hurricane Hunter aircraft reports indicated that Maria made landfall on Dominica around 9:15 p.m. AST/EDT (0115 UTC) with estimated winds of 160 mph (260 kph). Dominica is an island in the Caribbean Sea that has mountainous terrain, natural hot springs and tropical rainforests.
NASA Puts Maria’s Past Track in Motion
An animation of NOAA’s GOES East satellite imagery from Sept. 15 at 7:45 a.m. EDT (1145 UTC) to Sept. 19 ending at 4:45 a.m. EDT (0845 UTC) showed Hurricane Jose moving north along the U.S. East coast and Hurricane Maria move through the Leeward Islands and strengthen to a Category 5 hurricane. The animation shows Maria’s landfall in Domenica. The imagery revealed a clear, cloudless eye.
Credits: NASA/NOAA GOES Project
NOAA manages the GOES Series of satellites. The animation was created by the NASA/NOAA GOES Project at NASA’s Goddard Space Flight Center in Greenbelt, Maryland.
NASA’s 3-D Look at Maria
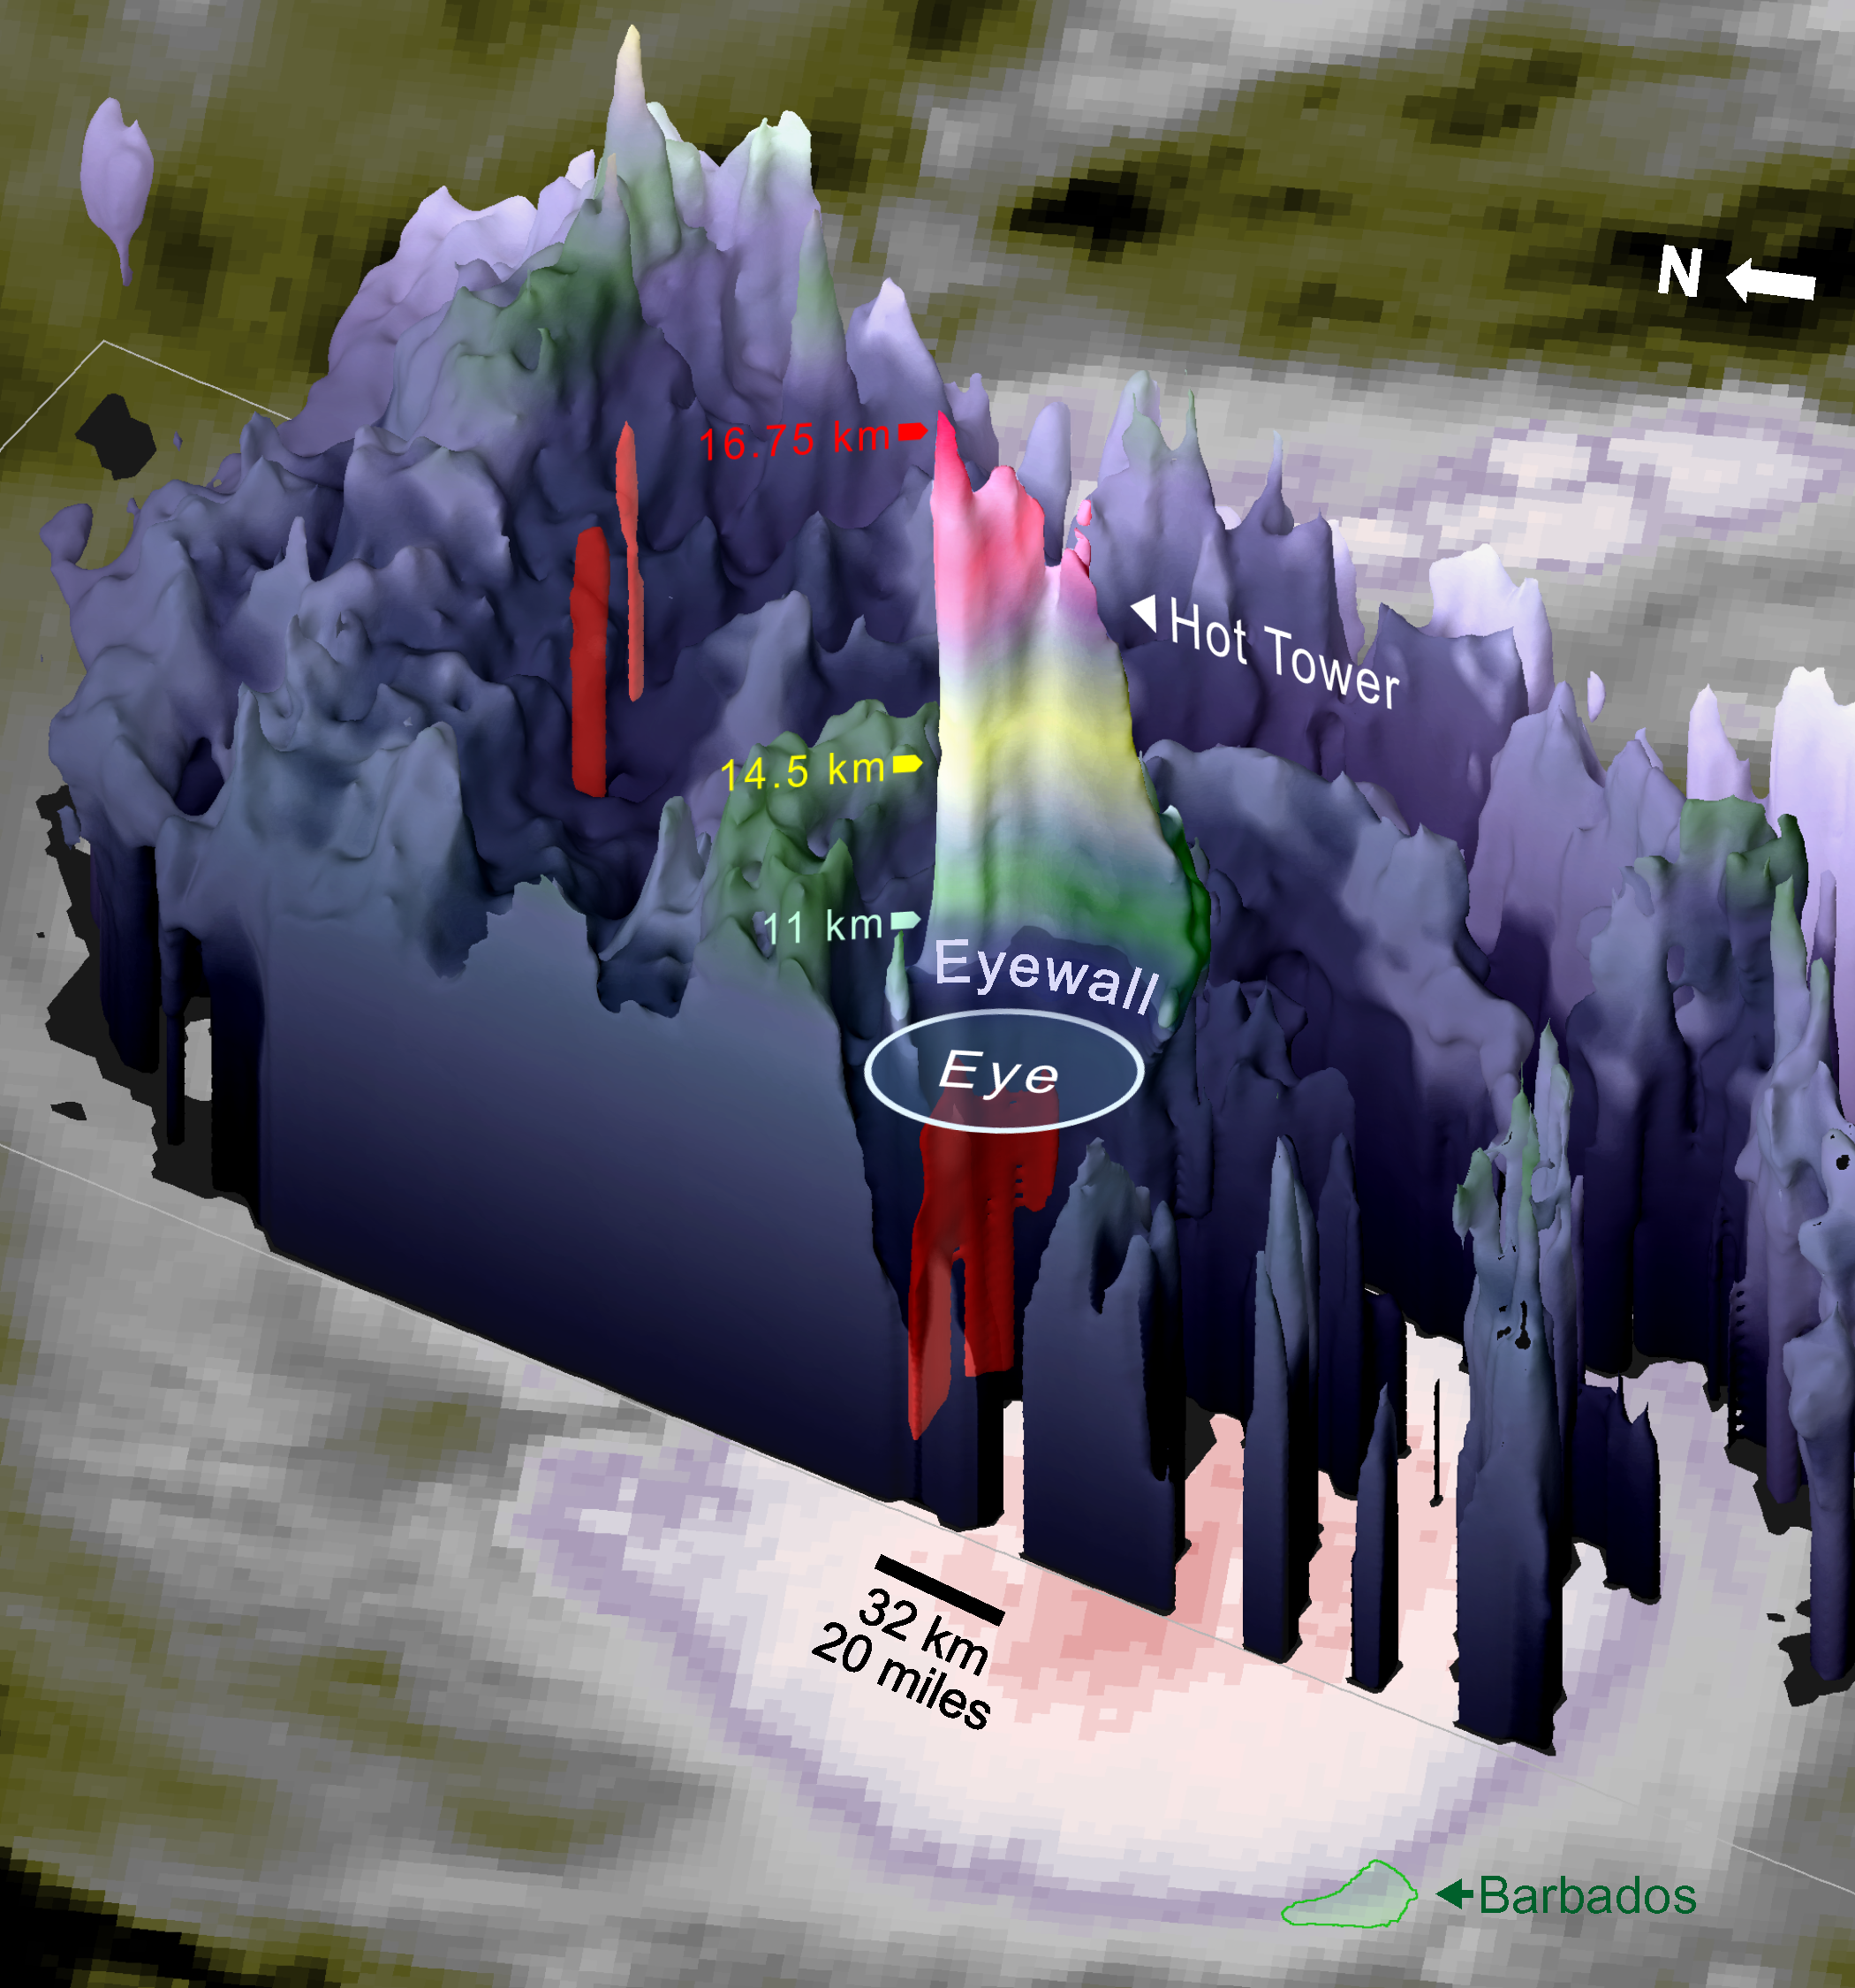
Also at NASA Goddard, a 3-D image of Hurricane Maria was made to understand what was happening within the storm. The dual-frequency radar on the Global Precipitation Measurement (GPM) satellite saw an impressively tall thunderstorms cell of precipitation in the compact eyewall of Hurricane Maria on Monday, Sept.18, 2017. “Enough water vapor was condensing into rain inside of this cell that rapid updrafts developed, rapid enough to lift the precipitation until it froze and then even higher until it penetrated into the lower stratosphere at 16.75 km altitude,” said Owen Kelley of NASA Goddard’s Precipitation Processing System..
“This tall cell (also known as a “hot tower”) was part of a sequence of such cells that were seen by infrared satellite instruments, such as the one on the recently launched GOES-16 satellite. Meanwhile, Maria put on an unexpectedly fast intensification from category 1 to category 3 on the Saffir-Simpson scale on Monday (Sept. 18).”
Research conducted at NASA, at the University of Maryland, Baltimore County, and elsewhere suggests that a sequence of hot towers, also known as a “convective burst,” is one a way to detect that a hurricane’s heat engine going into high gear. The end result is intensified winds circling the eye at the ocean’s surface.
Maria continued to intensify after GPM passed overhead and reached Category 5 status that night.
A Stunning Infrared View of Maria
On Sept. 19 at 2:15 a.m. EDT (0615 UTC) the Moderate Resolution Imaging Spectroradiometer or MODIS instrument aboard NASA’s Aqua satellite analyzed Maria’s cloud top temperatures in infrared light.
MODIS found cloud top temperatures of strong thunderstorms in Maria’s eyewall as cold as or colder than minus 80 degrees Fahrenheit (minus 62.2 Celsius). Cloud top temperatures that cold indicate strong storms that have the capability to create heavy rain.
Warnings and Watches in Effect
The National Hurricane Center warned “potentially catastrophic Hurricane Maria continues west-northwestward toward the Virgin Islands and Puerto Rico.”
A Hurricane Warning is in effect for Guadeloupe, Dominica, St. Kitts, Nevis, and Montserrat, the U.S. Virgin Islands, the British Virgin Islands, Puerto Rico, Culebra, and Vieques. A Tropical Storm Warning is in effect for Antigua and Barbuda, Saba and St. Eustatius, St. Maarten, Anguilla and Martinique.
A Hurricane Watch is in effect for Saba and St. Eustatius, St. Maarten, St. Martin and St. Barthelemy, Anguilla, Isla Saona to Puerto Plata.
Maria’s Location and Status on Sept. 19
At 11 a.m. AST/EDT (1500 UTC), the eye of Hurricane Maria was located near 16.3 degrees north latitude and 63.1 degrees west longitude. That’s about 115 miles (180 k) west of Guadeloupe and about 150 miles (240 km) southeast of St. Croix.
Maria was moving toward the west-northwest near 10 mph (17 kph), and this general motion is expected to continue through Wednesday night, Sept. 20. Maximum sustained winds are near 160 mph (260 kph) with higher gusts. Maria is a potentially catastrophic category 5 hurricane on the Saffir-Simpson Hurricane Wind Scale. Some fluctuations in intensity are likely during the next day or two, but Maria is forecast to remain an extremely dangerous category 4 or 5 hurricane until it moves near or over the Virgin Islands and Puerto Rico.
The minimum central pressure based on data from an Air Force Reserve Hurricane Hunter aircraft is 927 millibars.
On the forecast track, the eye of Maria will move over the northeastern Caribbean Sea today, Sept. 19 and then pass near or over the Virgin Islands and Puerto Rico on Wednesday, Sept. 20.
For updates and effects on wind, storm surge and rainfall, visit: www.nhc.noaa.gov.
Rob Gutro
NASA’s Goddard Space Flight Center
Sep. 18, 2017 – NASA Sees Maria Intensify into a Major Hurricane
NASA and NOAA satellites have provided data on Maria as it strengthened into a major Hurricane headed toward the Leeward Islands. NASA’s Aqua satellite provided an infrared look at Maria that showed cooling cloud top temperatures and NOAA’s GOES satellite provided an animation of imagery that showed the storm developing and strengthening. The GPM satellite found “Hot” towering clouds that indicated strengthening was occurring before Maria became a major hurricane.
Credits: NASA-NOAA GOES Project
Warnings and Watches on Sept. 18
The National Hurricane Center (NHC) issued a Hurricane Warning for Guadeloupe, Dominica, St. Kitts, Nevis, and Montserrat, Martinique, St. Lucia, U.S. Virgin Islands and the British Virgin Islands. A Tropical Storm Warning is in effect for Antigua and Barbuda, Saba and St. Eustatius, St. Maarten and Anguilla.
A Hurricane Watch is in effect for Puerto Rico, Vieques, and Culebra, Saba and St. Eustatius, St. Maarten, St. Martin and St. Barthelemy, and Anguilla. A Tropical Storm Watch is in effect for Barbados, St. Vincent and the Grenadines.
Maria’s Development
On Saturday, Sept. 16 the National Hurricane Center was watching Potential Tropical Cyclone Fifteen. The depression formed at 2 p.m. EDT that day. Three hours later it strengthened into a tropical storm and was named “Maria.” At 5 p.m. EDT on Sunday, Sept. 17, Maria strengthened into a hurricane and continued to strengthen.
GPM Finds “Hot Towers” in Maria Before Strengthening
The Global Precipitation Measurement mission (GPM) core observatory satellite had an excellent view of hurricane Maria when it passed almost directly above the hurricane on Sept. 17, 2017 at 1001 p.m. AST/EDT (Sept. 18 0201 UTC). GPM’s Microwave Imager (GMI) and Dual-Frequency Precipitation Radar (DPR) showed that Maria had well defined bands of precipitation rotating around the eye of the tropical cyclone. GPM’s radar (DPR Ku band) found rain falling at a rate of over 6.44 inches (163.7 mm) per hour in one of these extremely powerful storms northeast of Maria’s eye.
NASA obtained a look at Maria’s precipitation structure using data from GPM’s Radar (DPR Ku band). Intense thunderstorms were found towering to above 9.7 miles (15.7 km). This kind of chimney cloud, also called a “hot tower” (as it releases a huge quantity of latent heat by condensation). These tall thunderstorms in the eye wall are often a sign that a tropical cyclone is becoming more powerful.
About Hot Towers
A “hot tower” is a tall cumulonimbus cloud near the center of a tropical cyclone, often seen prior to intensification. The cloud tops reach at least to the top of the troposphere, the lowest layer of the atmosphere which is approximately 9 miles/14.5 km high in the tropics. These towers are called “hot” because they rise to such altitude due to the large amount of latent heat. Water vapor releases this latent heat as it condenses into liquid. Those towering thunderstorms have the potential for heavy rain. Energy released by rainfall into the center of a tropical cyclone provides the energy upon which tropical cyclones thrive.
Cloud Top Temperatures Show Strengthening
The Atmospheric Infrared Sounder or AIRS instrument aboard NASA’s Aqua satellite analyzed Hurricane Maria in infrared light. Infrared light provides scientists with temperature data and that’s important when trying to understand how strong storms can be. The higher the cloud tops, the colder and the stronger they are. So infrared light as that gathered by the AIRS instrument can identify the strongest sides of a tropical cyclone.
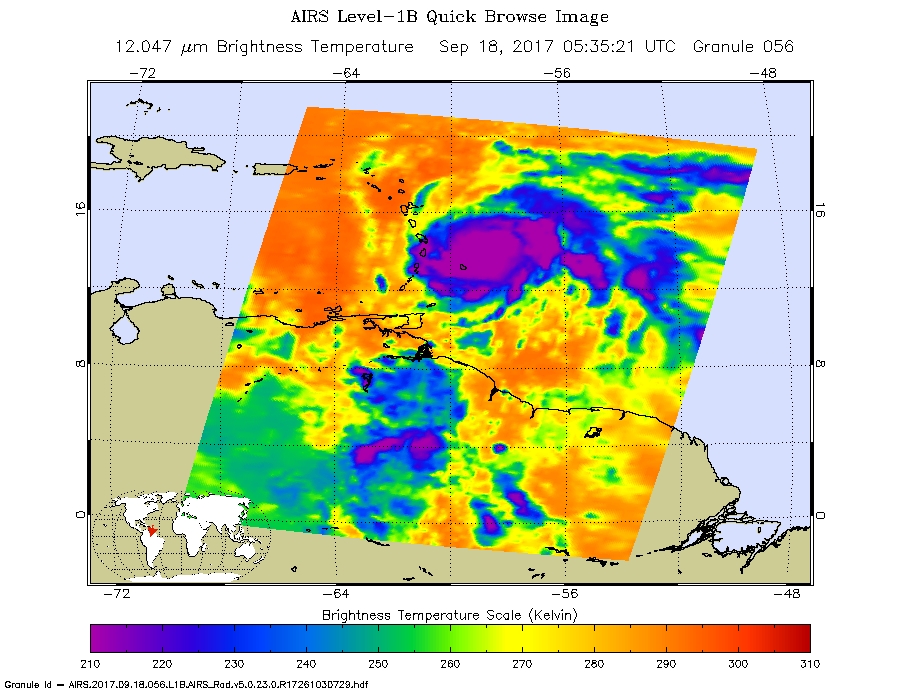
When NASA’s Aqua satellite flew over Maria on Sept. 18 at 1:35 a.m. EDT (0535 UTC) AIRS detected that cloud top temperatures had cooled indicating they were higher into the atmosphere. Cloud top temperatures were as cold as minus 81.6 degrees Fahrenheit (minus 63.1 degrees Celsius). Storms with cloud top temperatures that cold have the capability to produce heavy rainfall.
Satellite View of Maria Strengthening Over Time
At NASA’s Goddard Space Flight Center in Greenbelt, Md. the NASA/NOAA GOES Project created an animation of NOAA’s GOES East satellite imagery from Sept. 14 at 1:45 p.m. EDT (1745 UTC) to Sept. 18 ending at 7:45 a.m. EDT (1145 UTC). The animation shows Hurricane Jose moving north along the U.S. East coast, the development strengthening of Hurricane Maria and its approach to the Leeward Islands, and Tropical Depression Lee in the Eastern Atlantic.
NHC noted the estimated central pressure inside the 10 nautical mile-wide eye has fallen to 959 millibars. The small eye is also apparent in radar data from Martinique.
Maria’s Status on Sept. 18
The NHC said at 11 a.m. AST/EDT (1500 UTC), the center of Hurricane Maria was located near 14.7 degrees north latitude and 60.1 degrees west longitude.
Maria was moving toward the west-northwest near 10 mph (17 kph), and this motion with some decrease in forward speed is expected through Tuesday night, Sept. 19. On the forecast track, the center of Maria will move across the Leeward Islands late today and tonight, over the extreme northeastern Caribbean Sea Tuesday and Tuesday night, and approach Puerto Rico and the Virgin Islands on Wednesday, Sept. 20.
Reports from an Air Force Reserve Hurricane Hunter aircraft indicate that maximum sustained winds have increased to near 120 mph (195 kph) with higher gusts. Maria is a category 3 hurricane on the Saffir-Simpson Hurricane Wind Scale. Additional rapid strengthening is forecast during the next 48 hours, and Maria is expected to be a dangerous major hurricane as it moves through the Leeward Islands and the northeastern Caribbean Sea.
Hurricane-force winds extend outward up to 15 miles (30 km) from the center and tropical-storm-force winds extend outward up to 125 miles (205 km). The minimum central pressure estimated from the Hurricane Hunter aircraft data is 959 millibars.
NHC expects Maria’s eye to move through the Leeward Islands during the afternoon or evening today, Sept. 18.
For updates on Maria, visit: www.nhc.noaa.gov
Rob Gutro / Hal Pierce
NASA’s Goddard Space Flight Center